COIN Ready for Gap Fill?NASDAQ:COIN Coinbase looks ready for move up to at least fill the gap at $359 if not make new all time highs.
Daily RSI printed bullish divergence and price broke out yesterday into bullish market structure. A break above the High Volume Node resistance could see new all time highs sooner than expected!
Analysis is invalidated if we drop below the swing low and that will continue my previous analysis downwards with a target of the ascending 200EMA, High Volume Node support, S1 Pivot at $282.
Safe trading
COIN-M

COIN Trade Setup – Strong R/R at Macro Support ZoneIn our previous trade idea, NASDAQ:COIN surged over 120%, confirming the bullish setup we highlighted. We're now watching a key support zone that offers another high-probability entry with excellent risk-to-reward.
📉 Gap Still In Play
The recent gap-down in price is unfilled, and statistically, such gaps tend to retrace at least 50%. This area also aligns with the golden pocket (Fibonacci 0.618–0.65) — a zone known for sharp reversals and trend continuations.
📈 Trade Levels
Entry Zone: $250–$260
Take Profits: $360 / $420
Stop Loss: Below $225
Bias: Bullish bounce from support, targeting range high flip
🔍 Watch For:
Volume confirmation at support
RSI / Momentum divergence near golden pocket
Break and hold above range high = expansion
This zone offers a low-risk entry before potential continuation of the macro uptrend.

COIN - Are we aligned with BTC/ETH? READY, SET, GO?🕰 Monthly View
Large bullish expansion from demand, with swing structure respected.
Pullback currently rejecting around the 0.618 retracement level.
As long as price holds above the strong support zone near 260–275, bias remains bullish for continuation.
Longer-term targets sit around 400+, with potential re-test of the all-time swing highs later.
📆 Weekly View
Weekly structure shows BOS (break of structure) after expansion.
Price has pulled back into weekly demand (≈275).
Liquidity above 360–380 remains uncollected, suggesting upside targets.
Re-test of supply/liquidity resistance trend likely before continuation higher.
📅 Daily View
Current price hovering around 304 key psychological level (POI).
Retesting breakout zone after liquidity sweep.
Demand alignment (280–300 zone) is crucial: bullish confirmation here opens room for targets at 386–400.
Invalidation if we close below 200 demand zone.
⏱ 4H View
Lower timeframe shows consolidation just above daily demand.
A range return setup is forming, with liquidity built for a possible expansion.
If bulls step in here, expect a sharp impulse move back toward 340–360 short-term.
🎯 Bias & Trade Plan
Bias: Bullish continuation (after retest)
Entry Zone: 280–305 (Daily/Weekly Demand)
Targets:
Short-term → 340–360
Mid-term → 386–400
Invalidation: Break and close below 200
⚠️ Risk Note
COIN tends to move with crypto sentiment (BTC/ETH correlation). Strong volatility expected around psychological levels – wait for rejection/confirmation before entry.

SUI Wave (4) Still Underway?Its unclear weather CRYPTOCAP:SUI wave 4 is complete or still underway as a larger triangle of flat correction, in a ending diagonal wave 4 (defined by wave 4 falling to wave 1 at the 0.5 Fib).
Price terminated 3 waves up at the High Volume Node resistance and is now finding support at the weekly pivot, 0.236 Fibonacci retracement. Further decline brings up the the 0.382 High Volume Node support.
Weekly RSI is at the EQ.
Safe trading

$ETH Did The Poke Above All Time High!As I said in my last update it would be unusual to complete the Elliot wave motif wave without a poke above all time high first and we got that this week adding confluence to an expected retracement ahead in wave 2. Poke above all time high shows long term strength.
Weekly RSI has bearish divergence from the wave 3 top in overbought territory.
Initial target is the (4) bottom and weekly pivot point at $3200 followed by $2800 High Volume Node and then the weekly 200EMA, S1 pivot and High Volume Node support at $2250. I will look out for longs in these areas.
Analysis is invalidated if proceed into price discovery.
Safe trading

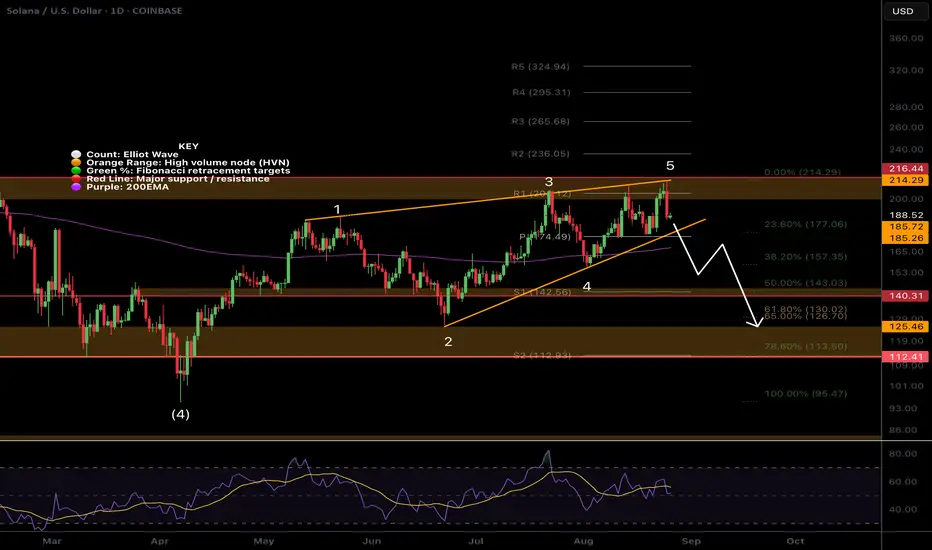
SOL Elliot Wave Count ChangedCRYPTOCAP:SOL Solana appears to have completed an Elliot wave diagonal pattern with a series of ABCs.
Falling below the trend line and 200EMA would confirm this and bring up a first target of $140 at the High Volume Node and 0.5 Fibonacci retracement.
Daily RSI has had bearish divergence for a while. The 'alt-coin golden pocket' 0.786 sits at the wave 2 bottom around $119 which would be a buy for me if price gets down that far.
Safe trading.
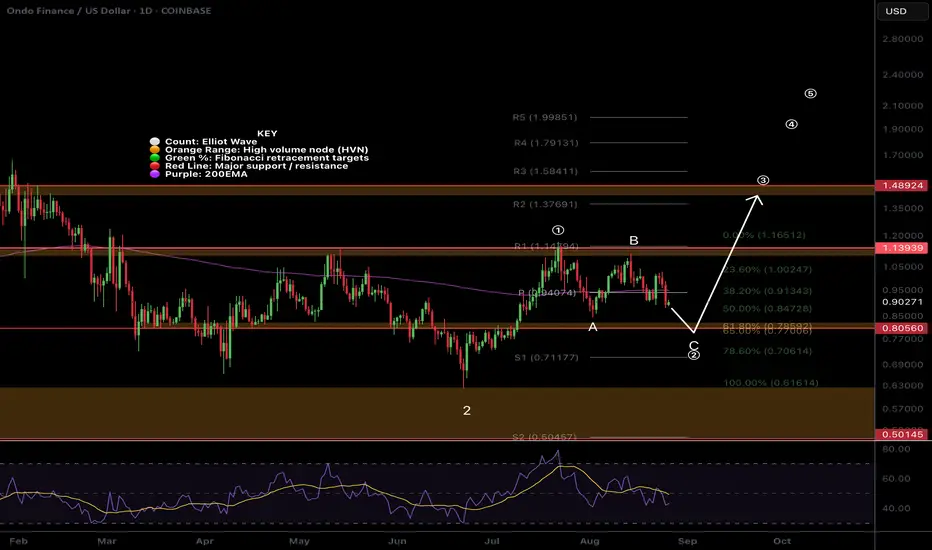
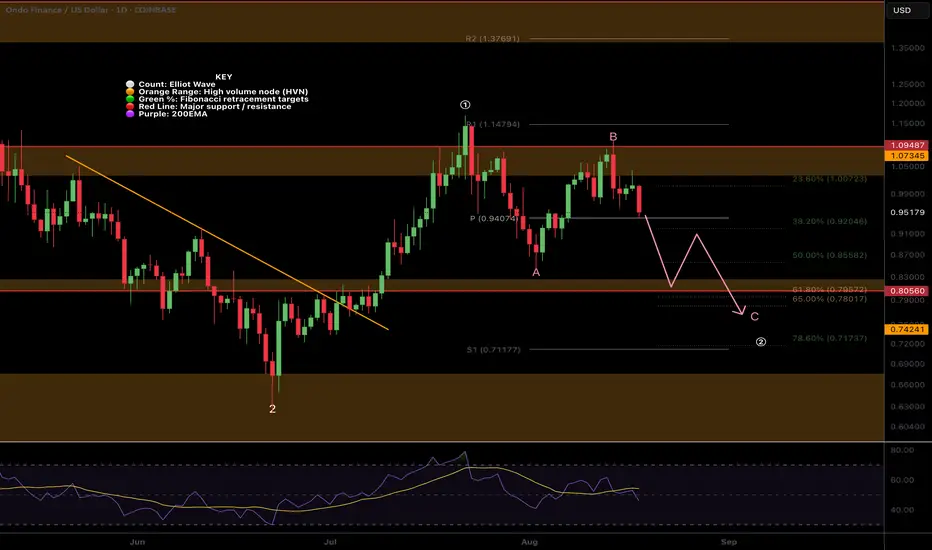
ONDO Wave C of 2 underway?LSE:ONDO appears to be printing wave C of 2 with a target of the High Volume Node and Fibonacci retracement golden pocket.
RSI has room to fall into oversold, price has lost the daily pivot and 200EMA.
Wave (3) has an initial target of $1.48
Safe trading
FET Wave 2 Underway, Triangle InvalidatedWave C of 2 appears to be underway for $FET. With the 1:1 extension target from wave A lines up with the golden pocket retracement and S2 daily pivot so is definitely an area to watch.
RSI has room to fall into oversold.
Price failed 2 tests of the descending daily 200EMA, we expect price to break through on the 4th.
Safe trading

$COIN Local Chart, Still WaitiingNASDAQ:COIN Coinbase is still resetting towards the target of $275 quadruple support - High Volume Node, ascending 200EMA, 0.5 Fibonacci retracement & S2 pivot point.
Daily RSI is setting up with bullish divergence at the moment near oversold.
There is a gap that never filled at the golden pocket ~$217 so this would be the secondary target if we get a deeper sell off.
Safe trading.

AAVE Ending Diagonal?We have some more clarity with the local AAVE pattern and it does appear to be an Elliot wave ending diagonal. After a strong wave 3 ending diagonals form as a terminal pattern with a thrust above the trend line threshold and drop back down to complete a higher degree motif wave 1.
The following retracement has a high probability of terminating at the wave 4 bottom which in this case is at the High Volume Node support and 0.5 Fibonacci retracement at $210.
RSI has printed a series of bearish divergence from overbought but this took a long time to play out!
Analysis is invalidated if price breaks above $400.
Safe trading

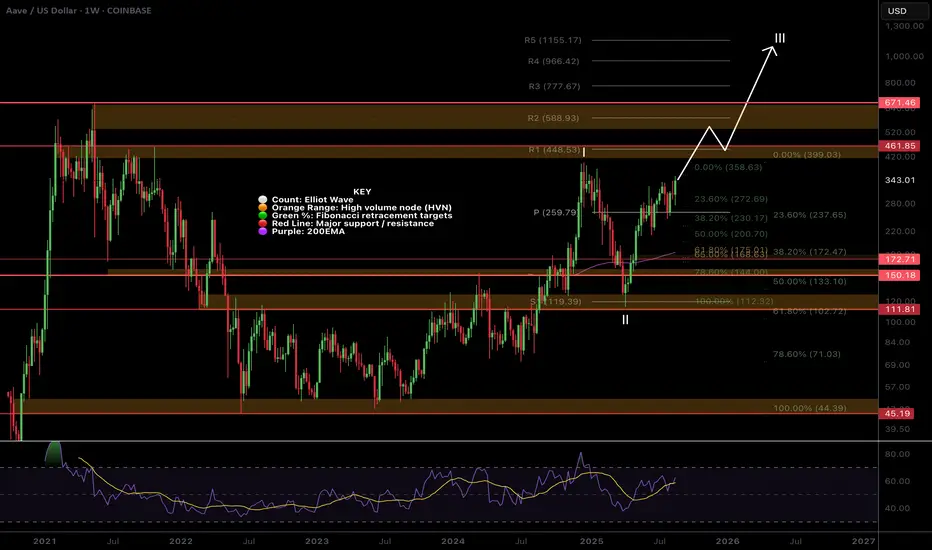
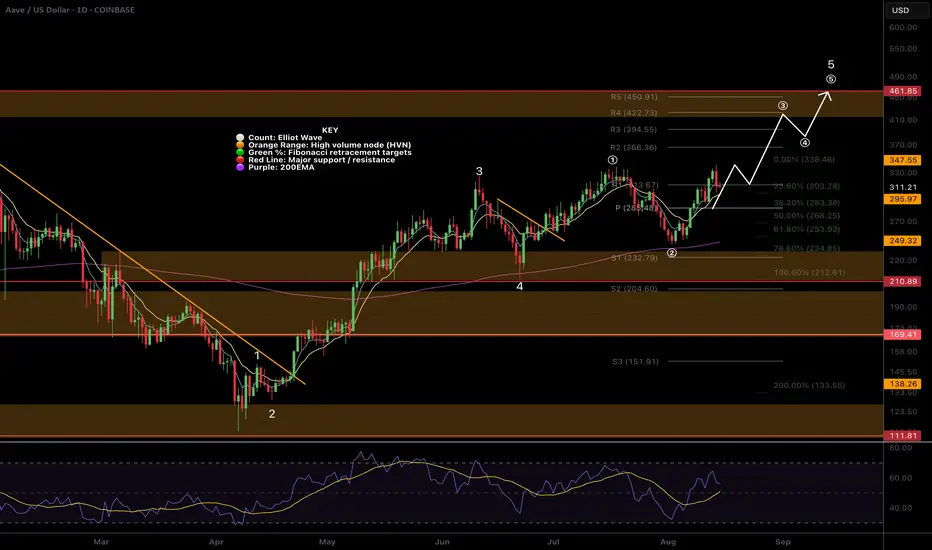
$AAVE Set for all time high?AAVE tested the weekly pivot as support and after a secondary pullback to the 0.236 Fibonacci retracement, sky rocketed alongside BTC and crypto yesterday to a new local high.
Wave III looks truly underway with this kind of price action and the target remains the R5 weekly pivot at $1155. High Volume Node resistance at $460 and $670 are the next targets.
Weekly RSI has plenty of room to grow to get to overbought.
Analysis is invalidated below $111 so plenty of room to breathe!
Safe trading
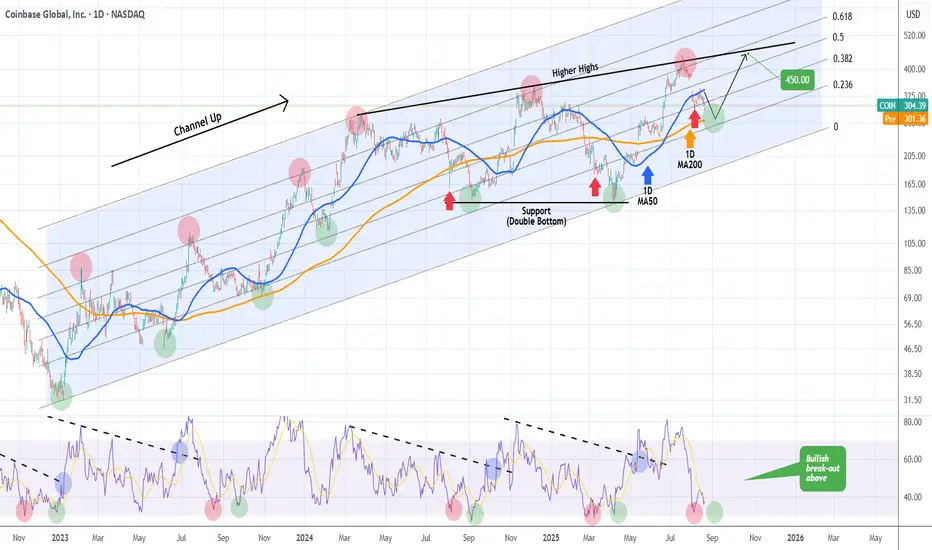
COINBASE about to issue a massive buy signal.Last time we looked at Coinbase (COIN) was more than 3 months ago (May 07, see chart below) where we gave a strong buy signal on its 1D MA50 (blue trend-line), which instantly delivered a rally that eventually hit our $400 long-term Target:
The stock has since dropped off its All Time High (ATH) and is trading right now below its 1D MA50 (blue trend-line). The 1D RSI has given perhaps the most optimal Buy Signal when it double bottoms (red and green circles).
At the moment it has made the first Low and we are anticipating the second, which might very well be on the 1D MA200 (orange trend-line). That would be the signal for maximum gains and our Target will be on the Higher Highs trend-line at $450.
-------------------------------------------------------------------------------
** Please LIKE 👍, FOLLOW ✅, SHARE 🙌 and COMMENT ✍ if you enjoy this idea! Also share your ideas and charts in the comments section below! This is best way to keep it relevant, support us, keep the content here free and allow the idea to reach as many people as possible. **
-------------------------------------------------------------------------------
💸💸💸💸💸💸
👇 👇 👇 👇 👇 👇
Coinbase (COIN) shares fall to a 2-month lowCoinbase (COIN) shares fall to a 2-month low
According to the chart of Coinbase Global (COIN), the stock price of the cryptocurrency exchange is sliding towards the $295 level, a 2-month low.
It is worth recalling that last month we reported that COIN stock had surged to an all-time high around $400. At that time, we:
→ highlighted the long-term grey channel and the short-term blue one;
→ suggested a potential correction from the upper boundary of the grey channel.
Since then, COIN’s share price has declined by more than 20% (yesterday’s drop was fuelled by a broader risk-off sentiment in technology stocks, which we analysed earlier today in the context of the Nasdaq 100 index). If this is indeed a correction from the all-time high, it looks too deep for a bull market. Could COIN shares extend their decline?
Technical analysis of Coinbase (COIN) stock
From a broader perspective, the grey channel remains valid. Following the release of a disappointing earnings report on 1 August, COIN formed a bearish gap and found support near the median of this channel.
Note the price action (highlighted with an arrow) – the bulls attempted to push the price higher but failed. This resembles either a false breakout of the 1 August high or a retest of the gap’s lower boundary – in both cases, a bearish signal. Particularly so given the candlestick with a long upper shadow, forming a gravestone doji pattern.
The MACD indicator suggests “clouds are gathering”: the histogram is approaching zero, while the two lines have turned downward. If the bears manage to build on their advantage, this would imply that:
→ market participants view the psychological $300 level as too high for COIN;
→ the price is moving away from the median of the grey channel and might approach its lower boundary, where buyers typically tend to step in.
If this scenario unfolds, the bears will need to show persistence, given the importance of support at $273.70, where the price rallied strongly in mid-June (a sign of aggressive buying).
It is also worth noting a series of bullish news related to Coinbase (completion of the Deribit exchange acquisition, improved regulatory outlook) – but the stock is already down more than 30% from its record high, which raises concerns.
This article represents the opinion of the Companies operating under the FXOpen brand only. It is not to be construed as an offer, solicitation, or recommendation with respect to products and services provided by the Companies operating under the FXOpen brand, nor is it to be considered financial advice.

Coinbase: Brief Distraction Before Downtrend ContinuesCoinbase has recently experienced a brief uptick but has since resumed its expected downward trajectory. Magenta wave still has some room to push lower in the near term, but it should remain above the support level at $138.45 to allow the upward impulse to eventually break through resistance at $444.65. However, if price falls below $138.45, we will anticipate a new low for turquoise wave alt. 2 , which would delay the expected gains (probability: 33%).

$ONDO ABC Correction in Wave 2?LSE:ONDO wave (c) of 2 appears to be underway after the failure to reach a new local high. However there is strong support just below of the daily pivot and 200EMA.
Failure to hold this level brings up the High Volume Node support and golden pocket at $0.79. RSI has room to fall and the alt-coin golden pocket, Fibonacci 0.786 sits at the S1 daily pivot.
Analysis is invalidated above wave B.
Safe trading
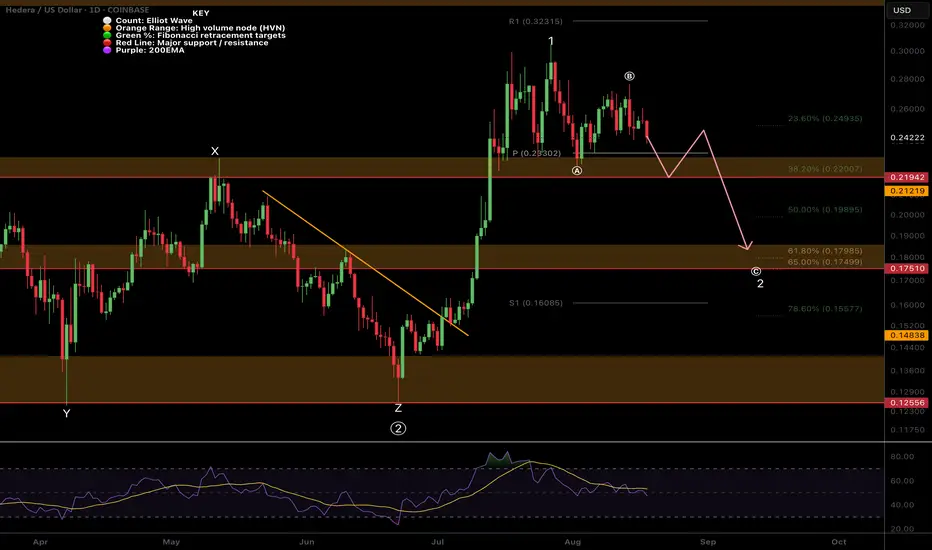
A Local look at the $HBAR retracementWave (c) appears to be underway with a target of the golden pocket and major support High Volume Node at $0.175.
There may resistance at the daily 200EMA along the way but it just seems to floating between supply and demand zones right now.
Daily RSI has room to fall.
Safe trading
$ETH Topping Without All Time High?Has the most anticipated all time high of the year been cancelled? The crowd does not get what it wants! Everyone from CNBC to my grandmas goldfish have been bullish on ETH for the past few months so what a fitting psychological mess it would be if we significantly pulled back here!
Firstly it may just be a temporary set back to the High Volume Node support at $3900 before a move to all time high. Even then I am expecting a deeper pullback to set us up for all time high in Q4. Losing this support bring up the ascending daily 200EMA right at the Fibonacci golden pocket, which you can see is the wave 3 high!
The next target, which is my next buy level, is the larger degree Fibonacci golden pocket, major support High Volume Node and wave 4 bottom at $2100. This would be a capitulation area for many!
RSI has printed confirmed bearish divergence with plenty of room to fall.
Safe trading

$AAVE Local Expanded Flat Correction?CRYPTOCAP:AAVE Elliot wave count could be printing an expanded flat correction in wave 2.
5 waves up complete a motif wave with daily RSI in overbought. 3 clear waves down for wave A (or X) was next followed by a poke above all time on confirmed bearish divergence.
If the count is correct then our first target would be a swing below wave A and the ascending daily 200EMA at point . Further decline in wave C (or Z) brings up the previous wave 4 target and the High Volume Node major support $210 point
A steeper decline in wave 2, aligning with my September dump idea, brings up the golden pocket at but a more likely target is the alt-coin golden packet at 0.786, s3 daily pivot and High Volume Node support . This would be a great buy opportunity for me.
Safe trading

COIN- Loading Up Before the Next Crypto WaveCoinbase (COIN) is setting up for another big swing as crypto momentum keeps building. I’m looking to scale in with layered entries and ride the volatility to higher levels.
🔑 Entry zones:
First buy: $295
Second buy: $275
Deep buy: $245
🎯 Profit targets:
TP1: $330 ✅
TP2: $350 🚀
TP3: $375+ 💰
⚠️ Disclaimer: This is just my personal trading plan, not financial advice. Do your own research and manage your risk!

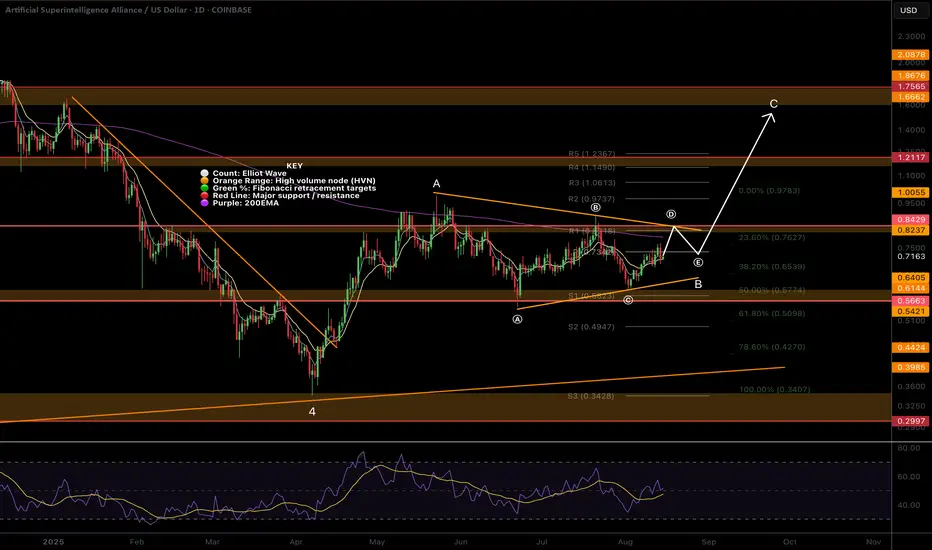
$FET Elliot Wave Updated, Triangle forming?NYSE:FET appears to be printing a triangle in a larger degree wave B of an ABC counter-bear trend correction.
Wave (D) is expected to finish at the descending resistance, poking above the daily 200EMA, while wave (e) is often shallow so expected to end at the daily pivot point. The target is $1.6 at he triangle pattern depth and major High Volume Node resistance.
An ABC corrective wave does not mean that the macro count is invalidated and may form part of larger ending diagonal series of ABCs to achieve my high degree wave 5 targets above all time high. I will update the weekly chart to reflect this shortly.
Safe trading
$AAVE Continues to follow the path!CRYPTOCAP:AAVE was immediately reject from the swing high as expected, per the percentage band take profit rules.
Daily RSI has plenty of room to grow to reach the all time High Volume Node resistance which is the next target at $430.
Based on the depth of wave (2) after touching the daily 200EMA as support, wave 3 is still underway to complete the larger degree wave 5 with a poke above all high, the highest probability terminal target per Elliot wave rules.
Safe trading
For those interested in trading signals / diary & trade management / trading parameters etc... Signals updated for 15/08/25
✅ LSE:ONDO DEMA Percentage Band rule added
✅ CRYPTOCAP:BTC hit take profit #2 for 2.59RR
✅ CRYPTOCAP:AAVE (DEMA) HIt take profit 1 for 1.45RR
✅ CRYPTOCAP:ADA moved 10% after signal activation but still not hit take profit 1
✅ NASDAQ:AAPL (Apple) very close to take profit #1
✅ BTC added to completed trade signals along side Take profit 2 for google, 700, HBAR and a few stop (INJ, SOL, BTDR) and invalidations for META, SHIBINU, WLD)
Safe trading
BTC | Long Idea – All-Time Highs LoadingBTC | Long Idea
📊 Market Sentiment
Overall sentiment remains bullish, supported by expectations of a 0.25% rate cut in the upcoming FOMC meeting. A weakening USD and increasing global risk appetite are providing favorable conditions for further upside in crypto assets.
📈 Technical Analysis
Price formed a 4H demand zone and immediately retested it, showing a strong bullish reaction.
That retest offered a perfect entry, but there’s still potential for another move back to the demand zone before pushing higher.
The 1H swing low liquidity sits in confluence with both the 4H demand zone and the 0.5 Fibonacci retracement level — a strong triple confluence.
This alignment occurs around the $120,000 level, making it a key watchpoint.
📌 Game Plan
Wait for price to revisit the 4H demand zone.
Look for a sweep of the 1H swing low liquidity.
See the 0.5 Fibonacci level tapped for maximum discount before continuation.
🎯 Setup Trigger
Look for a 1H market structure break after price taps the $120,000 confluence zone.
📋 Trade Management
Stoploss: Below the 1H swing low that confirms the break of structure.
Target: Direct push towards all-time highs at $123,300.
💬 Like, follow, and comment if you find this setup valuable!
Disclaimer: This is not financial advice. The content is for informational and educational purposes only and reflects personal opinions.

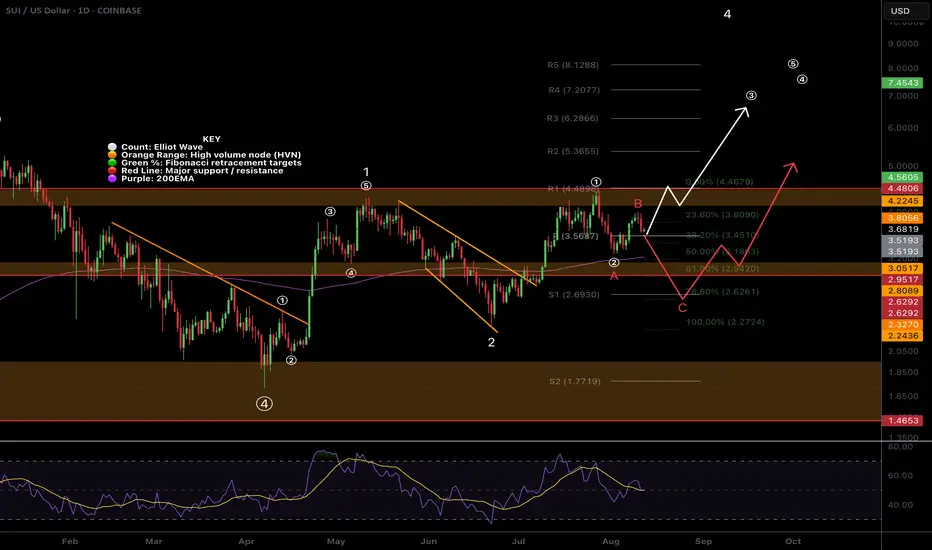
$SUI Short term bearish move coming?CRYPTOCAP:SUI is currently testing the daily pivot as support which must hold to keep the bullish count alive.
I have 2 Elliot Wave counts, short term bullish and bearish that I am patiently waiting to see unfold. Long term is still bullish.
The white count suggests that we have printed a micro wave (1) and are completing a wave (2) now at the daily pivot just above the daily 200EMA where price should move powerfully in a wave (3) of 3 upwards.
Alternatively, the red count, wave B of a larger corrective could also be complete at the recent swing high and losing the pivot and daily 20EMA would confirm this. Wave C has an initial target of the triple support 0.618 Fibonacci retracement, daily 200EMA and major support High Volume Node at $3 to complete wave 2 and a secondary target of the alt-coin golden pocket 0.786 Fibonacci retracement and S1 daily pivot at $2.7
The bearish analysis is my preferred count due to the amount of confluence, including the fact we are entering mid August and this move would also push daily RSI back into oversold.
This would set up new long signals so look out for those in the Substack Trading Signals
Safe trading