BTCUSDT – Weak Technical Rebound, Downtrend Still in ControlHello everyone, looking at the current D1 chart, Bitcoin is showing a relatively weak rebound that appears more technical in nature rather than a true trend reversal. In the context of December 2025, the market still lacks a strong enough catalyst to draw capital back into crypto, while the medium-term price structure has not improved.
From a news and capital flow perspective , BTC is clearly underperforming gold. In 2025, global capital has favored defensive assets: gold continues to print new all-time highs, while Bitcoin lacks a compelling narrative. Spot ETF momentum has cooled, the halving is already behind us, and there are no major upgrades significantly impacting supply–demand dynamics. Although the Fed has begun cutting rates, policy remains insufficiently dovish to create a strong risk-on environment for crypto. At the same time, the correction in U.S. equities has reinforced a broader cautious sentiment.
From a D1 technical standpoint , BTC remains below both the EMA34 and EMA89, confirming that the medium-term downtrend is still intact. Each rebound has formed a lower high, while buying volume is noticeably weaker than selling pressure. The 88,000–86,000 USD support zone is being tested, and the failure to reclaim EMA34 increases the risk of a downside break.
Personally, I lean toward a scenario where BTC sees another leg down toward the 86,000 level, or even 84,000 USD, before entering a new accumulation phase. A sideways range between 88,000 and 93,000 would only be likely if volatility completely dries up and the market continues to wait for clearer signals from the Fed.
What do you think? Is Bitcoin preparing to form a bottom, or is this just a pause before a deeper decline?
Coins

BTC Update: Chop, Chop, Chopping Wood. Don't get shaken out. BTC Update: Price is doing exactly what I was expecting after the prior expansion phase - chopping and grinding rather than resolving immediately. Despite the growing panic and bearish sentiment, the market has not seen a true downside flush yet. From a structural perspective, this still looks like a higher timeframe consolidation rather than a full trend breakdown.
On the weekly, BTC remains above major cycle support, and the recent weakness appears more corrective than impulsive. Historically, these types of ranges tend to resolve with one final liquidation move to reset positioning. I’m still watching for a sharp downside extension into the ~$70k region, which would represent a deeper test of higher timeframe demand and a more complete sentiment washout.
What stands out most right now is sentiment. Fear has escalated quickly relative to actual structural damage, which is typically what you see before a final flush, not after one. Until that move happens, I expect continued volatility and frustration as the market works through excess leverage.
Assuming a proper reset plays out, this would likely set the stage for a cleaner continuation higher into early next year. For now, patience is key - this phase is about letting the market finish its reset before the next sustained leg develops.

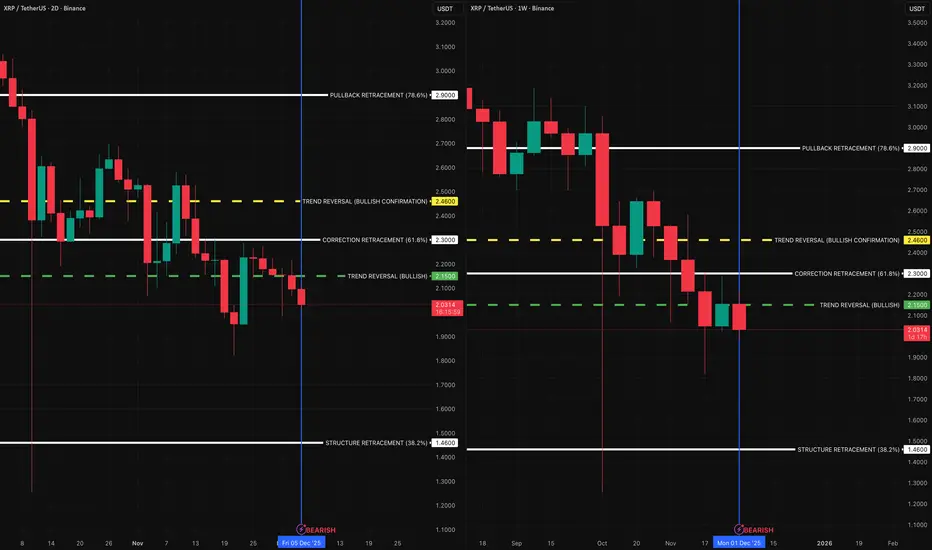
XRP — Structural Breakdown Classification (2D + Weekly)XRP has now entered a bearish classification across both the 2-Day and Weekly charts. The structure that supported the prior trend has been fully compromised.
The initial bearish structure shift began on the 2-Day chart at $2.05, which was the Origin level where momentum first transitioned. The Weekly chart confirmed its own structural reversal at $2.15, where XRP lost its higher-timeframe trend support.
Price also broke through the closest structural retracement at $2.30, which served as the final holding point of the prior trend. With that level gone, XRP is now operating inside a confirmed structural downturn.
The next structural reference levels beneath current price sit at:
• $1.64 — the nearest intermediate retracement zone
• $1.46 — the next major structural support layer
These levels are simply the next logical points in the framework where structure has historically responded. They are not predictions, but rather reactive reference zones based on how the trend has already unfolded.
This classification reflects the beginning of a bearish trend cycle, identified strictly through structural deterioration — not forecasting. As long as XRP remains beneath the reversal levels of $2.05 (2D) and $2.15 (Weekly), the underlying classification remains bearish.
XRP — [2D] WEEK 49 TREND REPORT | 12/05/2025XRP — WEEK 49 TREND REPORT | 12/05/2025
Ticker: BINANCE:XRPUSDT
Timeframe: 2D
This is a reactive structural classification of XRP based on the weekly chart as of this timestamp. Price conditions are evaluated as they stand — nothing here is predictive or forward-assumptive.
⸻
1) Current Trend Condition [ Numbers to Watch ]
Current Price @ 2.03
• Trend Duration @ +22 Days ( Bullish )
• Trend Reversal Level ( Bullish ) @ 2.05
• Trend Reversal Level ( Bullish Confirmation ) @ 2.26
• Correction Retracement @ 2.41
• Structural Support @ 1.64
⸻
2) Structure Health
• Retracement Phase:
Testing Structure (approaching 38.2%)
• Position Status:
Unstable (price below both structural layers)
⸻
3) Temperature :
Cooling Phase
⸻
4) Momentum :
Bearish
⸻
Author’s Note
DOWNWARD STRUCTURAL ALIGNMENT
This mark identifies a moment where the market showed clearer alignment with downside direction. It does not predict future movement, but acknowledges where weakness became more evident within the prevailing structure. Its relevance remains only while price continues to hold beneath key structural boundaries.
⸻
Methodology Overview
This classification framework evaluates directional conditions using internal trend-interpretation logic that references price behavior relative to its structural layers. These relationships are used to identify when price movement aligns with the framework’s criteria for directional phases, transition points, or regime shifts. Visual elements or structural labels reflect these internal interpretations, rather than explicit trading signals or preset indicator crossovers. This framework is observational only and does not imply future outcomes.

BTC — [2D] WEEK 49 TREND REPORT | 12/05/2025BTC — WEEK 49 TREND REPORT | 12/05/2025
Ticker: BINANCE:BTCUSDT
Timeframe: 2D
This is a reactive structural classification of BTC based on the weekly chart as of this timestamp. Price conditions are evaluated as they stand — nothing here is predictive or forward-assumptive.
⸻
1) Current Trend Condition [ Numbers to Watch ]
Current Price @ 89,200
• Trend Duration @ +98 Days ( Bullish )
• Trend Reversal Level ( Bullish ) @ 103,400
• Trend Reversal Level ( Bullishh Confirmation ) @ 103,400
• Pullback Support @ 100,002
• Correction Support @ 79,436
⸻
2) Structure Health
• Retracement Phase:
Correction (approaching 61.8%)
• Position Status:
Unstable (price below both structural layers)
⸻
3) Temperature :
Cooling Phase
⸻
4) Momentum :
Bearish
⸻
Author’s Note
DOWNWARD STRUCTURAL ALIGNMENT
This mark identifies a moment where the market showed clearer alignment with downside direction. It does not predict future movement, but acknowledges where weakness became more evident within the prevailing structure. Its relevance remains only while price continues to hold beneath key structural boundaries.
⸻
Methodology Overview
This classification framework evaluates directional conditions using internal trend-interpretation logic that references price behavior relative to its structural layers. These relationships are used to identify when price movement aligns with the framework’s criteria for directional phases, transition points, or regime shifts. Visual elements or structural labels reflect these internal interpretations, rather than explicit trading signals or preset indicator crossovers. This framework is observational only and does not imply future outcomes.

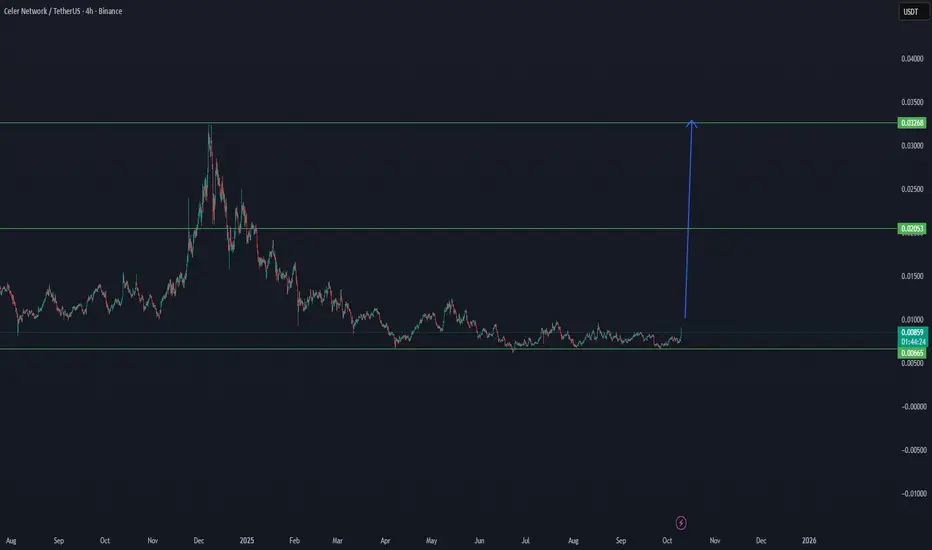
CELR NEW CYCLE ON WAYCELER NETWORK (CELR/USDT) — Cycle Bottom Formed, Reversal Phase Loading 🔄
CELR is showing clear signs of accumulation near the cycle bottom zone between $0.0066 – $0.0088, a range historically known for reversals and strong recovery moves.
📉 Accumulation Base: $0.0066 – $0.0088
🟢 Current Structure: CELR is stabilizing after prolonged downtrend pressure, building strength in a low volatility range — often a signal before a new expansion phase.
📈 Next Major Targets:
First resistance zone: $0.0205
Main cycle target: $0.0326
A breakout confirmation above $0.0100 would likely activate a new bullish cycle, potentially mirroring previous macro moves from similar levels.
Summary:
CELR/USDT is trading in its historical low region, suggesting a high-reward accumulation zone. As momentum returns to mid-cap alts, CELR could be among those leading the next cycle push.
🎯 Targets: $0.0205 → $0.0326
📊 Bias: Bullish Accumulation Phase
BARD/USDT THE RETURN TO $1.50From now the $0,90 zone there is good chance in the coming time that BARD can return to $1.50

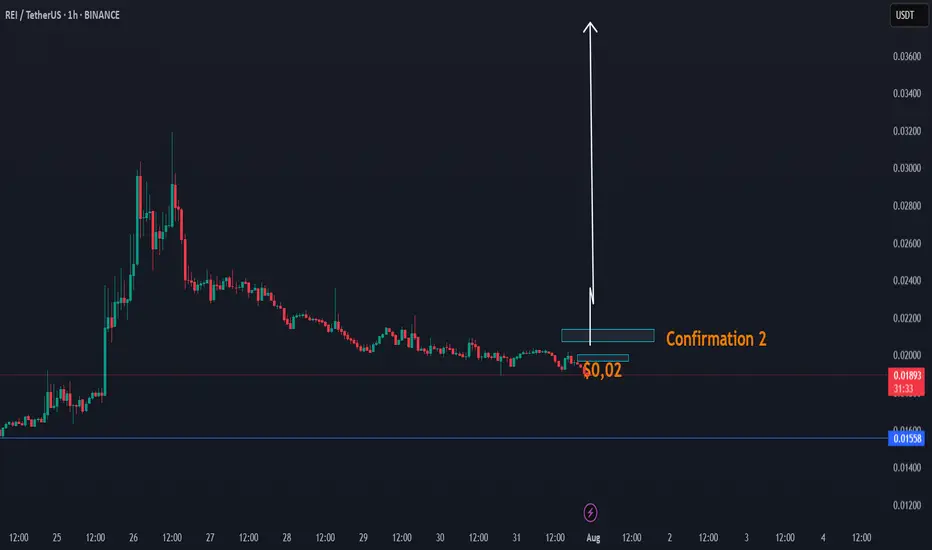
DAY UPDATE REI/USDT THE INCREASE CANDLE OF UP $0,03 - $0,05REI is an interesting coin since the update of Q4
We have seen that this coin was able to increase to $0,031 and until here $0,018 zone, a return to where we are now. There is a high chance that this coin can recover next 24H if this coin is able to confirm the confirmation $0,02 - $0,021
This coin, as before, was targeted at $ 0.02 and had low volume. We expect that if it comes back to $ 0.02, it will be confirmation of the volume, which can take the trend with a candle to up $0,03
REI CONFIRMATIONS ZONE
Higher time frame
When you look normally at this coin, then this coin is in a trend line of breakdown. This can change with the next confirmations. The question is, are we going to see again $0,02 the next 24h? If yes high chance of a break.
We also have a cycle update 2025, check it here, expecting $0,90
/3.5 The Winner's Psychology & The Hunt for Trade
Introduction: The Dangerous Time of Euphoria
I want to start by thanking you for the phenomenal support for the "Altseason: Live" experiment. We closed Round 1 with a +92% profit on the initial capital from just two trades.
But I need to be brutally honest with you: the most dangerous time is just beginning. Let's be clear: for these two months, I won't be chasing a conservative 3% per month. I will be trading quite aggressively.
That's why, in the coming weeks, you will see various coins "pump" without any logic. Your inner FOMO will be screaming at you: the feeling that you're late, you're in the wrong coin, you've missed out. In this frenzy, many will jump on a moving train. And my forecast remains: sometime around July 17th to 21st, the market will brutally shake out these passengers.
My Philosophy: The Battle with the Main Enemy—My Own Euphoria
After a huge win like +92% on the portfolio, it's very easy to get caught up in the "winner's high." A dangerous confidence appears, the feeling that you've figured out the market and that it will always be like this. This is a trap.
That is why I did something that might seem illogical: I cut my position size for the next trades by a factor of four.
Why? To tame that euphoria. To prove to myself that discipline is more important than elation. To remember that my win rate is not 100%, and a single losing trade on a wave of overconfidence can wipe out all the previous hard work. The most important thing is my inner calm.
Of course, when I talk about "calmness" in the context of futures, leverage, and altcoins, it sounds ridiculous. I get that. But striving for inner composure is the only shield a trader has.
My core principle remains unchanged: Fear losing more than you fear missing out on gains.
The Hunt for Leaders: My Methodology for Picking the Next Trade
Rebranding and New Tokenomics:
When a project undergoes a rebrand, it almost always means the team has a plan. The pressure from old sellers decreases, and the probability of a subsequent rally is high.
' Smart Money' Footprints (Accumulation):
This is my favorite pattern. Long periods of accumulation at certain levels, anomalous volumes, and candles with long wicks—all of this indicates that a major player has entered a position and is preparing for a breakout.
New Listings and Unique Patterns:
Projects recently listed on top exchanges don't have the "baggage" of disappointed holders. Over the years, I've noticed certain unique patterns in their charts that have a high probability of leading to growth.
The Art of the Entry: Hunting for the Entry Point
I try to enter positions with limit orders, and I always wait for a pullback. I look for an entry on a local correction when panic is shaking out the random passengers.
Hunt for your entry point. That is the most important thing.
The Golden Rule: Not a Single Step Without a Stop-Loss
Trading without a stop-loss is suicide. Accepting a small, planned loss is not a weakness but a part of the professional game.
What's Next?
I've already missed one coin I wanted to trade—it took off without me. I didn't chase it. Now, I am patiently waiting and searching for the next setup that meets ALL of my criteria.
The "Altseason: Live" experiment continues. You can watch everything in real-time on my streams. The hunt is on.
Thank you for your attention.
Best Regards EXCAVO
Kava : Day trade volumeKava can show new volume on day trade volume. We will follow this coin in the coming time frames for the uptrend.

ALPACAUSDT HourlyTechnical AnalysisALPACAUSDT HourlyTechnical Analysis
Alpaca Finance Coin indicators are POSITIVE.
The coin saw a strong upward movement following the news of its delisting from Binance. High returns continue in this cryptocurrency. Alpaca Coin, which experiences periodic price surges, is currently priced near its 21-day moving average. Due to low liquidity, it exhibits sharp price movements, making it a favorite among short-term traders.
While it appears calm at the moment, we believe Alpaca Finance may resume its upward trend over time.
If it breaks above the 21-day moving average, the 0.254 resistance level will be the next target.
In the case of sharp sell-offs, the 0.160 support level will be monitored.
Based on 2-week price movements, Alpaca has shown returns of 558% - 285% - 93% - 110% - 106% - 61% at various points.
This is a high-risk cryptocurrency. This is not investment advice.
Resistances: 0.254 - 0.260 - 0.268 - 0.279 - 0.306 - 0.314 - 0.345 - 0.372 - 0.410
Supports: 0.220 - 0.205 - 0.160
THIS IS NOT INVESTMENT ADVICE.
The information, comments, and suggestions here do not constitute investment advisory services. Investment advisory services are provided under a formal agreement between clients and licensed institutions such as brokerage firms, portfolio management companies, and non-deposit banks.
The content on this page reflects only personal opinions. These opinions may not be suitable for your financial situation or your risk and return preferences. Therefore, investment decisions should not be made solely based on the information and commentary provided on this page.
We’d appreciate it if you follow and like us so you don’t miss our analyses with positive or risky technical indicators.

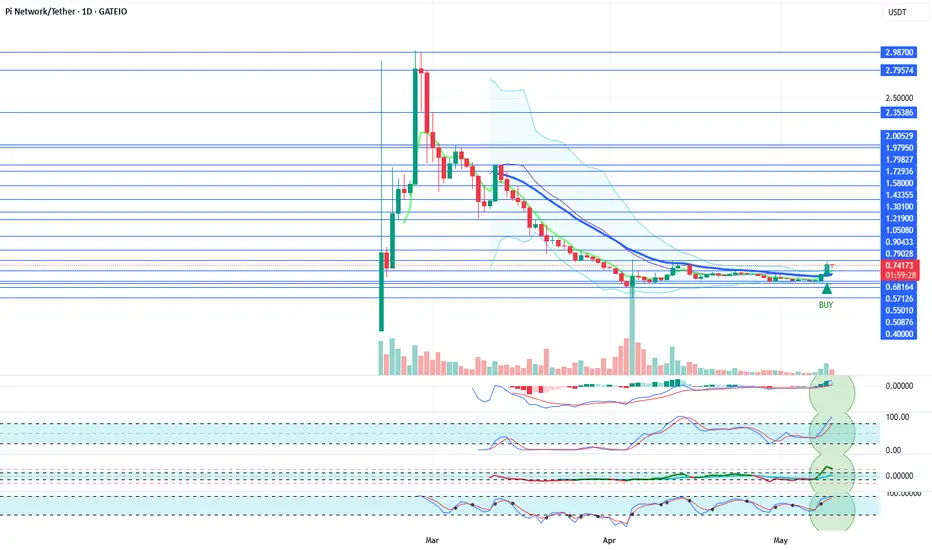
PIUSDT Daily Technical AnalysisPIUSDT Daily Technical Analysis
Pi Network Coin indicators are POSITIVE.
It has broken above the 21-day moving average and managed to stay above it.
The announcement that the Pi Network team will make about its ecosystem on May 14th could significantly benefit the project and increase activity around the cryptocurrency.
Resistance: 0.79028 - 0.90433 - 1.05080
Support: 0.68164 - 0.57126 - 0.55010
New and positive news from the Pi Network team could support a price increase.
At these levels, accumulating Pi Network Coin for long-term investment could be considered potentially profitable. The decision is yours. This is not investment advice.
In the long run, there is a possibility that Pi Network Coin could retest the $3 levels.
For users who use the Pi app and hold locked Pi Network Coins, if there is no urgent need, they may consider re-locking their coins for another 2 weeks. They can continue this strategy by monitoring the price every two weeks.
In the long term, the probability of the price reaching much better levels remains high.
THIS IS NOT INVESTMENT ADVICE.
The information, comments, and suggestions here do not fall under investment advisory services. Investment advisory services are provided under an agreement between clients and authorized institutions such as brokerage firms, portfolio management companies, and non-deposit banks.
The content of this page reflects only personal opinions.
These views may not be suitable for your financial situation or your risk and return preferences. Therefore, investment decisions should not be made based solely on the information and content on this page.
We’d appreciate it if you could follow and like us so you don’t miss our analyses with positive or risky technical indicators.
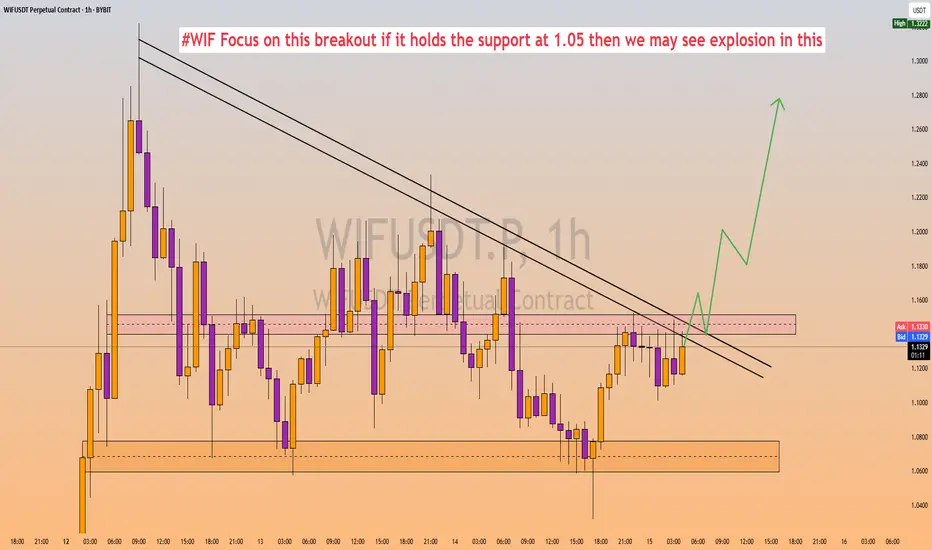
$WIF Breakout Alert – Massive Move Incoming?#WIF is approaching a key breakout zone. If the price holds the $1.05 support, we could see a strong bullish explosion. The breakout of the descending trendline and reclaim of the resistance zone (~$1.15) may push the price toward $1.27+ targets. Keep this on your radar! 📈
🔹 Resistance to watch: $1.15
🔹 Support: $1.05
🔹 Breakout Target: $1.27
📊 Timeframe: 1H (Bybit)
PIUSDT Daily Technical AnalysisPIUSDT Daily Technical Analysis
Pi Network Coin indicators are POSITIVE.
It has broken above the 21-day moving average and managed to stay above it.
The announcement that the Pi Network team will make about its ecosystem on May 14th could significantly benefit the project and increase activity around the cryptocurrency.
Resistance: 0.79028 - 0.90433 - 1.05080
Support: 0.68164 - 0.57126 - 0.55010
New and positive news from the Pi Network team could support a price increase.
At these levels, accumulating Pi Network Coin for long-term investment could be considered potentially profitable. The decision is yours. This is not investment advice.
In the long run, there is a possibility that Pi Network Coin could retest the $3 levels.
For users who use the Pi app and hold locked Pi Network Coins, if there is no urgent need, they may consider re-locking their coins for another 2 weeks. They can continue this strategy by monitoring the price every two weeks.
In the long term, the probability of the price reaching much better levels remains high.
THIS IS NOT INVESTMENT ADVICE.
The information, comments, and suggestions here do not fall under investment advisory services. Investment advisory services are provided under an agreement between clients and authorized institutions such as brokerage firms, portfolio management companies, and non-deposit banks.
The content of this page reflects only personal opinions.
These views may not be suitable for your financial situation or your risk and return preferences. Therefore, investment decisions should not be made based solely on the information and content on this page.
We’d appreciate it if you could follow and like us so you don’t miss our analyses with positive or risky technical indicators.

MUBARAKUSDT Hourly Technical AnalysisMUBARAKUSDT Hourly Technical Analysis
Mubarak Coin is currently in a recovery phase after being affected by Bitcoin’s decline. After forming support at 0.1288, it has reached the 0.1381 resistance level. At this level, it appears very close to the 21-day moving average. If it manages to stay above this average, the 0.1527 resistance level can be monitored. Indicators are currently in a positive state.
This meme coin is supported by CZ. It is currently being voted on for listing on the Binance exchange. While supporting this meme coin, CZ has been seen posting on his social media accounts wearing the traditional Arab attire featured in the coin’s symbol. In short, since there is a possibility that the MUBARAK coin may be listed on Binance in the future, the likelihood of positive price movements is high.
NOT FINANCIAL ADVICE
The information, comments, and recommendations provided here do not constitute investment advice. Investment advisory services are provided within the framework of an investment advisory agreement signed between clients and brokerage firms, portfolio management companies, or banks that do not accept deposits. The statements on this page reflect only personal opinions. These opinions may not be suitable for your financial situation, risk tolerance, or investment preferences. Therefore, no investment decisions should be made based on the information and statements on this page.
To avoid missing our analyses on positive or risky technical indicators, follow and like us—we would appreciate your support!

Breaking: $ONDO Tanks 13% Today- What Next? Standing as a beacon in the realm of decentralized finance Ondo (ONDO) aiming to democratize access to institutional-grade financial services. Founded in 2022 and based in the Cayman Islands, Ondo operates through a unique ecosystem that bridges traditional finance with blockchain technology. The Ondo Foundation collaborates closely with Ondo Finance, its commercial partner, to support decentralized protocols and the tokenization of real-world assets.
Earlier today, the native token CRYPTOCAP:ONDO tanked 13% placing the coin on the cusp of a selling spree. However, CRYPTOCAP:ONDO faded a breakdown in the $0.866 pivot- a pivot that turned out to be the support point. If Selling pressure should increase, a break below the $0.866 point for CRYPTOCAP:ONDO would pose a serious threat for CRYPTOCAP:ONDO as the RSI is already weak at 41.82.
As indicated by the chart, a break above the $1.27 pivot could send CRYPTOCAP:ONDO on a bullish voyage with a breakout above the 1-month high as confirmation.
Ondo Price Live Data
The live Ondo price today is $0.973556 USD with a 24-hour trading volume of $462,035,194 USD. Ondo is down 13.67% in the last 24 hours, with a live market cap of $3,075,569,399 USD. It has a circulating supply of 3,159,107,529 ONDO coins and the max. supply is not available.

That's the Way the Bitcoin TumblesWhy I Think the Sell-Off Isn’t Over Yet
Bitcoin is already in the middle of a sharp sell-off, but at least half the market seems convinced the worst is over and that a recovery is underway. I don’t see it that way. Bitcoin has been grinding sideways into the Bollinger Bands on the weekly chart, and now that it’s finally colliding with the basis lines, I think it’s about to plunge straight through them. This doesn’t look like a market that’s ready to bounce—it looks like one that’s about to take another leg down. Maybe I’m wrong, maybe I’m early, but in my experience, when people start celebrating too soon, things tend to get a whole lot worse.
CRYPTO:BTCUSD
CRYPTOCAP:BTC
CME:MBT1!
CME:BTC1!
CRYPTO:MOBILEUSD
COINBASE:RNDRUSD
CRYPTO:SHPINGUSD
CRYPTO:FXUSD
CRYPTO:ALEOUSD
CRYPTO:HONEYUSD
COINBASE:ACSUSD
CRYPTO:ASMUSD
CRYPTO:BATUSD
CRYPTO:FILUSD
CRYPTO:VTHOUSD
CRYPTO:B3USD
As always, this is not investment advice, any trade you make is on you, because good golly Miss Molly, I got my own things to worry about.

SOL The big rotation beginsRug pulls... Allegations against creators and influencers creating meme coins powered by Solana... Developers abandoning a project after pocketing investor funds... The monthly transaction fees spend on SOL are at an all-time high... The rise of dissatisfaction of participants looking for quick profits in the Solana casino won't stop...
All this overrides every fundamental partnership and achievement of the whole blockchain ecosystem and leaves a sour taste in the crypto community's mouth.
More and more people seeking out for longevity: roadmaps, partnerships and active development, and especially third-party code audits regarding red flags in meme coin projects.
Big investors and institutions took profit at the double-top and swapped to other blue-chip coins like ETH or BNB which on-chain activity has just risen steadily over the last weeks while becoming the more safer bets for the upcoming bullrun.
This dump of SOL is just the beginning of what is to come and it just depends on how fast it's gonna come down.

STRUMP - Could it present an incredible buying opportunity?Super Trump looks like more lower lows are ahead. Simplicity is key here. Don't worry about 100 different signals. Look at the core signals that work best for you. Mine are very simple and I know how to make them work and 'jive' together. Volume is bleak, all red. Blue trend line breach is unlikely. Hurst (time) cycles says that we're 1/2 way through a cycle which infers more down. The signals that would give me the highest confidence of a reversal are a few green bars on the volume, a blue trend line decisive break-out and a few more exchanges on-boarding this eclectic meme coin. I wouldn't bother, stay away. Follow and share for more.

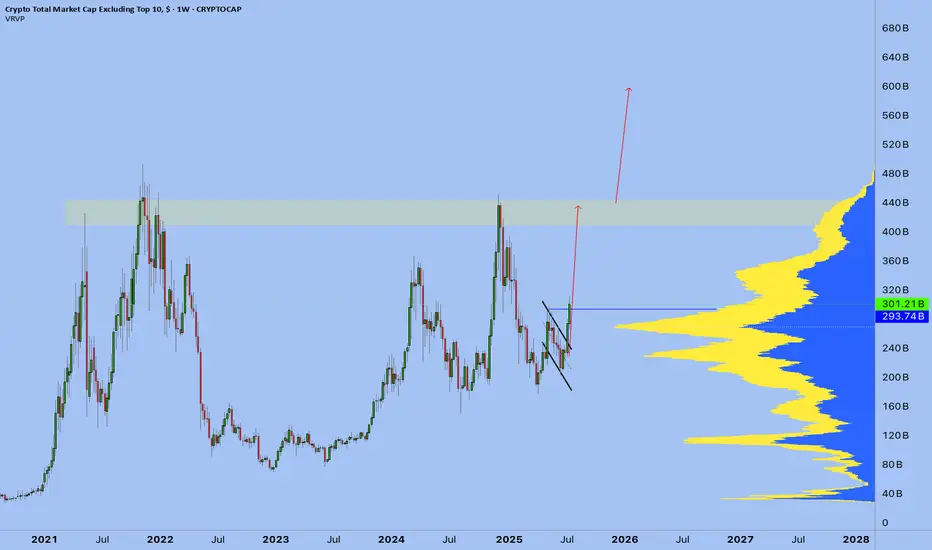
Altcoins: What Comes Up Must Go Down?Giant Flat Correction could be built on the altcoins chart (less Ethereum)
Indicators:
-Collapse in three waves in 2021-2022 (wave A)
-Retest of 2021 peak in three waves in 2023-2024 (wave B)
-wave B retested the start of wave A and failed to grasp the bullish ground beyond
-first move down and small correction that keeps below all-time high could be the harbinger of new five waves down in wave C
Large wave C should at least retest the valley of wave A at 288b cap
What could be the reason?
-Altcoins could lose its shine as institutions prefer only BTC
-Some huge risk aversion in global economy
You are welcome to share your views in the comments below to enrich our outlook.

Chiliz - The Best Sports Crypto Im going to be breaking-down what I feel are the best long-term holds in each sector/category of crypto. This is the Sports/Entertainment category. I will tell you the pros and cons of each project.
Chiliz
When looking at the chart we can see that Chiliz has been moving in a downward trend for quite some time. On the weekly chart we can see the CHZ has formed a strong bullish divergence. The sports narrative has not yet picked up any steam but once it does, you can bet that CHZ will lead the pack.
Pros of Chiliz (CHZ)
Fan Tokens: Through partnerships with sports teams, especially in football (soccer), Chiliz allows fans to own tokens that can be used for things like voting in polls, receiving merchandise, or influencing minor team decisions, increasing fan loyalty and engagement.
Real-World Use Cases:
Partnerships with Major Sports Organizations: Chiliz has forged partnerships with prominent sports teams, such as FC Barcelona, Juventus, Paris Saint-Germain (PSG), and many others, integrating the platform into the fan experience in meaningful ways.
Socios.com: Chiliz powers Socios.com, a leading platform that lets fans buy and trade tokens from sports clubs. This ecosystem enhances the use of CHZ and contributes to the growing adoption of the project.
Expanding Ecosystem: The project has continued to expand its roster of partnerships with sports leagues, which helps it grow both in the number of users and in the diversity of tokens it offers.
Cons of Chiliz (CHZ)
Niche Focus: Chiliz’s focus on sports and entertainment means its success is tied to these industries. If fan engagement in sports decreases or the tokenization model doesn't take off as expected, it could significantly affect CHZ’s value and relevance.
Legal and Regulatory Risk: Like other cryptocurrencies, Chiliz faces regulatory uncertainty. Countries and jurisdictions are still figuring out how to regulate fan tokens, NFTs, and cryptocurrencies, which could affect Chiliz’s operations and its partnerships with sports teams.
Potential for Regulatory Crackdown: If the legal landscape becomes stricter, there could be negative consequences for Chiliz and other crypto projects in the sports and entertainment space.
All in all, this is not financial advice and instead just my opinion. Thanks for viewing my post and make sure to check out my other ideas!

Bitcoin Analysis Until April 2025Hi Bitcoiners ,
Based on previous analysis, Bitcoin continued to move in the ascending channel and reached the midline of the channel. After a short break, the move from the middle of the channel to the channel ceiling will begin quickly.

