XAUUSD 1H – Bullish Continuation with Mapped TargetsGold (XAUUSD) is trading in a strong bullish structure on the 1H timeframe, characterized by consistent higher highs and higher lows. Price is currently consolidating near recent highs, indicating healthy price action and potential continuation rather than reversal.
This chart highlights:
A clear buy-on-dip zone aligned with previous demand
A well-defined invalidation level to manage risk
Multiple upside targets based on market expansion and liquidity zones
As long as price holds above the key structure support, the bullish bias remains valid. Breakout or pullback confirmations from the marked zone may offer continuation opportunities in the direction of the trend.
⚠️ A strong close below the invalidation level would signal a possible shift into correction or consolidation.
🔑 Key Concepts Used
Market Structure (HH / HL)
Demand & Resistance Zones
Trend Continuation Logic
Risk-to-Reward Target Mapping
Commodities

Bearish Reversal Setup on XAU/USD (SMC Analysis)The chart depicts a potential short (sell) setup after a significant bullish run. The price is currently trading near all-time highs (marked around $5,091 in this simulation/chart) and is showing signs of exhaustion at a structural resistance level.
Key Technical Elements:
• Trend Context: The price has been moving within an ascending channel (the blue diagonal lines). It recently hit a "Weak Swing High," suggesting the upward momentum may be fading.
• Market Structure: * BOS (Break of Structure): Multiple bullish breaks are visible on the way up.
• CHoCH (Change of Character): Several internal shifts in trend are highlighted in orange, indicating local volatility.
• Supply & Demand Zones: * The red box at the top represents a Supply Zone or a bearish Order Block where the "Smart Money" is expected to enter sell positions.
• The green shaded area below represents the Target/Take Profit zone, aiming for a return to previous support levels around $4,975 - $5,000.
• FVG (Fair Value Gaps): The yellow highlighted areas and text labels indicate gaps in price action that the market often returns to "fill" or rebalance.
• Projected Path: The large pink arrow and the black zig-zag lines predict a breakdown from the current consolidation, moving toward the "Strong Swing Low" identified near the $4,900 handle.

GOLD BEARS WILL DOMINATE THE MARKET|SHORT
GOLD SIGNAL
Trade Direction: short
Entry Level: 5,090.81
Target Level: 5,003.11
Stop Loss: 5,148.67
RISK PROFILE
Risk level: medium
Suggested risk: 1%
Timeframe: 1h
Disclosure: I am part of Trade Nation's Influencer program and receive a monthly fee for using their TradingView charts in my analysis.
✅LIKE AND COMMENT MY IDEAS✅

RIOT Short-term analysis | Trading and expectationsNASDAQ:RIOT
🎯 Price completed wave II of 3, reclaiming the daily 200EMA and pivot. The next challenge is to overcome the High Volume Node resistance. The uptrend is strong.
📈 Daily RSI hit oversold with bullish divergence and has room to grow.
👉 Continued downside has a target of the High Volume Node, $10
Volatility analysis | Expected range & extremities
🎯RIOT is behaving as expected in the usual range, sitting above fv, moving along its steady growth path.
👉Fair value is ~$15
safe trading

IREN Short-term analysis | Trading and expectationsNASDAQ:IREN
🎯 Iren wave 4 hit the daily 200EMA, just above 0.382 Fibonacci retracement. Price is at High Volume Node resistance, but above the daily pivot and 200EMA, showing the uptrend is intact. Continued downside has a target of the daily 200EMA, $26.75
📈 Daily RSI has not reached oversold
👉 Analysis is invalidated only at all time high, for now
Volatility analysis | Expected range & extremities
🎯IREN came back down to it’s expected range and jumped back into the SD+2 overbought zone. The incline is steep, reflecting its strong growth, giving strong down days also. Price is above fv
👉Fair value is ~$35
Safe trading

HUT Short-term analysis | Trading and expectationsNASDAQ:HUT
🎯 Price jumped back up following my path. Wave 4 of V was indeed complete at the 0.382 Fibonacci retracement and High Volume Node just above the daily 200EMA. The daily R1 pivot has been claimed. The uptrend is well intact.
📈 Daily RSI is showing bearish divergence as price falters
👉 Analysis is invalidated if we close below wave 4, $30
Volatility analysis | Expected range & extremities
🎯 Hut is in the SD+2 overheated zone, where it is expected to spend <5% of the time. Price has a tendency to rally above the SD+3 threshold before being rejected, characteristic of low-cap assets. Price is well above fv, traders should be cautious
👉Fair value is ~$20
Safe trading

CLSK Short-term analysis | Trading and expectationsNASDAQ:CLSK
🎯 Price is back at the daily 200EMA and above the pivot, below major resistance after finding support at the orange trend line and golden pocket. The direction is ambiguous, but I am leaning to further upside this week
📈 Daily RSI sits at the EW, flipped bullish but with no divergence.
👉 Analysis is invalidated if price falls below wave (2) at $9
Safe trading

CIFR Short-term analysis | Trading and expectationsNASDAQ:CIFR
🎯 The triangle has flipped to a bearish-looking triangle. This is a penultimate pattern, we can expect price to thrust lower, test the daily 200EMA, end the correction and then makes its way to new highs. l pattern Wave d of the triangle may still be underway, wave e is expected to end at the daily pivot where price currently sits, above the daily 200EMA, showing the uptrend is still intact but flattening.
📈 Daily RSI is neutral, reflecting triangle dynamics
👉 Analysis is invalidated if price falls below wave b or above wave a.
Safe trading

BTDR Short-term analysis | Trading and expectationsNASDAQ:BTDR
🎯 Price overcame the daily 200EMA, major High Volume Node and Pivot, showing a strong bullish trend is in play. It has pulled back to test the 200EMA and support node, normal behaviour. Wave C looks underway toward the $25 target.
📈 Daily RSI printed bullish divergence.
👉 Analysis is invalidated if price falls below wave (B), 9.50, and the structure will start to look bearish.
Safe trading

Silver at $110 in Fierce Rally, Gold Tops $5,100. What’s Behind?(What a chart.)
Silver OANDA:XAGUSD is on a tear. Actually, scratch that — silver is on a mission. Prices have surged more than 250% over the past year, including a blistering 50% jump in January alone, lifting the metal to around $109 an ounce and placing the $110 level firmly in sight .
That performance puts silver ahead of nearly every major commodity and even ahead of gold, the traditional anchor of the precious-metals complex. Momentum has been relentless, headlines have grown louder, and price action has moved from steady to explosive.
When markets accelerate this quickly, attention follows. So does risk.
🪙 Gold Climbs with Purpose
Gold OANDA:XAUUSD has also started 2026 in strong form, trading above $5,100 an ounce for the first time in history. The move builds on a powerful rally that delivered a 60% gain in 2025, driven by familiar macro forces that continue to shape investor behavior.
Compared with silver’s all-over-the-place sprint, gold’s climb looks measured and deliberate. That difference highlights the contrasting roles the two metals play in portfolios. Gold behaves like a heavyweight asset, absorbing large flows with relative calm. Silver responds more sharply to changes in sentiment and positioning.
⚙️ Silver’s Fundamental Case Gains Strength
Silver’s story extends beyond safe-haven demand. Industrial use now forms the backbone of the market. As one of the most efficient conductors of electricity, silver plays a central role in electronics, solar panels, circuit boards, and energy infrastructure.
According to Metals Focus, industrial demand now accounts for around 60% of total silver consumption, up significantly from a decade ago. That shift has aligned silver with long-term trends in electrification and renewable energy investment.
Supply dynamics add further pressure. Roughly three-quarters of new silver supply comes as a byproduct of mining other metals such as copper and zinc. Production responds slowly to price signals, and demand has exceeded supply every year since 2018. Last year’s deficit reached nearly 20%, with another shortfall expected in 2026.
📈 Speculation Takes the Wheel
But also, price behavior suggests fundamentals alone no longer explain silver’s trajectory. Speculative positioning has become a dominant force.
The silver market carries a total value of roughly $5.3 trillion, far smaller than gold’s $33 trillion footprint. That size difference amplifies volatility and accelerates moves when capital flows surge.
Intraday swings have grown aggressive. Moves of several dollars within minutes have become common, shifting hundreds of billions of dollars in market value in short bursts. Traders accustomed to slower commodity cycles have found themselves navigating price action that resembles high-beta equities.
🌍 Politics Add Energy to the Trade
Geopolitical tension is adding support for another leg up. President Donald Trump’s renewed trade and military rhetoric toward Europe, including commentary around Greenland , has reinforced demand for real assets.
At the same time, the administration clarified that tariffs on silver and other critical minerals remain off the table. That clarification did little to slow momentum, raising questions about how much of the rally rests on positioning rather than policy.
🥇 Gold’s Rally Follows Familiar Lines
On the other hand, gold’s advance reflects a broader macro backdrop. Elevated inflation, a weaker US dollar , and continued central-bank buying have supported demand.
Expectations for further Federal Reserve rate cuts in 2026 strengthen the case, as lower yields reduce the appeal of fixed-income alternatives. (Make sure you watch the economic calendar to catch any surprise announcements.)
Gold also benefits from deep scarcity. According to the World Gold Council, total gold mined throughout history amounts to approximately 216,265 tons, enough to fill just about four Olympic-size swimming pools.
The US Geological Survey estimates another 64,000 tons remain underground, though production growth is expected to level off as accessible deposits diminish. That constraint continues to anchor gold’s role as a long-term store of value.
⚖️ Valuation Questions Surface
Debate has shifted toward valuation. Very few analysts expect silver to revisit the $20-to-$30 range last seen in late 2022. Structural demand and supply dynamics suggest a higher baseline.
Prices above $100, however, place silver in rare territory where momentum and leverage exert significant influence. In such environments, price discovery becomes less orderly and reactions grow sharper.
🎁 The Takeaway
Silver and gold are rising for different reasons and behaving in distinct ways. But one thing unites them. Right now, it’s more about speculation than anything else.
Off to you : Are you sleeping on the rally or you’ve bet on either of these metals? Share your approach in the comments!

GOLD (XAUUSD): Important Support & Resistance Analysis
Here is my updated structure analysis for Gold.
Resistance 1: 5096 - 5112 area
Resistance 2: 5196 - 5212 area
Resistance 3: 5296 - 5312 area
Support 1: 4988 - 5010 area
Support 2: 4758 - 4773 area
Support 3: 4629 - 4644 area
Support 4: 4536 - 4550 area
Consider these structures for pullback/breakout trading.
❤️Please, support my work with like, thank you!❤️
I am part of Trade Nation's Influencer program and receive a monthly fee for using their TradingView charts in my analysis.

XAUUSD Long: Bullish Trend Intact Below the $5,000 Supply ZoneHello traders! Here’s a clear technical breakdown of XAUUSD (1H) based on the current chart structure. Gold is trading within a well-defined bullish trend, supported by a clean ascending channel that has guided price higher from the lower levels. Earlier in the move, XAUUSD respected the lower boundary of the channel and formed a sequence of higher highs and higher lows, confirming sustained buyer control. During this advance, price entered a consolidation range, signaling temporary balance and accumulation before continuation. This range eventually resolved to the upside, triggering a strong impulsive breakout and accelerating bullish momentum. After the breakout, Gold pushed higher within the ascending channel and approached a major Supply Zone near the psychological 5,000 level. At this area, price showed hesitation and formed a fake breakout above resistance, indicating that sellers were active near the highs. Following this rejection, XAUUSD pulled back toward the mid-lower area of the channel, where previous resistance has now turned into a Demand Zone around 4,870. This zone aligns with channel support and a key structural level, making it an important area for buyer reaction. The recent dip into demand appears corrective rather than impulsive, suggesting a pause within the broader uptrend.
Currently, XAUUSD is trading above the demand zone and remains inside the ascending channel, with buyers defending structure. The market is compressing after the pullback, which often precedes continuation in trending conditions.
My scenario: as long as Gold holds above the 4,870 demand zone and continues to respect the ascending channel, the bullish bias remains intact. A renewed push higher could lead to another test of the 5,000 Supply Zone (TP1). A clean breakout and acceptance above this level would confirm trend continuation and open the door for further upside expansion. However, failure to hold demand and a breakdown below channel support would weaken the bullish setup and signal a deeper corrective phase. For now, structure and momentum continue to favor buyers. Manage your risk!

GBPJPY: targets at 214 and 216🛠 Technical Analysis: On the H4 chart, GBPJPY remains in a clear ascending channel, keeping the broader bullish structure intact. Price is currently in a pullback toward the 211.8–210.9 support area, where buyers previously defended momentum. The SMA cluster (50/100) is nearby and can act as a pivot—holding above support favors a continuation push. A sustained rebound from this zone opens the path back toward the 214.25 resistance, with the channel top as a potential extension.
———————————————
❗️ Trade Parameters (BUY)
———————————————
➡️ Entry Point: 212.238
🎯 Take Profit: 214.249
🔴 Stop Loss: 210.874
⚠️ Disclaimer: This is a potential trade idea based on current analysis; market conditions and price direction are subject to change based on news factors and volatility.

XAUUSD NEW ATH: Trend Continuation & Expansion ScenarioGold continues to trade in a strong impulsive bullish structure, with price firmly holding above prior breakout levels and pressing into new all-time highs. The most important detail on this chart is not the ATH itself, but the clean demand + imbalance (GAP) zone around 4,980–5,010, which formed after aggressive upside expansion. This confirms institutional participation and suggests the market is still in a markup phase, not distribution.
Structurally, each pullback during this rally has been shallow, corrective, and immediately bought, with no acceptance below prior demand. The projected path is logical: a controlled retracement into the demand/GAP zone to rebalance liquidity, followed by continuation. As long as price holds above this zone, the bullish bias remains intact. The dotted projection reflects a typical expansion cycle: pullback → higher low → breakout → extension.
If demand holds, the next upside objective aligns around $5,180–5,220, which is a measured expansion beyond ATH and consistent with momentum continuation rather than exhaustion. A deeper pullback would only become concerning if price accepts below the GAP and loses demand, which would signal a temporary pause or broader consolidation. Until then, this remains a trend-following environment where pullbacks are opportunities, not reversal signals.

This Gold pullback is structure-driven, not distributionGold is currently in a clear impulsive bullish cycle, and the structure on this chart aligns cleanly with an Elliott Wave 5-wave advance. The rally from the support premium zone marks Wave (1), followed by a shallow corrective Wave (2) that respected structure and held above demand. The strong vertical expansion into new highs represents Wave (3) the strongest and most impulsive leg, confirmed by strong candle bodies and minimal overlap. The pullback labeled (4) is corrective in nature, overlapping but not violating Wave (1) territory, which keeps the impulsive count valid. Price is now pushing into Wave (5), targeting a new ATH around 5,140–5,160, where momentum typically starts to diverge and upside extension becomes more fragile.
From a cycle perspective, once Wave (5) completes, the market is statistically likely to enter an ABC corrective phase, which is exactly what your projection reflects. Wave (A) would be a sharp pullback from ATH, followed by a Wave (B) relief rally that fails below the high, and then Wave (C) completing into the 5,000–4,980 support zone, which aligns perfectly with prior structure support and liquidity. This confluence between Elliott Wave theory, horizontal structure, and support zones significantly strengthens the scenario. As long as price remains above the support zone during the corrective phase, the broader trend remains bullish, and the correction should be viewed as re-accumulation rather than reversal.

GOLD is in “blue-sky” mode… but the next move will be decided Price just ripped higher and is now pausing near ~5,09x — the kind of compression that looks like it wants to launch again. Your projection to ~5,203 is plausible, but it’s not “provable.” The market still has to confirm the continuation by defending the GAP / reclaim zone.
GAP support zone ≈ 4,990–5,000
This is the “line in the sand.”
If price revisits this band and reclaims / holds, the uptrend structure stays intact and the breakout thesis remains valid.
If price loses this band with acceptance, the chart flips from “continuation” to “pullback / fill” mode.
Trade Plan
✅ Scenario A — Bull continuation (only with confirmation)
Trigger: Price pulls back into the GAP zone (~4,990–5,000) and prints a clear hold (strong bounce / reclaim close).
Entry idea: Buy the reclaim (or the first higher low after the reclaim).
Targets:
T1: prior high area (~5,09x)
T2: ~5,203 (your “NEW TARGET” zone)
Invalidation: Clean breakdown and acceptance below the GAP zone.
⚠️ Scenario B — GAP fails
Trigger: Breakdown below ~4,990 + weak retest (can’t reclaim).
Targets below (step-by-step magnets):
4,917
4,880
4,838
4,775
Execution note: don’t over-hold shorts into support take partials at each shelf.
Macro context
Gold can keep trending if the market keeps pricing:
softer real yields / rate-cut expectations,
USD weakness (or even just USD instability),
geopolitical headline risk (spikes + re-pricing),
persistent safe-haven allocation.
But none of that guarantees this path. Price confirmation at the GAP is the proof.
Bottom line
bullish path is credible but the market must validate it.
If the GAP holds → we trade continuation. If the GAP breaks → we trade the fill.

TODAY'S LIMITED STRATEGY JAN 261.Current Market Context
Gold remains in a strong bullish structure on the H1 timeframe, respecting the rising trendline and staying above key EMA (34/89/200) support.
Price has broken above the previous resistance zone (4989–4999) with momentum and is now trading at extended levels.
The market is approaching a high-risk zone, where continuation is possible, but short-term pullbacks are also likely.
2.Key Technical Observations
Strong impulse leg just completed → price is temporarily stretched from the mean.
Stochastic remains in overbought territory, signaling potential short-term correction or consolidation.
Structure still bullish: higher highs & higher lows remain intact as long as price holds above the trendline and dynamic EMAs.
3.Scenarios for Today
Primary Scenario (Bullish Continuation):
If price holds above the broken resistance (4989–4999) and forms a healthy pullback with confirmation, gold can continue its markup toward the next upside target around 5146.
Secondary Scenario (Corrective Pullback):
Failure to hold above the breakout zone may trigger a technical retracement back toward the trendline / EMA support area to rebalance momentum before the next move.
📌 Trading Strategy
Avoid FOMO buying at extended highs.
Preferred BUY setup:
Wait for a pullback into the broken resistance zone (now support) or trendline, then enter only with clear confirmation (price action / momentum reset).
Risk management is critical — market is strong but sensitive at current levels.
Short-term sells are counter-trend only, suitable for scalping with strict stops.
Summary
The broader trend remains bullish and healthy, but price is currently in an extension phase. Today’s focus should be patience and precision—let the market come to your levels. Trade with structure, not emotion.
Trend first. Confirmation always. Discipline above all.

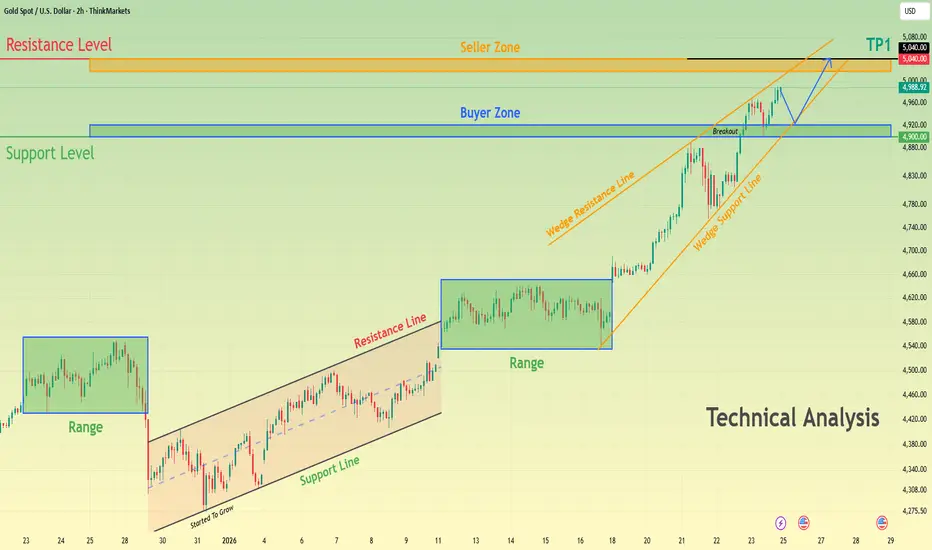
XAUUSD Bullish Structure Intact - $5,040 AheadHello traders! Here’s my technical outlook on XAUUSD (2H) based on the current chart structure. Gold continues to trade within a broader bullish context, maintaining a sequence of higher highs and higher lows. Earlier in the move, price spent a significant amount of time consolidating inside multiple range structures, indicating accumulation before continuation. After breaking out of the most recent range, XAUUSD accelerated higher and respected a rising trend structure, confirming sustained buyer control. This bullish impulse transitioned into a rising wedge formation, where price continued to climb while compressing between the wedge support and resistance lines. During this phase, pullbacks remained corrective, and buyers consistently defended higher support levels. Recently, Gold broke above the key Buyer Zone around the 4,900 level, confirming a successful breakout and acceptance above previous structure. This level has now flipped into support and aligns with the broader Support Level marked on the chart. Price is currently consolidating above this zone while respecting the wedge support line, suggesting continuation rather than exhaustion. Above the market, a well-defined Seller Zone and Resistance Level near 5,040–5,050 stands as the next major obstacle, where profit-taking or selling pressure may emerge. My scenario: as long as XAUUSD holds above the 4,900 Buyer Zone and continues to respect the rising wedge support, the bullish bias remains intact. I expect buyers to maintain control and attempt a continuation toward the 5,040 resistance area (TP1). A clean breakout and acceptance above this Seller Zone would confirm further upside continuation and open the door to new highs. However, a clear rejection from resistance could lead to a short-term pullback toward the Buyer Zone before the next directional move. A decisive breakdown below support would weaken the bullish structure and signal a deeper corrective phase. For now, market structure and momentum continue to favor buyers. Please share this idea with your friends and click Boost 🚀
XAU/USD 15M Price Structure and Key Reaction ZonesThis chart shows the short-term price structure of XAU/USD on the 15-minute timeframe. Price has moved upward from a previous support area and is currently reacting near a highlighted zone. The marked regions represent areas of past market activity where price previously consolidated or reacted. Future movement may depend on how price behaves around these levels. This analysis is based purely on technical chart observation.

Gold 10 yearsOne photo win thousand word.
Dollar collapse is inevitable.
The matter is, How long can it hold?

Gold Vs Bitcoin- I don’t publish much these days and right now, it’s very difficult to analyze Bitcoin in isolation.
- The market is currently heavily focused on metals, and retail investors usually rush into whatever is already pumping, which is precisely what you want to avoid.
- This chart is not a prediction, but it can help identify good entry zones to accumulate more BTC. What we need is confirmation. Gold has formed a double top breakout and moved above $5,000. From here, regardless of whether gold continues higher, the key is to wait for a bearish divergence and then rotate.
- When Bitcoin begins its next leg up, Gold.D should start to roll over. Until then, and until clear signals appear, the safest approach is to stay on the sidelines.
Sometimes, the best trade is not to trade at all, just wait patiently for the right opportunity.
Happy Tr4Ding !

Middle East Risks Keep Brent Oil Bullish — Higher TargetsAs I expected in the previous idea , Brent Crude OIL( BLACKBULL:BRENT ) has risen and reached its targets, with a Risk-To-Reward: 2:01 (full target).
Brent Crude OIL is currently trading near the support zone($63.30-$62.00) and the support lines.
From an Elliott Wave perspective, it appears that Brent Crude OIL has completed main wave 4, and we can now expect the next impulsive wave for the main wave 5.
Additionally, news from the Middle East does not indicate a reduction in tensions, and we can expect potential surprises in the region. Therefore, I prefer to maintain long positions in Brent Crude OIL rather than short positions, and I’m looking for triggers to enter long.
I expect that Brent Crude OIL will once again target the resistance zone($66.80-$65.00) and potentially rise to around $66.47. The next target could be the yearly pivot point($67.30).
First Target: $66.47
Second Target: $67.30
Stop Loss(SL): $62.60
Points may shift as the market evolves
💡 Please respect each other's opinions and express agreement or disagreement politely.
📌U.S. Dollar/Brent Crude OIL Analysis (USDCAD), 4-hour time frame.
🛑 Always set a Stop Loss(SL) for every position you open.
✅ This is just my idea; I’d love to see your thoughts too!
🔥 If you find it helpful, please BOOST this post and share it with your friends.

Brent Oil M30 HTF Discount Reaction and Bullish Continuation📝 Description
BLACKBULL:BRENT crude oil has completed a corrective pullback after a strong impulsive rally and is now stabilizing above a key short-term demand zone. Price has reacted cleanly from the SSL and lower boundary of the recent range, suggesting buyers are defending this area and preparing for another leg higher toward premium liquidity.
________________________________________
📈 Signal / Analysis
Primary Bias: Bullish while price holds above the recent swing low and SSL
Preferred Setup:
• Entry: 65.015
• Stop Loss: Below 64.730
• TP1: 65.25
• TP2: 65.45
• TP3: 65.73
________________________________________
🎯 ICT & SMC Notes
• Sell-side liquidity sweep followed by bullish displacement
• Reaction from intraday support and SSL confirms demand
• No bearish break of structure after the pullback
• Upside targets aligned with prior highs and premium liquidity
________________________________________
🧩 Summary
As long as BLACKBULL:BRENT holds above the 64.75–64.90 support zone, the bullish continuation scenario remains favored. The current pullback appears corrective, with expectations of a rotation higher toward recent highs and upper liquidity pools.
________________________________________
🌍 Fundamental Notes / Sentiment
Oil sentiment remains constructive amid steady demand expectations and the absence of strong bearish catalysts. Short-term pullbacks into defended demand zones are likely to be viewed as buying opportunities rather than trend reversals.
________________________________________
⚠️ Risk Disclosure
Trading involves substantial risk and may result in capital loss. This analysis is for educational purposes only and does not constitute financial advice. Always apply proper risk management, predefined stop-loss levels, and disciplined position sizing aligned with your trading plan.
