XAUUSD made new ATH! Time to short it?Gold (XAUUSD) made new All Time Highs (ATH) today, rising consistently within a Channel Up pattern since the November 18 Low.
On the short-term, a Sell Signal has emerged as not only is the price near the top (Higher Highs trend-line) of the pattern, but also the 1H RSI hit the 83.00 Resistance. The latter has been the point where the price topped on the previous two Higher Highs and pulled-back by -2.30% both times.
As a result, we expect the Channel Up to initiate a similar Bearish Leg, targeting 4330 (-2.30%).
---
** Please LIKE 👍, FOLLOW ✅, SHARE 🙌 and COMMENT ✍ if you enjoy this idea! Also share your ideas and charts in the comments section below! This is best way to keep it relevant, support us, keep the content here free and allow the idea to reach as many people as possible. **
---
💸💸💸💸💸💸
👇 👇 👇 👇 👇 👇
Commodities

GOLD BEARS ARE STRONG HERE|SHORT
GOLD SIGNAL
Trade Direction: short
Entry Level: 4,422.84
Target Level: 4,368.45
Stop Loss: 4,459.03
RISK PROFILE
Risk level: medium
Suggested risk: 1%
Timeframe: 1h
Disclosure: I am part of Trade Nation's Influencer program and receive a monthly fee for using their TradingView charts in my analysis.
✅LIKE AND COMMENT MY IDEAS✅

XAUUSD: Market Analysis and Strategy for December 22nd.Gold prices rose steadily after the market opened today, driven by safe-haven demand over the weekend, demonstrating its strength and reinforcing short-term bullish expectations. The technical structure is bullish, with MACD/KDJ indicators showing ample upward momentum. The price is supported by the MA5 moving average, with pullback lows gradually moving higher. The price is currently within an upward Bollinger Band channel. Daily support levels to watch are 4406/4400. Avoid speculating on the highest point of the rise.
On the 1-hour chart, after a strong upward move, the 4400 level is a key level for short-term correction. With the Bollinger Bands trending upwards and the price breaking through the recent high consolidation range, the trend is likely to continue. However, be aware of the risk of a pullback. For short-term trading, wait for a pullback and the formation of a bottoming pattern before entering.
Trading Strategy:
BUY: 4406~4400
If it breaks below 4395, buy plan ↓
BUY: 4375near
BUY: 4365near
More Analysis →

Weekly Outlook: XAUUSD, #SP500, #BRENT | 26 December 2025XAUUSD: BUY 4397.16, SL 4387.16, TP 4427.16
Gold starts the week near record highs: as of December 22, XAUUSD is hovering around 4397.16. Support comes from expectations of lower U.S. interest rates in 2026 and safe-haven demand amid geopolitical uncertainty and a softer U.S. dollar.
This week, interest in gold may strengthen if U.S. data on growth and inflation come in softer, and if headlines point to continued central-bank buying. On the other hand, year-end profit-taking and thin holiday liquidity may limit the upside.
Trading recommendation: BUY 4397.16, SL 4387.16, TP 4427.16
#SP500: BUY 6835, SL 6815, TP 6895
#SP500 enters the week near 6835 points as investors reassess the Fed’s 2026 rate path and aim for a calm year-end finish. Sentiment is also supported by renewed demand for large-cap stocks, which carry the biggest weight in the index.
With a shortened week, market reactions to U.S. releases can be sharper—especially GDP updates, corporate orders, and consumer confidence. Strong figures would support revenue expectations, while softer data could reinforce bets on policy easing, which often also supports equities.
Trading recommendation: BUY 6835, SL 6815, TP 6895
#BRENT: SELL 60.93, SL 61.43, TP 59.43
#BRENT starts the week around 60.93 per barrel. In the short term, supply-risk headlines may provide support, but the market is still focused on the possibility of oversupply in 2026 and rising output from producers outside coordinated agreements.
Pressure may increase if new assessments confirm softer demand and elevated inventories. At the same time, any fresh geopolitical developments can trigger sharp but brief spikes, so the key driver remains the broader supply-demand balance.
Trading recommendation: SELL 60.93, SL 61.43, TP 59.43

XAU/USD | Gold Breaks Above $4400 and Prints a New ATH!By analyzing the #Gold chart on the 4H timeframe, we can see that after the analysis we posted on Thursday, price first had a small correction and then resumed its move higher. With the market reopening today, gold showed strong momentum and finally broke above $4400, printing a new all-time high. Price reached as high as $4420, then pulled back slightly and is now trading around $4409.
This strong rally has created a liquidity gap, which I expect to be filled in the short term. Before that happens, we may first see another push higher toward the $4440 to $4444 area. After this potential final push, a corrective move is likely. The downside targets I am watching are $4389, $4374, $4358, and the $4335 to $4350 zone. Make sure to closely monitor price reaction around these levels. This analysis will be updated, and total performance so far is already over 1300 pips.
Please support me with your likes and comments to motivate me to share more analysis with you and share your opinion about the possible trend of this chart with me !
Best Regards , Arman Shaban

West Texas Oil (WTI)Those who follow my work know that we have shorted oil multiple times and successfully built profits.
In my previous post, I clearly mentioned the final short target, and price reached it perfectly.
🔁 Now the situation has changed, and I see a buying opportunity on the
chart.
We are traders —
we build profits from opportunities, not from bias.
I entered a long position at lower levels, and in my view, this area still offers a valid buying opportunity.
As I always say:
I’m not a political analyst, not an oil analyst, and not an OPEC member.
I’m simply a trader who follows a clear rule:
Price reaches my level and gives a signal → I buy
The level breaks and gives the opposite signal → I sell
📉📈 I don’t care whether the market goes up or down.
There is no bias here.
An opportunity is identified, execution is done,
and the rest is up to the market.
❗️Never try to stand in front of the market
and tell it where it should go because of a trendline
or an indicator.
The market moves ruthlessly in its own direction —
and if you fight it, you’ll only be left watching.
🎯 Real trading skill is finding a way to move with the market,
even when it doesn’t agree with you.
🌹 Stay safe & stay profitable

USOIL short setupcontinue bearish trend
reversal expected from major fibs level
wait for reversal pattern or trend reversal at 1 hour time frame
RRR > 1:3

XAUUSD Short: Supply Zone Holds - Gold Slips Into CorrectionHello traders! Here’s a clear technical breakdown of XAUUSD (Gold) based on the current chart structure. Gold is still trading within a broader ascending trend, supported by a well-defined rising trend line from the pivot point. The market previously made an impulsive bullish move, but price has now reached a major Supply Zone around 4,350, where strong selling pressure emerged. This area has already produced a fake breakout, clearly signaling buyer exhaustion and the presence of aggressive sellers at higher levels. At the highs, price action shows hesitation and rejection inside the supply zone, indicating that bullish momentum is weakening rather than continuing. After the fake breakout, gold started to roll over, suggesting that the recent move was a liquidity grab rather than true continuation.
Currently, price is pulling back toward the 4,260 Demand Zone, which also aligns with the rising trend line and a previous breakout area. This zone represents the first key downside target and a critical decision area for the market. The move lower appears impulsive, supporting the idea of a corrective phase turning into a deeper pullback.
My scenario: as long as XAUUSD remains below the 4,350 Supply Zone, the short-term bias favors sellers. I expect continuation to the downside toward the 4,260 Demand Zone. A clean breakdown below this level would signal a loss of bullish structure and open the door for a deeper correction. However, a strong bullish reaction from demand could lead to consolidation or a temporary bounce. For now, the structure favors a short-term bearish correction, with 4,350 as key resistance and 4,260 as the main downside target. Manage your risk!

GOLD Technical Analysis! SELL!
My dear friends,
My technical analysis for GOLD is below:
The market is trading on 4409.5 pivot level.
Bias - Bearish
Technical Indicators: Both Super Trend & Pivot HL indicate a highly probable Bearish continuation.
Target - 4388.3
Recommended Stop Loss - 4423.1
About Used Indicators:
A pivot point is a technical analysis indicator, or calculations, used to determine the overall trend of the market over different time frames.
Disclosure: I am part of Trade Nation's Influencer program and receive a monthly fee for using their TradingView charts in my analysis.
———————————
WISH YOU ALL LUCK

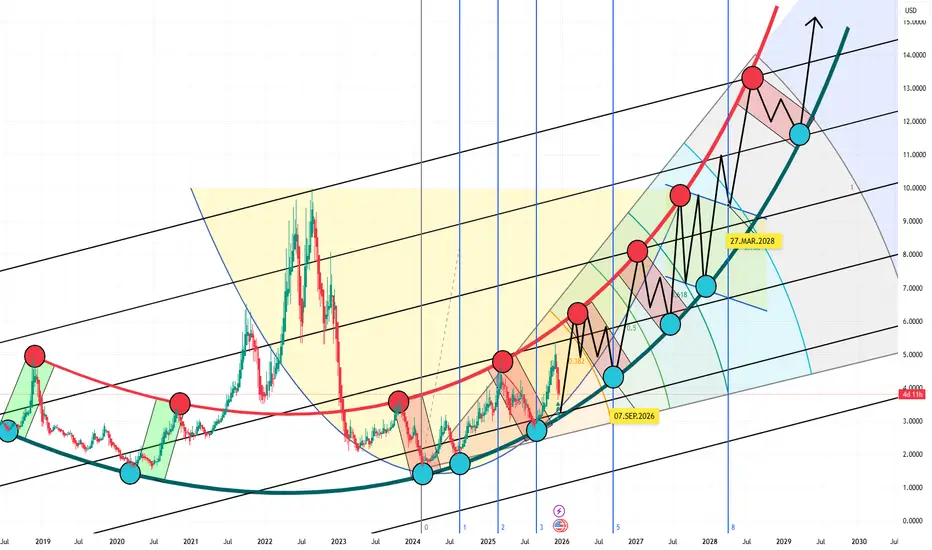
Fibonacci Train Final Boarding: The 2026 RideA decade-long channel of unchanged width explodes into view like a living Fibonacci spiral, price carving its path with surgical precision. It feels as if a master artist is sketching a priceless masterpiece while accelerating his own train—fully in control, no brakes, no hesitation. This is not abstract art; this is pure momentum with intent. Miss a station and you are not late you are gone.
This is the CUP scenario in its raw form: the channel holds its width, at the very least, through 2028, locked in structure and discipline. Every buying stop is irreversible, a one-way decision point. Fibonacci numbers are not guiding this move they are drawing a priceless master piece in real time.
its an absolute not trading advice just a personal imaginary thoughts
XAUUSD Trade SetupBackground:
- XAUUSD broke all time high at 4375
- zoned around 4378 - 4385
Trade Setup as per the chart.
⚠️ Disclaimer ⚠️This journal entry is for educational and documentation purposes only. It does not constitute financial advice or a recommendation to trade. All trading involves risk, and past performance does not guarantee future results. Always conduct your own analysis and consult with a licensed financial professional before making trading decisions.

GBP/USD | BSLs ahead! (READ THE CAPTION)As you can see in the hourly chart of GBPUSD, it has broken through both the FVG and IFVG and is now in the supply zone. There are BuySide Liquidities above at 1.34466 and 1.34559 which I expect to be swept away.
Mind the fact that we don't have any impactful news today and is practically the last week of the year, so please don't get yourselves hurt.

Ascending Triangle After Fake Breakout Bullish Continuation This 1-hour Gold (XAUUSD) chart shows a well-defined ascending triangle structure within a rising channel. Price continues to respect the ascending support trendline, forming higher lows while pressing against a key resistance zone.
A recent fake breakout above resistance was quickly rejected, suggesting liquidity grab rather than trend reversal. After the rejection, price held structure and returned to the triangle support, keeping the bullish bias intact.
As long as price holds above the ascending trendline, the idea favors a continuation move toward the marked target area near 4413 aligned with prior highs and channel resistance. A clean breakout and acceptance above resistance would confirm momentum.
This is a technical structure-based idea, not a prediction—always manage risk and wait for confirmation.

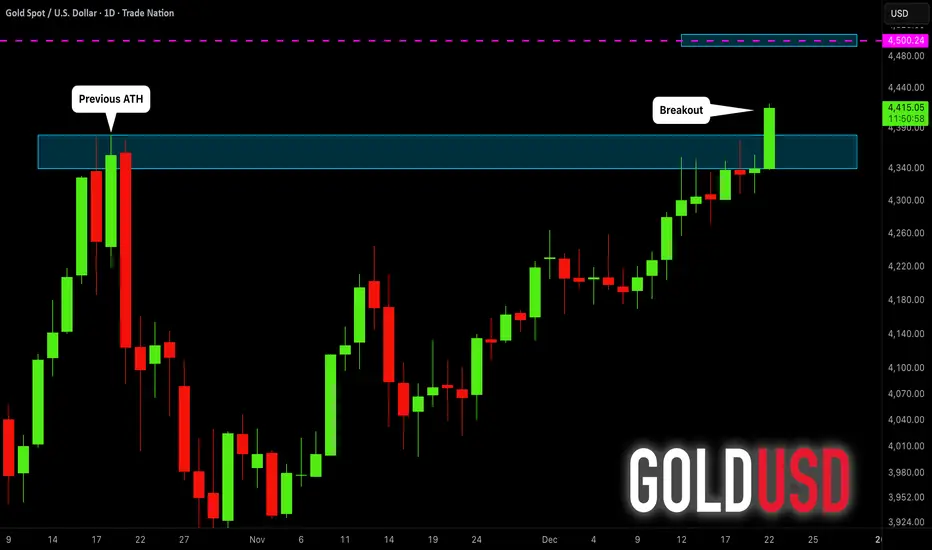
GOLD (XAUUSD): The Next Strong Resistance
As Gold has successfully updated the ATH today,
here is the next strong resistance that I see.
It is based on 4500 psychological level.
I believe that it will be the next goal for the buyers.
❤️Please, support my work with like, thank you!❤️
I am part of Trade Nation's Influencer program and receive a monthly fee for using their TradingView charts in my analysis.
XAUUSD | Rate-Cut Hopes & Geopolitical Risks Fuel RallyGOLD | Technical & Fundamental Overview
Gold surged to a record high above $4,420, driven by growing expectations of U.S. rate cuts next year and rising safe-haven demand amid heightened geopolitical tensions.
Markets are increasingly positioning for a looser U.S. monetary policy into 2026, which remains a strong supportive backdrop for non-yielding assets like gold.
The rally is also supported by continued central-bank purchases, steady inflows into gold-backed funds, and escalating geopolitical risks following renewed U.S. pressure on Venezuela.
Technically:
To maintain the bullish continuation, gold needs to close a 1H candle above 4420, which would open the way toward 4430 and 4445, with further extension toward 4460.
However, as long as the price trades below 4420, a short-term correction is likely:
First toward 4400
Then potentially toward 4379 – 4367
Pivot Line: 4420
Resistance: 4430, 4445, 4460
Support: 4400, 4380, 4368
Bias: Bullish above 4420; corrective below it.

XAUUSD Demand Holding - Resistance Retest in PlayHello traders! Here’s my technical outlook on Gold (XAUUSD, 4H) based on the current chart structure. After a strong bullish impulse from the 3,650–3,700 area, price formed a clear ascending channel, respecting both rising support and resistance. Higher highs and higher lows continue to confirm bullish market control. Previously, Gold reached the Seller Zone around 4,360–4,380, where price entered consolidation and later turned lower. Selling pressure weakened near the 4,270 level, allowing buyers to step back in. Price then broke above 4,270, flipping it from resistance into support and signaling a bullish market structure shift. A corrective pullback followed into the Buyer Zone at 4,260–4,280, aligning with previous resistance turned support and the lower boundary of the ascending channel. Buyers successfully defended this area, keeping the bullish structure intact. Currently, price is consolidating below the Seller Zone (4,360–4,380), showing accumulation rather than strong rejection. My scenario: as long as price holds above the Buyer Zone (4,260–4,280), Gold may continue higher toward the Seller Zone / TP1. A clean breakout above resistance would open the door for further upside, while a failure to hold support could lead to a deeper corrective move. For now, the bias remains bullish. Please share this idea with your friends and click Boost 🚀

USDCAD: 2-week horizon🛠 Technical Analysis: On the 4-hour timeframe, USDCAD has invalidated its ascending channel structure, triggering a "Global bearish signal" confirmed by the death cross of the SMA 50 below the SMA 100 and 200. The pair is currently under strong selling pressure but is approaching a major support zone near 1.3730, which aligns with previous accumulation levels. The projected trade setup anticipates a stabilization at this support floor, followed by a corrective rally targeting the breakdown point and the SMA cluster around 1.3980 - 1.4000.
———————————————
❗️ Trade Parameters (BUY)
———————————————
➡️ Entry Point: Buy Limit at the support zone (approx. 1.3730 – 1.3750)
🎯 Take Profit: 1.3980 – 1.4015 (Resistance)
🔴 Stop Loss: Below the support structure (approx. 1.3600)
⚠️ Disclaimer: This is a potential trade idea based on current analysis; market conditions and price direction are subject to change based on news factors and volatility.

DeGRAM | GOLD reached the $4420 level📊 Technical Analysis
● XAU/USD extended its advance within a rising channel but stalled near the upper boundary and horizontal resistance around 4,420, where multiple rejections formed exhaustion signals. The sharp impulse leg was followed by a loss of momentum, suggesting a short-term top.
● Price is now rotating below the rising resistance line, with corrective pullback risk toward the inner channel and former support near 4,400–4,380. Failure to hold this zone opens a deeper retracement toward the rising support line around 4,350.
💡 Fundamental Analysis
● Gold faces near-term pressure from a firmer USD and reduced safe-haven demand as markets reassess rate expectations after recent US macro data.
✨ Summary
● Short-term correction favored. Resistance: 4,420. Supports: 4,400–4,380, then 4,350. Invalidation above channel resistance.
-------------------
Share your opinion in the comments and support the idea with a like. Thanks for your support!

EUR/USD | Euro back on track?(READ THE CAPTION)As you can see in the hourly chart of EURUSD, it is testing the supply zone above it and it may take a while before it breaks through it. The first Buyside Liquidity zone at 1.17275 has been swept, and EUR is now on its way to the second BSL zone, at 1.17380 . I expect the liquidity to be swept away and then a drop in price, before regaining momentum to go for the next BSL at 1.17461.

BTC/USD – H1 Analysis...BTC/USD – H1 Analysis (Based on my chart)
Market Structure
Price is forming an ascending triangle (higher lows + horizontal resistance).
Holding above the Ichimoku cloud, bullish pressure is active.
A breakout is likely after this compression phase.
📈 Buy Scenario
Buy Zone: 88,800 – 89,200
🎯 Targets
Target 1: 90,500
Target 2: 92,000
❌ Invalidation
A strong H1 close below 87,800 will invalidate this bullish setup.
📌 Summary
Bias: BUY
Trend: Bullish continuation
Pattern: Ascending triangle breakout
Expectation: Price to move upward toward the marked Target Point

XAUUSD Intraday Plan | Gold Hits All-Time Highs, 4422 in FocusGold has pushed to a fresh all-time high during the Asian session and is currently trading around 4413.
Immediate resistance sits at 4422 — a confirmed break and hold above this level could open the door for a continuation toward 4460.
If this upside move fails and price fades back, then focus shifts to the lower support levels and reaction zone for potential bounce.
We may see trading volume die down into the end-of-year holidays, which can lead to thin liquidity and exaggerated moves (sharp spikes, whipsaws, and false breakouts).
📌Key level to watch:
Resistance:
4422
4460
Support:
4391
4358
4322
4298
🔎Fundamental Focus:
With year-end holidays approaching, liquidity can thin out and volume often drops — which increases the risk of exaggerated moves, stop-runs, and false breakouts around key levels. This week still has a few USD catalysts worth respecting: a heavy Tuesday slate including GDP + Durable Goods, plus Consumer Confidence/Richmond Fed, followed by jobless claims mid-week. Expect volatility spikes around these releases, but also choppier price action between them — so it’s a good week to size down, and wait for clean confirmation before committing to a setup.

ETHUSD 3H chart pattern...(ETHUSD 3H chart pattern)
Target price: around $3,400
You can label it as:
Target
Target price
Upside target
Price target: $3,400
If my want a full sentence for analysis notes:
“If price holds above support and confirms the breakout, the upside target is around $3,400.”
If my want, I can also help my phrase it for:
or a risk–reward description 👍

WTI Oil Bearish Outlook | Bear Flag Breakdown or Fakeout Ahead?WTI Oil (XTIUSD) price remains in a clear bearish structure trading below the descending channel and key resistance levels. After rejecting the 61.8% Fibonacci retracement near 58.30 oil continued to make lower highs and lower lows confirming sellers are still in control. The recent bounce from the 55.00 demand zone looks corrective and has formed a bear flag pattern which usually signals continuation to the downside. Price is currently consolidating around 57.20 below previous BOS and under the channel resistance indicating weakness.
As long as oil stays below 58.00–58.50 the bearish bias remains intact with liquidity resting below recent lows.
🔻Sell Setup 1: Bear Flag Rejection (Primary Setup)
- Sell Zone: 57.80 – 58.30
- Reason: Price is forming a bear flag after a strong drop and is rejecting the 61.8% Fibonacci level, with bearish market structure intact.
- Stop Loss: Above 59.50 (above channel & structure high)
- Targets: TP1: 55.00, TP2: 53.00, TP3: 52.00
🔻Sell Setup 2: Higher Resistance Sell (Liquidity Grab)
- Sell Zone: 59.80 – 60.30
- Reason: This zone aligns with strong resistance, previous supply, and descending channel top, where liquidity above recent highs may be taken before reversal.
- Stop Loss: Above 61.00
- Targets: TP1: 57.20, TP2: 55.00, TP3: 53.00
A strong rejection from the sell zone favors continuation lower, while a sustained break above 60.50 would invalidate the bearish setup.
Note
Please risk management in trading is a Key so use your money accordingly. If you like the idea then please like and boost. Thank you and Good Luck!
