Silver - This metal is blowing up now!💣Silver ( OANDA:XAGUSD ) is rallying even higher:
🔎Analysis summary:
Just a couple of months ago, we witnessed another bullish break and retest on Silver. It was quite obvious that Silver will rally accordingly and just recently, we experienced another +150% rally. However, looking at the higher timeframe, Silver is still not done.
📝Levels to watch:
$100
SwingTraderPhil
SwingTrading.Simplified. | Investing.Simplified. | #LONGTERMVISION
Commodities

Gold Spot / USD – H1 | Macro Resistance – Liquidity Sweep StyleGold prices remain supported within a broader bullish market structure after a strong impulsive rally from the demand zone. The current price action suggests a pause near a key supply area, indicating the market may be preparing for a liquidity-driven correction rather than immediate continuation.
The price is now trading just below a well-defined resistance zone around 4,480–4,500, which has previously acted as a distribution area. Multiple rejections from this zone highlight active seller interest, making it a critical level to watch for a potential rejection or failed breakout.
A pullback scenario is favored if price continues to hold below resistance. In this case, a corrective move toward the 4,420 support zone is likely first. Failure to hold this support could open the path for a deeper retracement into the gap-fill area around 4,340, aligning with the broader demand zone near 4,315, where stronger buying interest is expected to re-emerge.
Despite the potential for a sharp correction, the higher-timeframe bias remains bullish. Such a pullback would be considered a healthy reset, allowing the market to absorb liquidity and build a stronger base for the next leg higher.
A clean breakout and sustained acceptance above the 4,500 resistance zone would invalidate the corrective setup and signal continuation toward the previous highs.

1:2000Today’s plan was based on separating analysis from execution.
Price reacted strongly from the higher-timeframe 61.8–78.6% Fibonacci demand zone, aligned with a high-volume area, confirming acceptance and interest from buyers. The broader context suggested a potential continuation to the upside, but no trade was taken until structure confirmed it.
Execution trigger:
• Break of the descending structure
• Formation of a clear Higher Low (HL)
• Retest of that HL with rejection
• Momentum confirmation (RSI holding above 50, MACD turning up)
Entry: After HL retest and bullish confirmation
Stop-loss: Below the validated HL (structure-based, not emotional)
Invalidation: Loss of the HL
The focus was not on predicting the move, but on waiting for the market to prove itself.
Patience first, execution second.

GOLD BEARISH BIAS RIGHT NOW| SHORT
GOLD SIGNAL
Trade Direction: short
Entry Level: 4,460.42
Target Level: 4,408.00
Stop Loss: 4,495.06
RISK PROFILE
Risk level: medium
Suggested risk: 1%
Timeframe: 1h
Disclosure: I am part of Trade Nation's Influencer program and receive a monthly fee for using their TradingView charts in my analysis.
✅LIKE AND COMMENT MY IDEAS✅

Gold’s Rally Is Losing Momentum — Is a Deeper Pullback Loading?OANDA:XAUUSD has staged a strong bullish recovery from the lower demand zone, developing a clear ascending channel on H1. The sequence of higher highs and higher lows confirms that buyers were firmly in control during the impulsive phase of the move.
However, momentum has started to fade as price reached a major supply and resistance zone around 4,490–4,520. Multiple rejections from this area signal that sell-side pressure is increasing, and the market is no longer trending impulsively but transitioning into a distribution and corrective phase.
Currently, price is trading back below the upper channel structure and hovering near the 4,450–4,455 region, which aligns closely with the rising EMA and prior intraday structure. This area acts as a short-term decision point: holding above it keeps the bullish structure technically valid, while failure would confirm a deeper correction.
- Bullish scenario: If price reclaims strength above 4,500 and breaks the upper channel with acceptance, bullish continuation toward 4,540–4,560 becomes likely.
- Bearish scenario: A sustained breakdown below 4,450, followed by a pullback and rejection, would confirm a corrective move targeting 4,400, with extended downside toward the 4,330–4,350 demand zone.
At this stage, the market is no longer offering easy trend trades. Patience is crucial, as the middle of the structure carries high risk, and the next high-probability opportunity will emerge only after a clear confirmation of direction.

Falling towards 38.2% Fib support?WTI Oil (XTI/USD) is falling towards the pivot, which is a pullback support that aligns with the 38.2% Fibonacci retracement and could bounce to the 1st resistance.
Pivot: 57.65
1st Support: 57.15
1st Resistance: 58.55
Disclaimer:
The opinions given above constitute general market commentary and do not constitute the opinion or advice of IC Markets or any form of personal or investment advice.
Any opinions, news, research, analyses, prices, other information, or links to third-party sites contained on this website are provided on an "as-is" basis, are intended to be informative only, and are not advice, a recommendation, research, a record of our trading prices, an offer of, or solicitation for, a transaction in any financial instrument and thus should not be treated as such. The information provided does not involve any specific investment objectives, financial situation, or needs of any specific person who may receive it. Please be aware that past performance is not a reliable indicator of future performance and/or results. Past performance or forward-looking scenarios based upon the reasonable beliefs of the third-party provider are not a guarantee of future performance. Actual results may differ materially from those anticipated in forward-looking or past performance statements. IC Markets makes no representation or warranty and assumes no liability as to the accuracy or completeness of the information provided, nor any loss arising from any investment based on a recommendation, forecast, or any information supplied by any third party

Bullish momentum to continue?Silver (XAG/USD) could make a short-term pullback to the pivot and could bounce to the 1st resistance, which is a swing high resistance.
Pivot: 76.97
1st Support: 74.36
1st Resistance: 82.36
Disclaimer:
The opinions given above constitute general market commentary and do not constitute the opinion or advice of IC Markets or any form of personal or investment advice.
Any opinions, news, research, analyses, prices, other information, or links to third-party sites contained on this website are provided on an "as-is" basis, are intended to be informative only, and are not advice, a recommendation, research, a record of our trading prices, an offer of, or solicitation for, a transaction in any financial instrument and thus should not be treated as such. The information provided does not involve any specific investment objectives, financial situation, or needs of any specific person who may receive it. Please be aware that past performance is not a reliable indicator of future performance and/or results. Past performance or forward-looking scenarios based upon the reasonable beliefs of the third-party provider are not a guarantee of future performance. Actual results may differ materially from those anticipated in forward-looking or past performance statements. IC Markets makes no representation or warranty and assumes no liability as to the accuracy or completeness of the information provided, nor any loss arising from any investment based on a recommendation, forecast, or any information supplied by any third party

Venezuela: The "Blue Gold" Heist (It’s Not Just Oil)If you rode the Western Digital ( NASDAQ:WDC ) trade with me, you saw what happens when the market realizes AI needs Space. We caught the bottom on WDC because the infrastructure trade was obvious. (See related idea: The Vault of the AI Era)
But the "Supercycle" doesn't stop at Storage. It goes deeper. From Bytes (Software) ➡️ to Atoms (Raw Materials).
1. The "Blue Gold" Thesis 🇺🇸🇻🇪 Everyone is debating the oil politics of the US & Venezuela. They are missing the Tech Angle. Venezuela sits on the Orinoco Mining Arc, home to massive reserves of Coltan ("Blue Gold") and Rare Earths.
The Reality Check: You cannot build an NVDA GPU, a WDC hard drive, or a TSLA robot without these minerals. Coltan is the "blood" of the electronics industry.
The Pivot: The US "Reconstruction" effort isn't just charity. It is a strategic move to secure the physical supply chain of the AI era. They are breaking the monopoly on critical tech inputs.
2. The "Hard Asset" Rotation 🔄 Smart Money is rotating from "Overvalued Tech" to "Undervalued Resources."
Silver ( NASDAQ:XAG ): The ultimate "Hybrid." It wins twice—once on inflation (Venezuela spending), and again on the massive industrial demand for the AI grid. (See my "Curse Broken" analysis)
Gold ( TVC:XAU ): The Liquidity Sponge. If they print money to rebuild, Gold goes up. Simple math.
3. The Chart: The REMX Breakout 📉 I marked up the Weekly Chart of the Rare Earth ETF ( AMEX:REMX ) because the geometry is too clean to ignore.
The Wedge: We just broke out of a multi-year Falling Wedge (Blue Channel). In my experience, this is the "Terminator" of bear markets.
The Floor: We are bouncing perfectly off the Green Support Zone ($50-$60). The "Peak Fear" is in.
The Trade: While Tech is at All-Time Highs, the inputs for Tech are at multi-year lows. That is the opportunity.
REMX 1D:
👇 The "Physical AI" Watchlist: We are playing the Supply Chain, not the noise.
The Brains: NASDAQ:NVDA (Compute)
The Vault: NASDAQ:WDC (Storage Infrastructure)
The Atoms: AMEX:REMX , NYSE:MP (Rare Earths)
The Hedge: TVC:SILVER , TVC:GOLD , $
The Question: We all own the Chips ( NASDAQ:NVDA ). But be honest—do you own a single ounce of what the chips are actually made of?
Disclaimer: Just sharing my read on the macro supply chain. Not financial advice.

SILVER H1 | Bullish Bounce Off Overlap SupportBased on the H1 chart analysis, we could see the price fall to our buy entry level at 77.40, which is an overlap support that is slightly below the 38.2% Fibonacci retracement.
Our stop loss is set at 74.51, which is an overlap support that is slightly below the 61.8% Fibonacci retracement.
Take profit is set at 82.38, which acts as a swing high resistance.
High Risk Investment Warning
Stratos Markets Limited (

Rising Wedge Signals Sell from HighGold (XAUUSD) – H1 Complete Analysis (Rising Wedge + RSI + Volume)
On the H1 timeframe, Gold is showing signs of a distribution phase. During the recent session, price has formed a Rising Wedge pattern, which is considered a bearish reversal or bearish continuation pattern, especially when it appears near the end of a move.
The Rising Wedge structure is clearly visible, where price is making higher highs and higher lows, but both trendlines are gradually converging. This indicates that although price is moving higher, buying strength is weakening. In many cases, the market uses this structure to collect liquidity at higher levels before breaking down to the downside.
The RSI analysis further confirms this weakness. RSI is trading around the 57–60 zone, close to overbought territory, but it is not showing strong bullish continuation. While price continues to move higher, RSI is failing to follow with the same strength, sign ling loss of momentum and increasing the probability of a bearish move. This behavior is commonly seen in sell-from-high setups.
Volume behavior provides an important confirmation. As price moved higher within the rising wedge, volume gradually declined, which suggests that smart money is not aggressively buying at higher levels but is instead distributing positions. In such conditions, once the lower support of the wedge is broken, a strong bearish move accompanied by a volume spike is often seen.
When all three factors are combined Rising Wedge (bearish pattern), weak RSI momentum, and declining volume the sell-from-high bias on Gold H1 becomes stronger.
Trade Idea:
The preferred approach is to look for sell opportunities near the upper boundary of the wedge or recent highs, but only after proper confirmation, such as a bearish candle close or a clear break below wedge support.
Targets: TP1: Midpoint of the wedge
Main Target: 4300 zone (next liquidity)
Stop Loss:
Above the recent high or above the wedge structure (tight risk management)

Cocoa Trend Continuation Scenario | Technical Market Outlook🍫📈 COCOA vs U.S. DOLLAR
Commodities Market Trade Opportunity Guide | Swing Trade
📊 MARKET OVERVIEW (BIG PICTURE)
Asset: COCOA / U.S. Dollar
Market Type: Soft Commodity
Trading Style: Swing Trade
Directional Bias: BULLISH
COCOA remains one of the most structurally volatile commodities, driven by supply concentration, climate sensitivity, and demand elasticity. After an extended impulse move, price is now digesting gains through a controlled pullback, which is technically healthy in an ongoing bullish environment.
This setup is not a breakout chase — it is a pullback-to-support continuation play, designed for smart positioning rather than emotional entries.
🧠 TECHNICAL STRUCTURE EXPLAINED (WHY BULLISH?)
📐 1️⃣ SIMPLE MOVING AVERAGE (SMA) PULLBACK
Price has retraced toward its key Simple Moving Average, which is acting as:
Dynamic support
Trend validation zone
Re-entry area for institutional buyers
In trending markets, SMA pullbacks often precede the next impulsive leg when the trend remains intact.
📈 2️⃣ MARKET BEHAVIOR (PRICE ACTION LOGIC)
What we are observing:
No aggressive bearish expansion
Controlled candles, overlapping ranges
Sellers failing to break below demand
This behavior signals accumulation, not distribution.
➡️ Smart money typically builds positions during pullbacks, not at tops.
🌀 3️⃣ MOMENTUM RESET
Indicators like RSI & momentum oscillators are cooling from overbought levels, which:
Reduces downside risk
Resets fuel for the next move
Improves risk-to-reward for long positions
This is exactly where layered entries outperform single entries.
🎯 ENTRY STRATEGY — LAYERED POSITIONING (THIEF METHOD)
🔑 WHY LAYERING?
Instead of predicting the exact bottom, this strategy:
Distributes risk
Improves average entry price
Reduces emotional decision-making
You are building a position, not gambling on one price.
BUY LIMIT ENTRY ZONES
Layered Buy Limits:
5900
6000
6100
6200
You may:
Add more layers
Reduce position size per layer
Adjust spacing based on volatility
➡️ Any price level entry is allowed as long as risk is controlled.
🛡️ STOP LOSS LOGIC (RISK FIRST)
Stop Loss: 5800
WHY THIS LEVEL?
Below the SMA structure
Below recent demand
Invalidates bullish pullback thesis
If price reaches this zone, it means:
❌ Buyers failed to defend structure
❌ Trend continuation is invalid
❌ Capital preservation becomes priority
⚠️ Always adjust SL based on your account size and risk rules.
Do not blindly follow any single SL.
💰 TARGET LOGIC — PROFIT ZONE EXPLAINED
🎯 PRIMARY TARGET: 6600
This zone represents:
🚓 Strong historical resistance
📊 Overbought reaction area
🧠 Profit-booking zone for large players
Expect:
Volatility spikes
False breakouts
Sharp pullbacks
➡️ Smart traders scale out profits instead of holding blindly.
⚠️ Take profits according to your own strategy.
🔗 RELATED MARKETS & CORRELATION (VERY IMPORTANT)
💵 US DOLLAR (DXY)
Strong USD = pressure on cocoa prices
Weak USD = tailwind for commodities
Always check USD strength before adding size.
🍬 SUGAR ($)
Same soft-commodity family
Moves on supply & weather narratives
Often confirms sentiment shifts
☕ COFFEE ($)
Highly speculative soft commodity
Volatility alignment helps timing entries/exits
📦 BROAD COMMODITY SENTIMENT
If:
Commodities are strong → cocoa strength more reliable
Commodities are weak → reduce position size
🌍 FUNDAMENTAL & ECONOMIC FACTORS (WHY COCOA MOVES HARD)
🌾 SUPPLY CONCENTRATION
Majority of global cocoa supply comes from West Africa
Any disruption = immediate price reaction
🌦 CLIMATE & WEATHER RISK
Rainfall irregularities
Crop disease
Climate stress
Even rumors can move prices aggressively.
🏭 DEMAND & COST PRESSURE
Chocolate manufacturers face rising costs
Grinding activity fluctuations affect demand expectations
Price adjustments often lag — causing volatility
💵 MACRO FACTORS
Interest rate expectations
USD liquidity
Global risk sentiment
Macro shifts can amplify technical moves.
📅 EVENTS TO MONITOR
👀 Crop condition updates
👀 Export data & supply commentary
👀 Central bank decisions affecting USD
🧠 FINAL TRADE LOGIC (SUMMARY)
✔️ Bullish trend intact
✔️ SMA pullback = high-probability zone
✔️ Layered entries reduce risk
✔️ Fundamentals support volatility
✔️ Risk management is mandatory
📈 If this analysis adds value:
👍 Like | 💬 Comment | ⭐ Follow
Trade with patience.
Trade with structure.
Protect capital first.

Gold Price Forecast Today (XAUUSD)Gold Price Forecast Today (XAUUSD) – Intraday Bullish Continuation Setup
Market Overview
Gold (XAUUSD) is currently trading within a short-term bullish recovery structure on the H1 timeframe, following a strong rebound from the recent swing low. Price action shows a sequence of higher lows, indicating buyers are gradually regaining control after the previous sell-off.
The current market context favors buy-the-dip strategies, as long as key intraday support levels hold.
Key Technical Structure Analysis
Trend & Price Action
The market has formed a bullish corrective trendline connecting recent higher lows.
Price successfully defended the demand zone around 4,430 – 4,450, confirming buyer interest.
The latest pullback appears corrective rather than impulsive, suggesting continuation potential.
Support and Resistance Levels
Major Support Levels
4,450 – 4,465: Intraday demand zone and structure support
4,430 – 4,428: Fibonacci confluence + previous reaction low
4,375: Invalidation level for bullish bias
Key Resistance Levels
4,500 – 4,510: First resistance and liquidity zone
4,545 – 4,555: Previous supply area
4,590 – 4,600: Bullish extension target and projected breakout zone
Fibonacci Analysis
Fibonacci retracement drawn from the recent swing low to swing high shows:
38.2% – 50% retracement zone aligns perfectly with the current pullback area
This confluence strengthens the probability of a bullish continuation from current levels
EMA & Momentum Indicators
EMA Structure
Price is holding above the short-term EMA cluster, maintaining bullish structure
EMA slope remains upward, confirming trend strength
RSI Analysis
RSI is holding above the 50 level
No bearish divergence detected
Momentum remains healthy for continuation rather than reversal
Intraday Trading Strategies
Strategy 1: Buy Pullback (Primary Setup)
Entry Zone: 4,450 – 4,465
Stop Loss: Below 4,375
Targets:
TP1: 4,500
TP2: 4,550
TP3: 4,590 – 4,600
Strategy 2: Breakout Continuation
Buy on confirmed H1 close above 4,510
Stop Loss: Below breakout structure
Target Zone: 4,580 – 4,600
Market Bias for Today
Intraday Bias: Bullish
Condition: Valid while price holds above 4,430
Risk Scenario: A sustained break below 4,375 would invalidate the bullish setup and shift bias to neutral or bearish
Conclusion
Gold remains technically supported by trendline structure, Fibonacci confluence, EMA alignment, and RSI momentum. The current setup favors continuation to the upside, with disciplined risk management and patience for confirmation.

Gold H1 Analysis: Resistance Reaction Signals a Healthy PullbackHello, I’m Camila.
Looking at the H1 chart, I can see that gold has reached a well-defined resistance zone and is now reacting rather than breaking through impulsively. Instead of aggressive continuation, price action is showing hesitation, with shorter candles and overlapping ranges. This behavior tells me that bullish momentum is pausing, not reversing, as the market reassesses value after the recent advance.
From a structural standpoint, the broader bullish framework remains intact. The prior impulse leg is still respected, and there is no evidence of a confirmed bearish break of structure. What we are witnessing now is a controlled pullback, typical in trend-driven markets, where price steps back to test whether previous demand is still active. In healthy uptrends, this kind of retracement is often a necessary process to build fuel for the next leg higher.
The zone I am monitoring most closely sits around 4,450, where price is likely to seek liquidity and test buyer commitment. If gold rotates lower into this area and selling pressure continues to fade, I would expect buying interest to re-emerge. Such a reaction would reinforce the bullish narrative and open the door for price to rotate back toward the upper resistance band around 4,520 – 4,550. Only a clean loss of this support area would force me to reassess the current bullish bias.
On the fundamental side, the backdrop continues to favor gold. Persistent geopolitical uncertainty and unresolved macroeconomic risks are keeping safe-haven demand alive. At the same time, expectations that the Federal Reserve will avoid a sharply hawkish shift are limiting upside pressure on the U.S. dollar and Treasury yields. With several high-impact U.S. data releases ahead, I expect volatility to remain uneven, reinforcing the likelihood of a pullback-then-continuation environment rather than a one-directional move.
In summary, I view the current price action as a pause within an ongoing uptrend. As long as gold holds above the key support area and continues to show diminishing bearish momentum, the path of least resistance remains higher after this corrective phase.
Wishing you calm execution and disciplined trading.

GOLD H1 Bearish Reversal Off 78.6% Fib ResistanceThe price is rising towards our sell entry level at 4,497.79, which is an overlap resistance that aligns with the 78.6% Fibonacci retracement.
Our stop loss is at 4,551.65, which acts as a swing high resistance.
Our take profit is set at 4,399.85, which is an overlap support.
High Risk Investment Warning
Stratos Markets Limited (

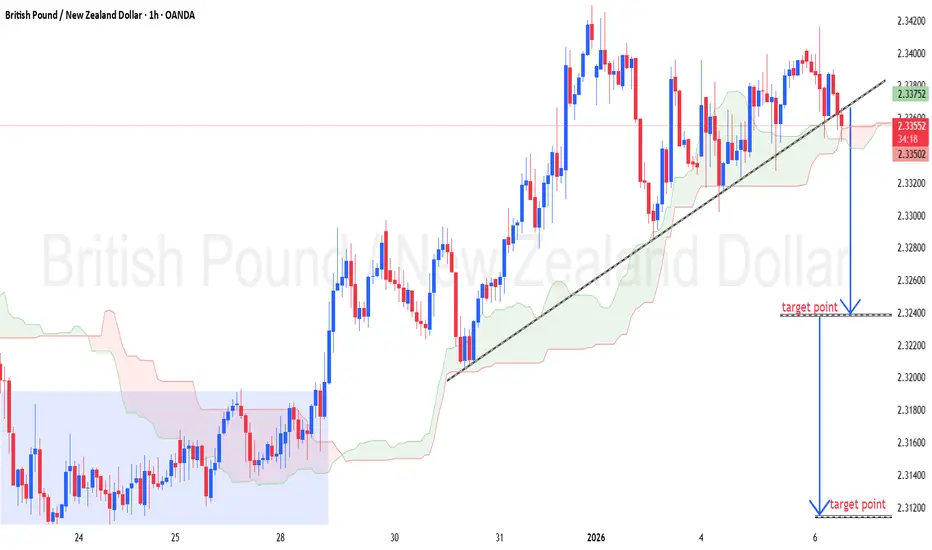
GBPNZD (H1) – Chart pattern...GBPNZD (H1) – Chart pattern.
My shared (trendline break + price under support):
Sell targets:
🎯 TP1: 2.3200
🎯 TP2: 2.3100
Invalidation / SL idea:
❌ Above 2.3450 (recent high & trendline area)
Bias stays bearish as long as price remains below the broken trendline.
If my want, I can also give entry + SL + risk setup clearly.
Latest Gold Price Update TodayGold closed the January 6 trading session up 45 USD at 4,494 USD. The bullish momentum continued into this morning, with prices briefly touching 4,500 USD, moving closer to the previous peak of 4,549 USD set on December 24, 2025.
Safe-haven demand remains strong following the U.S. military strike in Venezuela and the arrest of President Nicolás Maduro over the weekend, which has heightened geopolitical uncertainty and supported gold prices.
Investors are also closely awaiting today’s U.S. employment report for further clues on the Federal Reserve’s interest rate outlook. If the data aligns with expectations for a more accommodative policy stance, the current uptrend in gold could strengthen further.

Gold Outlook: Bullish Momentum Holds on Safe-Haven DemandGOLD | Market Overview
Gold continues to show bullish momentum while trading above the key support zone, supported by safe-haven demand amid ongoing geopolitical tensions.
TECHNICAL VIEW
Bullish bias remains active while price holds above 4407–4420
Upside continuation targets: 4446, followed by 4475 and 4500
Alternatively:
A 1H candle close below 4407 would weaken the bullish structure and shift momentum to the downside toward 4360
Key Levels
Pivot Line: 4431
Support: 4420 – 4407 – 4360
Resistance: 4446 – 4475 – 4500

XAUUSD | Market Structure & Key LevelsPrice is trading in a strong bullish ascending channel, with buyers defending the support zone at 4,280–4,310, which continues to act as a key demand area; as long as price holds above this support, the bullish structure remains intact and pullbacks can be considered healthy. With current price around 4,445, continuation is expected toward the target zone at 4,520–4,560, where major resistance and profit-taking may occur, while a strong close below 4,280 would invalidate this bullish outlook.

GOLD 1H CHART ROUTE MAP UPDATE & TRADING PLAN FOR THE WEEKHey Everyone,
Please see our 1h chart levels and targets for the coming week.
We are seeing price play between two weighted levels with a gap above at 4346 and a gap below at 4310, as support. We will need to see ema5 cross and lock on either weighted level to determine the next range.
We will see levels tested side by side until one of the weighted levels break and lock to confirm direction for the next range.
We will keep the above in mind when taking buys from dips. Our updated levels and weighted levels will allow us to track the movement down and then catch bounces up.
We will continue to buy dips using our support levels taking 20 to 40 pips. As stated before each of our level structures give 20 to 40 pip bounces, which is enough for a nice entry and exit. If you back test the levels we shared every week for the past 24 months, you can see how effectively they were used to trade with or against short/mid term swings and trends.
The swing range give bigger bounces then our weighted levels that's the difference between weighted levels and swing ranges.
BULLISH TARGET
4346
EMA5 CROSS AND LOCK ABOVE 4346 WILL OPEN THE FOLLOWING BULLISH TARGETS
4386
EMA5 CROSS AND LOCK ABOVE 4386 WILL OPEN THE FOLLOWING BULLISH TARGETS
4431
EMA5 CROSS AND LOCK ABOVE 4431 WILL OPEN THE FOLLOWING BULLISH TARGETS
4466
BEARISH TARGETS
4310
EMA5 CROSS AND LOCK BELOW 4310 WILL OPEN THE FOLLOWING BEARISH TARGET
4269
EMA5 CROSS AND LOCK BELOW 4269 WILL OPEN THE SWING RANGE
4231
4184
As always, we will keep you all updated with regular updates throughout the week and how we manage the active ideas and setups. Thank you all for your likes, comments and follows, we really appreciate it!
Mr Gold
GoldViewFX

Hellena | Oil (4H): SHORT to support area of 55.74 (Wave 5).Colleagues, wave “4” of the minor order is ending or has already ended. As part of a major downward movement in wave ‘5’ of the major movement, I expect a downward movement in wave “5” of the minor order.
This wave should update the low of wave “3”, but I believe it is worth looking at the nearest target in the support area of 55.746.
I also allow for the possibility of reaching the 59.00 area before the price begins a downward movement.
Manage your capital correctly and competently! Only enter trades based on reliable patterns!

GOLD A Fall Expected! SELL!
My dear followers,
I analysed this chart on GOLD and concluded the following:
The market is trading on 4460.4 pivot level.
Bias - Bearish
Technical Indicators: Both Super Trend & Pivot HL indicate a highly probable Bearish continuation.
Target - 4450.7
Safe Stop Loss - 4465.7
About Used Indicators:
A super-trend indicator is plotted on either above or below the closing price to signal a buy or sell. The indicator changes color, based on whether or not you should be buying. If the super-trend indicator moves below the closing price, the indicator turns green, and it signals an entry point or points to buy.
Disclosure: I am part of Trade Nation's Influencer program and receive a monthly fee for using their TradingView charts in my analysis.
———————————
WISH YOU ALL LUCK

$BTC Relief Rally Looks Promising₿itcoin showing some real promise here, but got rejected on the Daily Close for the key support zone that it needs to reclaim at the .618 fib ~$94,2k
It did close above the 50DEMA and we have a bullish cross with the 9DEMA on the horizon which should drop us into the new support zone.
CRYPTOCAP:BTC really needs some closes above $97k to make this rally a reality tho.
The next target would be the 50WMA ~$101,5 which could be the critical rejection point where most would be offloading.
The bearish Weekly Close on TVC:GOLD helps confirm this rally.

XAUUSD: Bullish Push to 4650?As the previous analysis worked exactly as predicted, FX:XAUUSD is eyeing a bullish continuation on the 4-hour chart , with price bouncing within an upward channel after recent higher lows, converging with a potential entry zone near support that could fuel upside momentum if buyers hold against short-term pullbacks. This setup suggests a rally opportunity amid the ongoing uptrend, targeting higher resistance levels with overall risk-reward exceeding 1:4 .🔥
Entry between 4300–4320 for a long position. Targets at 4520 (first), 4650 (second). Set a stop loss at a daily close below 4250 , yielding a risk-reward ratio of more than 1:4 in total. Monitor for confirmation via a bullish candle close above entry with rising volume, leveraging gold's momentum in the channel.🌟
Fundamentally , gold is trading around $4,331 in late December 2025, with a quiet week ahead for the US Dollar due to the New Year transition, but key releases could still influence sentiment. On Monday, December 29 at 8:30 AM ET, Advance Goods Trade Balance (Oct) may pressure USD if the deficit widens, signaling weaker exports. Wednesday, December 31 at 8:30 AM ET brings Initial Jobless Claims (Dec 27), where higher claims could weaken USD amid labor concerns. Thursday, January 1 is a New Year's Day holiday, leading to thin liquidity and potential volatility. Overall, softer US data could favor gold's upside in a low-volume
environment. 💡
📝 Trade Setup
🎯 Entry (Long):
4300 – 4320
(Entry within this zone is valid with proper risk & capital management.)
🎯 Targets:
• 4520 (First target)
• 4650 (Second target)
❌ Stop Loss:
• Daily close below 4250
⚖️ Risk-to-Reward:
• > 1:4 overall
💡 Your view?
Does XAUUSD reject the 0.618 extension and slide toward 4375 — or do buyers force a breakout above the channel? 👇
