XAUUSD: Bullish Trend Remains Clear, Pullbacks Are Just a Setup Hi!
On the H4 timeframe, price is moving cleanly within a well-defined ascending channel. What I value most about this rally is not its speed, but the way the market consolidates before each breakout. After the previous advance, XAUUSD did not experience aggressive selling; instead, it entered a consolidation phase with shallow pullbacks of roughly 40–50%. This is a classic characteristic of a strong trend, where selling pressure is limited to short-term profit taking and is quickly absorbed.
Following this accumulation phase, price broke above the corrective trendline, forming a continuation pattern (pennant) and immediately triggering a strong bullish leg. This breakout pushed price deeper into the upper side of the trend channel, confirming a bullish continuation rather than distribution. From my experience, such “clean” breakouts are typically driven by institutional flows, not retail FOMO.
From a fundamental perspective, the current environment continues to favor gold. According to the Forex Factory calendar, the market is closely monitoring upcoming U.S. inflation and labor data, while expectations remain that the Fed will maintain a more accommodative stance, or at least avoid a strongly hawkish tone in the near term. Meanwhile, major outlets such as Bloomberg and Reuters continue to highlight safe-haven demand amid geopolitical risks and slowing global growth. These factors have limited the upside potential of the U.S. dollar and indirectly supported XAUUSD.
At this point, with price trading at fresh highs, I do not expect gold to move straight up. A more realistic scenario is a technical pullback toward the nearest support zone within the ascending channel, around the 4,45x–4,46x area, to retest demand. If this zone holds, it would provide a solid base for price to continue higher toward the next resistance area around 4,55x–4,58x, aligning with the upper boundary of the trend channel.
Wishing you successful trading!
Commodities

(Silver / USD, 1H) Chart pattern...(Silver / USD, 1H):
Visible projected targets on my chart:
Target 1: around 65.00
Target 2: around 59.00
How this is derived (from the image):
Price is currently above an ascending trendline.
The marked arrow shows a pullback to the trendline, with the first horizontal target near 65 (previous structure support).
A deeper continuation move projects toward 59, which aligns with a stronger historical support zone.
Key levels to watch:
Trendline support: ~66.5–67.0
Invalidation: A strong close back above 69.5–70.0 would weaken this downside setup.
This is technical-level interpretation only, not a trade recommendation.
If my want, tell me:
My timeframe (scalp / intraday / swing)
Whether my looking for buy or sell targets
and I’ll refine it further 📊

EUR/USD – H2 Analysis ....EUR/USD – H2 Analysis (Based on My chart)
Market Structure
Price is respecting the ascending trendline.
Holding above the Ichimoku cloud, showing bullish continuation.
Recent consolidation looks like a bullish flag / continuation base.
📈 Buy Scenario
Buy Zone: 1.1700 – 1.1720
🎯 Targets
Target 1: 1.1760
Target 2: 1.1800
❌ Invalidation
A strong H2 close below 1.1670 will invalidate the bullish setup.
📌 Summary
Bias: BUY
Trend: Bullish continuation
Expectation: Price to push higher toward the marked Target Point

XAUUSD – Gold, 2H chart pattern
(XAUUSD – Gold, 2H timeframe), here is the target explanation in clear English:
📈 Market Structure
Trend is bullish (higher highs & higher lows).
Price is above the ascending trendline → buyers are in control.
Price has broken the previous resistance zone and is holding above it (now acting as support).
🎯 Targets
First Target (TP1): 4,450
Main Target (TP2): 4,500 – 4,520
(This matches the marked “target point” zone on my chart)
🛡️ Support / Invalidation
Key Support: 4,360 – 4,340
If price closes below 4,330 (2H close), bullish setup becomes weak.
📌 Summary (Simple)
Gold is in an uptrend. As long as price stays above 4,340, buying pressure remains strong and price can move toward 4,500+.
If my want, I can:
Give a short signal-style format (Entry / SL / TP)

GBPUSD: bearish rejection🛠 Technical Analysis: On the 4-hour (H4) timeframe, GBPUSD has experienced a strong bullish rally following a "Global bullish signal" identified in early December. The price has climbed sharply along a steep diagonal resistance line and has now reached a significant resistance near the 1.35000 level.
The current price action shows a potential exhaustion of the upward move as it hits this heavy resistance. While the moving averages (SMA 50, 100, and 200) are positioned below the price, the distance between the price and the SMA 100 (1.33468) suggests the pair is overextended and due for a mean-reversion correction. The projected path indicates a reversal from this peak back down toward the major support zone.
———————————————
❗️ Trade Parameters (SELL)
———————————————
➡️ Entry Point: Sell on rejection from the resistance zone (approx. 1.34768).
🎯 Take Profit: 1.33430 (Support & SMA 100).
🔴 Stop Loss: 1.35719 (Above the recent local high and resistance zone).
⚠️ Disclaimer: This is a potential trade idea based on current analysis; market conditions and price direction are subject to change based on news factors and volatility.

EURUSD: support line breakdown🛠 Technical Analysis: On the 4-hour timeframe, EURUSD is at a critical crossroads. Following a period of strength marked by a "Global bullish signal" in early December, the pair has been climbing along an ascending Support line.
However, price action is currently showing signs of exhaustion as it struggles to hold above the immediate horizontal support zone at 1.17354. The analysis projects a significant breakdown of both the diagonal trend line and the horizontal support level. A confirmed close below this structure would invalidate the recent bullish momentum and trigger a corrective slide toward the next major liquidity pool at 1.16429.
———————————————
❗️ Trade Parameters (SELL)
———————————————
➡️ Entry Point: Sell on a confirmed breakdown of the support line (approx. 1.17278).
🎯 Take Profit: 1.16429 (Support).
🔴 Stop Loss: Above the recent swing high/resistance (approx. 1.17600).
⚠️ Disclaimer: This is a potential trade idea based on current analysis; market conditions and price direction are subject to change based on news factors and volatility.

USDJPY: continuation move🛠 Technical Analysis: On the 4-hour (H4) timeframe, USDJPY remains firmly in a long-term Ascending Channel, demonstrating a sustained bullish structure.
A significant technical development has occurred: the price has successfully breached a "Broken resistance line" (the descending trendline from previous highs) and is now consolidating above the horizontal resistance zone at 157.271. The moving averages—SMA 50, 100, and 200—are all trending upward and acting as a dynamic support cluster below the current price. The current price action points to a potential breakout of resistance near 158, especially after the price consolidates near this zone.
———————————————
❗️ Trade Parameters (BUY)
———————————————
➡️ Entry Point: Buy after the breakout resistance (approx. 157.916)
🎯 Take Profit: 161.50 – 162.00 (Upper boundary of the Ascending Channel)
🔴 Stop Loss: Below the recent consolidation and SMA cluster (approx. 156.152)
⚠️ Disclaimer: This is a potential trade idea based on current analysis; market conditions and price direction are subject to change based on news factors and volatility.

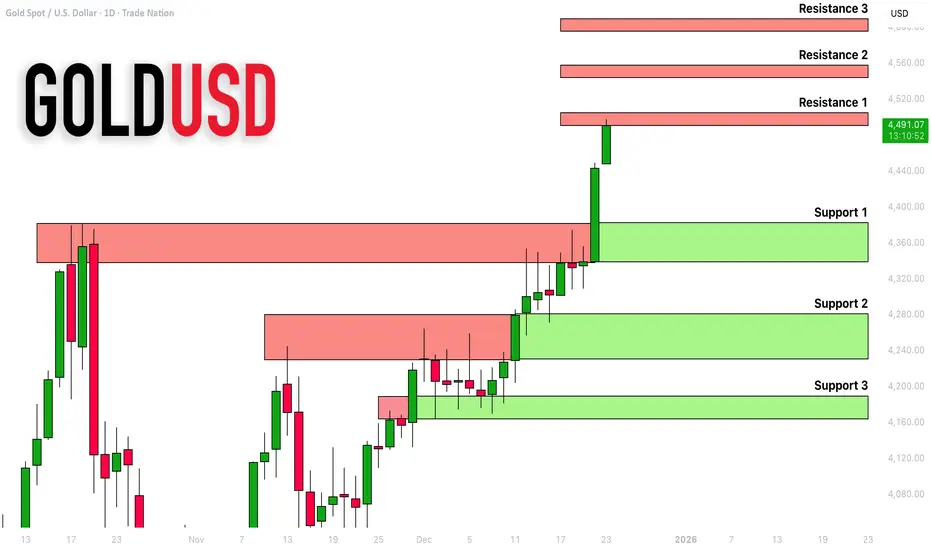
GOLD (XAUUSD): Updated Support & Resistance Analysis
Here are the next potentially strong resistance to focus on Gold chart.
Resistance 1: 4500
Resistance 2: 4550
Resistance 3: 4600
As the price is very close to Resistance 1,
we may see at least a minor pullback from that.
❤️Please, support my work with like, thank you!❤️
I am part of Trade Nation's Influencer program and receive a monthly fee for using their TradingView charts in my analysis.
Gold Bull Market Update and Outlook Q4 2025 / Q1 2026📌 Executive Summary
• Base case (60%): The current pullback is a normal retracement within the primary bull trend. We expect consolidation through late Q4-2025 and potentially into January 2026, followed by a resumption of the uptrend in Q1/Q2-2026.
• Drivers remain intact: Persistent central-bank accumulation, reserve-diversification dynamics, and episodic macro/geopolitical risk keep the structural bid under gold.
• Positioning stance: Maintain core long exposure, add tactically on weakness into the $3.8k–$4.0k zone spot equivalent with tight risk controls, and ladder call spreads into Q2-2026.
• Risk skew: Near-term pullback risk persists position shakeouts, macro data surprises. Structural bearish risks are low unless central-bank demand materially softens.
________________________________________
🧭 Market Context & Recent Price Action
• Gold printed successive record highs into mid-October; front-month futures traded above $4,170/oz before easing. Headlines framed the rally as policy and safe-haven led, with year-to-date gains exceptionally strong.
• Central-bank demand continues to underpin the move: WGC and sell-side coverage highlight accelerating official-sector buying and diversification away from FX reserves; banks forecast higher prices into 2026.
• The current setback aligns with prior bull-market pauses (e.g., Apr–Jul 2025 and Sep 2024–Dec 2024 pullbacks), consistent with the user-stated pattern of multi-month consolidations before trend resumption.
What’s new in headlines late Oct–Nov 2025:
• Pullback is “technical and temporary,” with buy-the-dip framing from UBS; next tactical target cited around $4,200.
• Official-sector flows: Korea & Madagascar exploring reserve increases; PBoC extended buying streak into September.
• WSJ coverage stresses gold’s role in erosion of trust in fiat/central banks and the reserve-diversification theme.
________________________________________
🔑 Structural Bull Case 2025-2026
1. Official-Sector Accumulation:
o Multi-year build in central-bank gold holdings (EM-led) as a sanctions-resilient reserve asset; this remains the single most important marginal buyer narrative.
2. Reserve Diversification & Financial Geopolitics:
o Evidence that gold’s share of global reserves has risen while some institutions reassess currency composition.
3. Macro Volatility & Policy Trajectory:
o Periodic growth scares, policy pivots, and real-rate uncertainty sustain hedging demand. Street targets for late-2026 (e.g., ~$4,900 GS) anchor upside convexity.
4. Market Microstructure:
o Thin above prior highs and crowded shorts on pullbacks can fuel sharp upside re-accelerations when macro catalysts hit data, geopolitics, policy hints.
________________________________________
📊 Technical Map Top-Down
• Primary trend: Up. The sequence of higher highs/higher lows since 2024 remains intact; current move is a trend-within-trend consolidation.
• Pullback anatomy: Prior bull pauses (Apr–Jul 2025; Sep–Dec 2024) lasted 2–4 months, with troughs forming on volatility compression and momentum washouts—a template for now.
• Key tactical zones spot-equiv.:
o $3,800–$4,000: First reload area prior breakout shelf / 50–61.8% of the last leg.
o $4,200–$4,250: First resistance / re-acceleration trigger retests of breakdown pivots.
o $4,350–$4,400: High congestion; decisive weekly close above here re-opens ATH extension.
________________________________________
🗓️ Scenario Pathing Q4-2025 → Q2-2026
• Base Case 60% — “Consolidate then resume”:
o Sideways-to-lower into late Q4/Jan 2026 as positioning resets; range $3.8k–$4.2k.
o Breakout resumption in Q1/Q2-2026 as macro and official flows re-assert.
• Bullish Extension 25% — “Shallow dip, quick reclaim”:
o Softer real yields / risk flare trigger swift recapture of $4.2k–$4.4k and new highs earlier in Q1-2026.
o Catalysts: heavier central-bank prints, geopolitical shock, or earlier policy-easing rhetoric.
• Bear-Risk 15% — “Deeper flush, trend intact”:
o Hawkish macro surprise or forced deleveraging drives $3.6k–$3.7k probes; structure holds unless official-sector demand meaningfully fades
________________________________________
🧪 What to Watch High-Signal Indicators
• Official-Sector Data: Monthly updates from WGC, IMF COFER clues, and PBoC reserve disclosures. Continuation of EM purchases = green light for the bull.
• Rates & Liquidity: Real-rate direction and dollar liquidity conditions around data and policy communications.
• Microstructure: CFTC positioning inflections, ETF out/in-flows a lagging but useful confirmation when they finally turn.
• Asia Physical/Policy: China/Japan retail and wholesale dynamics; policy/tax headlines can create short-term volatility.
________________________________________
🎯 Strategy & Implementation
1) Core:
• Maintain strategic long allocation consistent with mandate e.g., 3–5% risk budget; avoid pro-cyclical reductions during orderly pullbacks.
2) Tactical Adds
• Scale-in buy program within $3.8k–$4.0k
• Optionality: Buy Q2-2026 call spreads (e.g., 4.2/4.8) on dips; fund via selling Q1-2026 downside put spreads around $3.6k–$3.7k where comfortable with assignment.
3) Risk Controls 🛡️:
• Hard-stop any tactical adds on weekly close < ~$3.6k or if credible evidence emerges of official-sector demand reversal.

CRUDE OIL: No-Bias Trading Oil option traders are bracing for increased volatility by buying synthetic Straddles: Long OTM Call + Short Future.
Being market-neutral, it’s a pure volatility play: it earns on price action in either direction. Once it hits the profit target, owner can close it or manage
This isn't a unique story. Such portfolios frequently appear in the market when favorable situations arise, including those that are 'graphically convenient' (look closely at the chart and answer the question: will the price linger at this level for long? Probably not, it'll move somewhere). Options allow you to profit from these chart setups without worrying about the direction of the price move. Cool, right?
Bottom line:
this post is primarily educational, rather than sentiment-revealing. However, we also shouldn't ignore such 'market-neutral portfolios' in our analysis.▶️ If the professional players aren't sure where the market is headed next, maybe we shouldn't overstate our own humble abilities either.

GOLD - We've updated ATH. What's next? A correction?FX:XAUUSD hit a new all-time high, approaching $4,425, for a bunch of reasons, one of which is increased interest in hedging against geopolitical risks...
Fundamental situation:
The US has increased sanctions pressure on Venezuela. Israel is considering options for attacking Iran's nuclear program. Russia-Ukraine negotiations show no progress. Weak US data (inflation and employment) have reinforced expectations of two Fed rate cuts in 2026.
On Tuesday, US GDP data for the third quarter and durable goods orders are expected, as well as speeches by Fed members, which may adjust short-term dynamics. The combination of geopolitical uncertainty and soft monetary policy continues to support the upward trend.
Resistance levels: 4420
Support levels: 4406, 4400, 4380
Any correction is likely to be limited as long as the current fundamental background remains unchanged. However, when entering the market, it is necessary to take into account the level of risk. Buying in the high zone is high risk. We are waiting for a pullback or correction to the indicated zone before making any decisions.
Best regards, R. Linda!

Those who are bullish are right, new highs are not the top.#XAUUSD OANDA:XAUUSD TVC:GOLD
Fueled by escalating geopolitical tensions over the weekend, market risk aversion intensified, driving gold prices higher and easily breaking previous highs to new records. This aligns with our consistent bullish outlook, but we avoid blindly chasing the rally.
Short-term support levels to watch are 4385-4375. If gold prices pull back to this level for the first time during the European session, we can consider taking a small long position in gold.
However, be aware of the current overbought market, suggesting a technical need for a correction. If this correction extends further, it could be substantial. At this point, we need to pay attention to the important support level of 4355-4345. This is where the daily MA5 is located, and it is also the point where the moving averages and the middle Bollinger Band converge in multiple timeframes such as the hourly and 4-hour charts, which provides strong support. Therefore, if gold prices fall further to this level during the day, we can still consider going long on gold.
In short, the most prudent trading approach is to avoid chasing rallies and wait for a pullback before going long

GBPUSD | Testing the supply zone (READ THE CAPTION)As you can see in the 4H chart of GBPUSD, it has swept away the liquidity above 1.34901, going as high as 1.34938. It is now being traded at 1.34810.
I believe that GBPUSD goes to challenge the supply zone at 1.35130-1.35289 level.
Next targets: 1.35279 & 135367

Hellena | Oil (4H): LONG to 50% Fibo lvl (58.00).The structure has broken down. Wave “2” of the middle order should not have updated the minimum of 56,420 of wave “B” of the higher order, but this has happened.
This means that the wave structure will have to be revised.
It seems that the major correction is not yet complete, and in order for the scenario to be completed, impulse “12345” must be completed.
At the moment, I think that the price will begin to form wave “4”.
I expect movement towards the 50% Fibonacci level from wave “3” at 58.00.
The target is not far off, but at the moment we need confirmation of the impulse.
This would mean that the price will update the local minimum, but more on that later.
Manage your capital correctly and competently! Only enter trades based on reliable patterns!

BTC/USDT | Dropping further in price (READ THE CAPTION)As you can see in the Hourly chart of BTCUSDT, yesterday it managed to break through the IFVG, going above 90,000 level again and taking the BSL up there at 90,365, it faced a massive drop all the way to 87,142 and now is being traded at 87,180.
I believe another drop in price to the demand zone and the FVG there at 85,950-86,835 zone and then making an upwards move is possible.

Bullish continuation?Gold (XAU/USD) could fall towards the pivot, which serves as a pullback support, and then bounce to the first resistance.
Pivot: 4,380.08
1st Support: 4,308.92
1st Resistance: 4,498.67
Disclaimer:
The opinions given above constitute general market commentary and do not constitute the opinion or advice of IC Markets or any form of personal or investment advice.
Any opinions, news, research, analyses, prices, other information, or links to third-party sites contained on this website are provided on an "as-is" basis, are intended to be informative only, and are not advice, a recommendation, research, a record of our trading prices, an offer of, or solicitation for, a transaction in any financial instrument and thus should not be treated as such. The information provided does not involve any specific investment objectives, financial situation, or needs of any specific person who may receive it. Please be aware that past performance is not a reliable indicator of future performance and/or results. Past performance or forward-looking scenarios based upon the reasonable beliefs of the third-party provider are not a guarantee of future performance. Actual results may differ materially from those anticipated in forward-looking or past performance statements. IC Markets makes no representation or warranty and assumes no liability as to the accuracy or completeness of the information provided, nor any loss arising from any investment based on a recommendation, forecast, or any information supplied by any third party

Stop!Loss|Market View: USDCAD🙌 Stop!Loss team welcomes you❗️
In this post, we're going to talk about the near-term outlook for the USDCAD currency pair☝️
Potential trade setup:
🔔Entry level: 1.37491
💰TP: 1.38922
⛔️SL: 1.36831
"Market View" - a brief analysis of trading instruments, covering the most important aspects of the FOREX market.
👇 In the comments 👇 you can type the trading instrument you'd like to analyze, and we'll talk about it in our next posts.
💬 Description: The USD will likely remain under pressure from its major peers until early next year. Short-term selling of the USD is being considered. However, the USDCAD currency pair stands out as the best option for medium-term buying of the USD today. A potential false breakout at 1.37335 could provide an excellent entry point for this. The upside target is currently seen near the nearest key resistance level of 1.39000.
Thanks for your support 🚀
Profits for all ✅

Gold Bullish Continuation – Trade Plan & Key LevelsGold is trading within a well-defined ascending channel on the 4H timeframe maintaining a strong bullish structure with higher highs and higher lows. Price has successfully held above the key BOS area around 4374–4380 which is acting as a major demand and continuation zone. The market is currently consolidating below the 4400–4405 resistance marked as a ATH indicating potential liquidity buildup. As long as price holds above 4360–4345 the bullish bias remains intact supported by trendline confluence. A clean breakout and acceptance above 4405–4410 can open the path toward the 4445–4490.
Buy on pullback: 4,370 – 4,345
- SL: Below 4,325
- TP1: 4,405
- TP2: 4,445
- TP3: 4,485 – 4,490
Buy on breakout: Clear 4H close above 4,410
- SL: 4,380
- TP: 4,450 → 4,490
Sell scenario (only if rejection): Strong rejection from 4,405–4,420
- SL: Above 4,445
- TP: 4,360 → 4,325
Overall, the trend remains bullish and sells should only be considered on strong rejection signals. Best strategy is to buy dips or confirmed breakouts keeping risk tight as price approaches the upper channel and year-end volatility remains high.
Note
Please risk management in trading is a Key so use your money accordingly. If you like the idea then please like and boost. Thank you and Good Luck!

XAUUSD 3-Month to 1-Year PredictionThe XAU to USD exchange rate is forecasted to increase by 58.20% in the next three years, rising from the current rate of $ 4,208.48 to $ 6,657.85.

Gold Isn’t Chasing Price — It’s Following a Macro Cycle GOLD (XAUUSD) – H1 | Cycle-Based + Macro Analysis
1. Market Cycle Structure
Gold is moving inside a clean ascending channel, confirming a healthy bull cycle, not an exhaustion phase.
Each impulse leg is followed by controlled pullbacks that stay above prior structure.
No aggressive rejection at highs → acceptance near the upper channel, which is bullish.
This is a trend-continuation cycle, not a blow-off top.
2. EMA Behavior (Trend Validation)
EMA 34 & EMA 89 are stacked bullish and sloping upward.
Price consistently reclaims EMA 34 after shallow pullbacks.
This indicates institutional trend participation, not retail-driven spikes.
➡️ As long as price holds above EMA 34 on pullbacks, the cycle remains intact.
3. Price Action Logic (Cycle Progression)
The current structure shows:
Impulse → flag → impulse
No lower low printed inside the channel
Pullbacks are time-based, not price-based (sideways instead of deep drops)
This behavior typically precedes:
An expansion leg toward the upper channel boundary → new ATH attempt
4. Macro Context (Why Gold Keeps Rising)
Gold’s cycle is supported by macro tailwinds, not speculation:
Real yields remain under pressure → bullish for non-yielding assets
Central banks continue net gold accumulation
USD strength is no longer suppressing gold aggressively
Risk hedging demand remains elevated globally
➡️ This is structural demand, not short-term fear buying.
5. Outlook & Scenario
Primary Scenario (High Probability):
Shallow consolidation near current highs
Brief pullback toward channel midline / EMA support
Continuation breakout toward the upper channel → new ATH zone
Invalidation:
Only a clean break and hold below the channel + EMA 89 would break the cycle
Until then, dips are buy-the-structure, not sell signals
🧠 Final Takeaway
Gold is not overextended.
It is cycling higher in a controlled institutional trend, and price behavior strongly suggests new highs are a matter of timing, not direction.

XAUUSD: Potential Rejection at Resistance – Target 4,421 SupportGold has been on a strong bullish run, but we are now seeing signs of potential exhaustion as price reaches a key psychological and technical resistance zone. The current price action suggests a shift in momentum that could lead to a healthy correction.
Key Technical Levels
Current Price: 4,486.415.
Resistance / Stop Loss Zone: The area between 4,500 and 4,530 is acting as a major supply zone. A break above 4,530.149 would invalidate this bearish outlook.
Immediate Support: Looking for an initial move down toward the 4,465 zone.
Target (Strong Support): The ultimate bearish target sits at the "Strong Support" level near 4,420–4,435.
Trading Strategy
The Setup: I am looking for a rejection at the current local high (approx. 4,497) followed by a lower high to confirm the downward trend.
Risk Management: Keep stops tight above the recent peak. The risk-to-reward ratio on this setup is highly favorable if the price reaches the 4,421 area.

Gold Is Not Topping — It’s Loading for $4,500XAUUSD – H1 Analysis
Market Structure:
Gold is maintaining a strong bullish structure, consolidating tightly below the previous high. This is a classic continuation setup, not a distribution phase.
Key Zones:
- Resistance Zone: The former high area has now been tested and absorbed. Price acceptance above this zone signals strength.
- Support Zone: Buyers continue to defend the higher support band, confirming higher lows and trend control.
Price Action Insight:
Sideways movement under resistance = bullish consolidation.
No aggressive sell-off after breakout → sellers are weak.
Volume remains stable, suggesting institutional accumulation rather than exhaustion.
Primary Scenario:
A brief pullback to retest the breakout zone, followed by continuation toward new highs, with $4,500 as the next psychological magnet.
Risk Scenario:
Only a strong breakdown back below the consolidation range would invalidate the bullish bias.
Conclusion:
Gold is building energy above key levels. As long as price holds above support, dips are opportunities the trend favors continuation, not reversal.

Crude Oil – Sell around 58.40, target 56.00-55.00Crude Oil Market Analysis:
The daily chart for crude oil continues to show a bearish trend. Sell on rallies. In the Asian session, watch for a short position around 58.40, which acts as minor resistance. A stronger resistance level is around 59.60. The overall trend for crude oil is bearish, with short-term consolidation expected. Recent data releases have had limited impact on crude oil.
Fundamental Analysis:
The recent rise in gold prices is no longer significantly related to data releases. It's essentially a long-awaited breakout from a high level after a period of consolidation. The previously released bullish data was merely a catalyst, and the upcoming days are filled with European and American holidays.
Trading Recommendation:
Crude Oil – Sell around 58.40, target 56.00-55.00
