Unlock RSI Secrets: Spot Overbought & Oversold Trades Like a ProThe Relative Strength Index (RSI) is a momentum oscillator that measures the speed and change of price movements.
It ranges from 0 to 100:
Above 70 = Overbought (potential sell signal) 📈⚠️
Below 30 = Oversold (potential buy signal) 📉🛡️
RSI helps you avoid chasing highs or panic selling lows – perfect for Forex, Crypto, and Stocks.
How RSI Works (Quick Calc)
RSI = 100 - (100 / (1 + RS))
Where RS = Average Gain / Average Loss over 14 periods (default).
No math needed – TradingView does it for you! Just add the RSI indicator.
Key Strategies
1- Overbought/Oversold Entries
Enter sells above 70, buys below 30 – but wait for confirmation (e.g., price reversal).
2- Divergences
Bullish: Price makes lower lows, but RSI makes higher lows → Buy signal.
Bearish: Price higher highs, RSI lower highs → Sell signal.
3- Centerline Crossovers
RSI above 50 = Bullish trend
Real Examples Right Now
Bitcoin (BTC/USD): RSI(14)
*** In the chart you see, I have highlighted key areas including overbought and oversold areas, divergence, and also the center line which is colored yellow.***
Pro Tips
Use RSI with other tools (e.g., support/resistance or MACD) for better accuracy.
In volatile markets like Crypto, adjust periods (e.g., RSI(7) for shorter trades).
Avoid trading solely on RSI – always check volume and news.
Backtest on historical charts to see how it performs in your market.
Add RSI to your charts today and level up your edge!
What's your favorite RSI strategy? Share in the comments! 👇
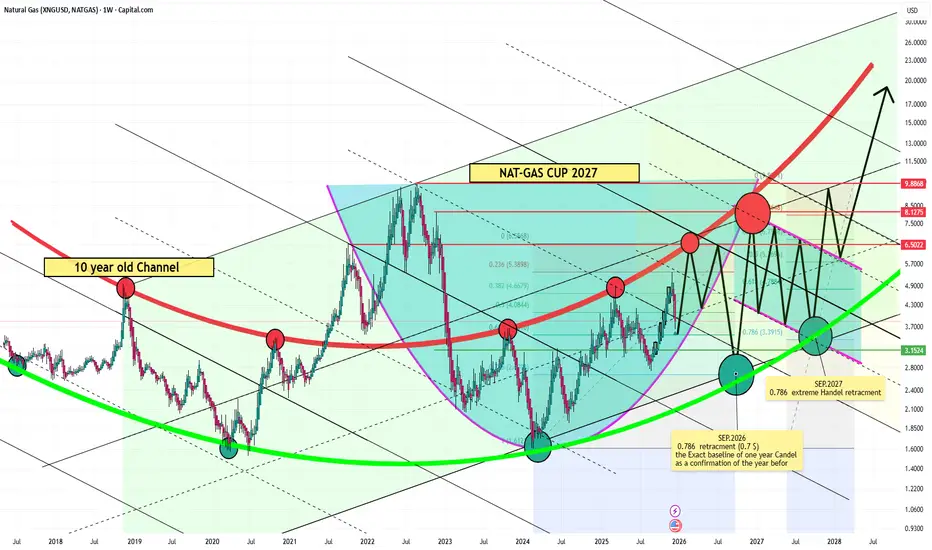
Commodities

A 10 Year Old Structural Roadmap to the 2027 BreakoutExecutive Market Thesis: Structural Regime Shift & Multi-Year Cycle Alignment
The market is completing a transition from a multi-year consolidation regime into a confirmed bullish expansion phase. This conclusion is derived from the confluence of long-term structural integrity, institutional footprint analysis, and precise technical invalidation levels.
1. Primary Trend Confirmation & Structural Validation
A decade-long series of higher lows has established a durable demand baseline, confirming sustained institutional accumulation and validating the underlying long-term bullish trend structure. This is not a speculative rally, but the maturation of a prolonged re-accumulation cycle.
2. High-Confluence Inflection Zone
The current breakout originates from a high-confluence technical node: the intersection of a long-term descending channel resistance with key Fibonacci extension clusters. This zone represents a clear inflection point, denoting a confirmed shift in market control from supply to demand.
3. Fibonacci Validation of the Accumulation Base
Deep Fibonacci retracement levels (notably the 0.618 and 0.786) have held across multiple cycle tests. This price action confirms the existence of a robust institutional accumulation base, providing a structurally sound foundation for the next expansion phase.
4. Critical Threshold: The 2026 Annual Candle
The 2026 annual candle close relative to the 2025 baseline is paramount. It serves as the primary structural confirmatory signal. A decisive weekly close below this level would invalidate the bullish structure, likely triggering an accelerated downward move as major distribution cycles align. The 0.786 Fibonacci retracement level is the key technical level to monitor for this potential breakdown.
5. Institutional Footprint at the Cycle Low
Volume-profile analysis and price action at the "cup" formation low exhibit classic institutional accumulation signatures—characterized by elevated volume on absorption, not distribution. This indicates "smart money" positioning ahead of the public trend transition.
6. Forward Projection: The 2027 Handle & Breakout Thesis
2027 is projected to finalize the multi-year "handle" formation—a period of controlled consolidation designed to:
Absorb residual overhang from late-cycle entrants.
Allow for the distribution of trapped supply.
Enable institutional conviction to build beneath the surface.
7. Strategic Entry Zone: Q3-Q4 2027
SEP 2027, concurrent with the 0.786 Fibonacci retracement level, is identified as the final strategic accumulation zone before the anticipated structural breakout. This level represents the last high-probability, high-reward entry point for aligning with the new cycle.
8. Anticipated Resolution: The 2027 Expansion Trigger
A decisive weekly close above the multi-year consolidation range in late 2027 is expected to signal the exhaustion of available supply and full institutional demand dominance. This event should catalyze the next validated expansion phase, marking the beginning of a clear, momentum-driven leg in the broader cycle.
Risk Management Note: The thesis is invalidated by a sustained loss of the 2026 annual baseline (monitored via weekly closes). The 0.786 Fib serves as the final defensive line for long-term positioning.
Gold Pushing Higher? Key Levels in SightThis chart shows gold steadily climbing along an upward curve, with momentum picking up after a rounded-bottom pattern. Price is now heading toward two marked targets around 4333 and 4379, suggesting the bullish trend may still have room to grow. (Not financial advice.)
Do you think gold can break above the first target zone, or will it pull back before moving higher?

USOIL What Next? SELL!
My dear friends,
Please, find my technical outlook for USOIL below:
The instrument tests an important psychological level 56.53
Bias - Bearish
Technical Indicators: Supper Trend gives a precise Bearish signal, while Pivot Point HL predicts price changes and potential reversals in the market.
Target - 56.17
Recommended Stop Loss - 56.74
About Used Indicators:
Super-trend indicator is more useful in trending markets where there are clear uptrends and downtrends in price.
Disclosure: I am part of Trade Nation's Influencer program and receive a monthly fee for using their TradingView charts in my analysis.
———————————
WISH YOU ALL LUCK

SILVER Set To Fall! SELL!
My dear subscribers,
My technical analysis for SILVER is below:
The price is coiling around a solid key level - 67.212
Bias - Bearish
Technical Indicators: Pivot Points Low anticipates a potential price reversal.
Super trend shows a clear sell, giving a perfect indicators' convergence.
Goal - 66.355
My Stop Loss - 67.771
About Used Indicators:
By the very nature of the supertrend indicator, it offers firm support and resistance levels for traders to enter and exit trades. Additionally, it also provides signals for setting stop losses
Disclosure: I am part of Trade Nation's Influencer program and receive a monthly fee for using their TradingView charts in my analysis.
———————————
WISH YOU ALL LUCK

XAUUSD H4 – Medium-Term Outlook for the Coming Week
Gold remains within a broad rising channel, but recent price action shows clear rejection at the upper trendline. For the week ahead, the focus is on a potential technical pullback, while keeping an alternative bullish scenario if the market fully accepts higher prices.
PRIORITY SCENARIO – MAIN SCENARIO
Wait for structural confirmation to sell the medium-term corrective move
Key confirmation level: a break of the trendline around 4317
Trade idea: look for confirmation below 4317 to sell the corrective leg within the rising channel
Technical context: price is trading near the upper boundary of the channel and showing rejection, a common setup before a rotation back toward lower value areas
Position management:
Sell positions should be treated strictly as corrective trades within a broader uptrend.
If price fails to stay below 4317 and regains bullish structure, risk should be reduced and short positions avoided.
ALTERNATIVE SCENARIO – SECONDARY SCENARIO
Trend continuation if price breaks to new highs and finds acceptance
Trigger condition: a clean breakout to new highs with sustained bullish momentum
Trade idea: prioritise buy setups once the market clearly accepts higher prices
Technical context: successful breakouts often lead to range expansion, making short positions unfavourable
KEY MEDIUM-TERM BUY ZONE
Liquidity-based opportunity in the event of a deeper pullback
Reference buy zone: around 4220
Rationale: this area represents a major liquidity cluster and a logical zone to monitor for bullish reactions during a deeper year-end pullback
KEY TECHNICAL REASONS
The dominant H4 trend remains bullish, but rejection at the upper channel increases the probability of a technical correction
The 4317 level acts as a key decision point to distinguish between a genuine pullback and temporary consolidation
The 4220 area serves as a value zone aligned with liquidity for potential trend-following buys
MACRO AND NEWS CONTEXT
Recent comments have reinforced expectations of future rate cuts to address labour market risks, which remains supportive for gold in the broader context.
Geopolitical developments, including discussions around the next steps in the Gaza peace process, continue to underpin safe-haven demand.
However, year-end holiday conditions often result in thinner liquidity, wider spreads, and less reliable price moves, making discipline and risk control essential.
RISK MANAGEMENT AND WEEKLY PLAN
Avoid chasing long positions near the upper trendline of the rising channel.
Only consider short positions after clear confirmation below 4317, avoiding emotional top-picking in a bullish market.
If price breaks and holds above recent highs, shift focus back to trend-following buy setups.
Reduce position size during the holiday week and prioritise trades around well-defined key levels rather than extended moves.

Gold (4H) — Supply is holding… for nowContext
On the left of the chart, Gold reached the higher-timeframe C target .
That was a valid place for sellers to take control — and they didn’t.
Price absorbed selling pressure and kept moving.
Now we’re at a different level.
The red zone is the all-time-high supply.
Sellers are active here. Price is being held.
That part matters and shouldn’t be ignored.
What formed under supply
Instead of a dump, price built structure:
A clear base
Liquidity sweep
MSS
A fresh ABC sequence
B held.
B broke A.
That tells me buyers are still participating, even with supply overhead.
Expectation
I’m not expecting an immediate breakout.
What makes sense here is a pullback first.
A revisit into the continuation breaker , clearing inducement and resetting positioning.
If that zone holds and price flips back up, then a break of supply opens the path toward C .
If the structure fails, I step aside.
No forcing it.
Watching how price behaves — not guessing the outcome.
SmellyTaz — decoding chaos.
Not financial advice. Shared for educational purposes only.

GOLD Is Going Down! Sell!
Here is our detailed technical review for GOLD.
Time Frame: 1D
Current Trend: Bearish
Sentiment: Overbought (based on 7-period RSI)
Forecast: Bearish
The market is trading around a solid horizontal structure 4,340.66.
The above observations make me that the market will inevitably achieve 4,164.19 level.
P.S
We determine oversold/overbought condition with RSI indicator.
When it drops below 30 - the market is considered to be oversold.
When it bounces above 70 - the market is considered to be overbought.
Like and subscribe and comment my ideas if you enjoy them!

USOIL SELLERS WILL DOMINATE THE MARKET|SHORT
USOIL SIGNAL
Trade Direction: short
Entry Level: 56.54
Target Level: 55.07
Stop Loss: 57.51
RISK PROFILE
Risk level: medium
Suggested risk: 1%
Timeframe: 4h
Disclosure: I am part of Trade Nation's Influencer program and receive a monthly fee for using their TradingView charts in my analysis.
✅LIKE AND COMMENT MY IDEAS✅

Gold vs Real Estate: Which Is Safer?Gold vs Real Estate: Which One Truly Keeps Your Money Safe in Uncertain Times?
When markets turn unstable, the first question that always comes up is: “ How do I keep my money safe ?”
Almost immediately, two familiar names are put on the scale: gold and real estate .
One is a globally recognized defensive asset.
The other is a tangible asset tied to land and long-term growth cycles.
But safety does not lie in the name of the asset — it lies in how you use it .
Safety does not mean “never going down”
Many people mistakenly believe that a safe asset is one that never declines in price. In reality, every asset goes through corrections .
True safety means:
When you need cash, can you actually convert it?
When markets deteriorate, can you withstand the psychological and cash-flow pressure?
When the cycle shifts, does that asset help you survive?
And this is exactly where gold and real estate begin to diverge.
Gold — safety through liquidity and defense
Gold is considered safe because it does not depend on a single economy . When inflation rises, crises emerge, or confidence in fiat currencies weakens, gold is often chosen as a safe haven.
Gold’s greatest strength is liquidity . It can be converted into cash almost instantly, nearly anywhere in the world. This makes gold an effective defensive tool during periods of strong market volatility.
However, gold does not generate cash flow . Its price can also move sideways for long periods, requiring patience and a capital-preservation mindset rather than a get-rich-quick mentality.
Real estate — safety through tangibility and long-term value
Real estate feels safe because it is tangible and familiar . The land remains. The property remains. Over the long term, real estate tends to appreciate alongside economic growth and urbanization.
In addition, real estate can generate rental income , something gold cannot offer. For investors with stable capital and no pressure to rotate funds quickly, this is a major advantage.
The trade-off, however, is low liquidity . When markets weaken or credit conditions tighten, selling property can take a long time. If leverage is involved, this so-called “safe asset” can quickly become a financial burden.
The core difference: time horizon and flexibility
Gold suits investors who value flexibility and fast response .
Real estate suits those with long-term vision, substantial capital, and the ability to endure cycles .
Gold helps you defend in the short to medium term .
Real estate helps you build wealth over the long term .
No asset replaces the other.
They differ only in their role within your financial strategy .

Gold 1H – CPI Data Uncertainty Fuels Liquidity Traps at Extremes🟡 XAUUSD – Intraday Smart Money Plan | by Ryan_TitanTrader (19/12)
📈 Market Context
Gold is trading in a tightly engineered range as markets digest the latest U.S. CPI print, which has drawn caution from economists over data reliability and seasonal distortions.
Despite headline inflation showing signs of cooling, analysts warn the data lacks clarity, keeping the Fed firmly data-dependent and USD flows unstable.
This uncertainty-driven backdrop favors liquidity manipulation over clean trends, with Smart Money likely probing both premium and discount zones to trigger stops before committing to expansion.
🔎 Technical Framework – Smart Money Structure (1H)
Current Phase: Rising structure losing momentum near premium supply
Key Idea: Expect liquidity interaction at 4363–4365 (premium) or 4300–4298 (discount) before displacement
Structural Notes:
• Higher-timeframe bullish BOS remains valid but is pausing
• Multiple rejections near highs suggest distribution, not confirmed reversal
• Equal highs above 4360 and sell-side liquidity below 4300 are exposed
• Price is rotating inside a controlled liquidity channel
Liquidity Zones & Triggers:
• 🔴 SELL GOLD 4363 – 4365 | SL 4370
• 🟢 BUY GOLD 4300 – 4298 | SL 4290
Institutional Flow Expectation:
liquidity sweep → MSS / CHoCH → BOS → displacement → FVG / OB retest → expansion
🎯 Execution Rules (matching your exact zones)
🔴 SELL GOLD 4363 – 4365 | SL 4370
Rules:
✔ Sweep above recent equal highs into premium
✔ Bearish MSS / CHoCH on M5–M15
✔ Clear downside BOS with impulsive displacement
✔ Entry via bearish FVG refill or refined supply OB
Targets:
1. 4340
2. 4320
3. 4302 – extension if USD firms post-CPI reassessment
🟢 BUY GOLD 4300 – 4298 | SL 4290
Rules:
✔ Liquidity grab below sell-side lows / channel support
✔ Bullish MSS / CHoCH confirms demand control
✔ Upside BOS with strong bullish displacement
✔ Entry via bullish FVG fill or demand OB retest
Targets:
1. 4325
2. 4350
3. 4380 – extension if CPI skepticism weakens USD
⚠️ Risk Notes
• CPI-related uncertainty increases fake breaks — wait for structure
• No entry without MSS + BOS confirmation
• Expect volatility during U.S. session
• Reduce risk near unscheduled Fed or inflation commentary
📍 Summary
Today’s gold setup is driven by CPI-driven uncertainty and Fed caution, creating prime conditions for liquidity engineering:
• A sweep above 4365 may fade toward 4300–4320
or
• A liquidity grab near 4300 could reload bullish flow toward 4350+
Let structure confirm — Smart Money reacts, retail anticipates. ⚡️
📌 Follow @Ryan_TitanTrader for daily Smart Money gold breakdowns.

Gold 4H – Is 4315 the Smart Money Reload Before 4400?🟡 XAUUSD – Weekly Smart Money Concept Plan
📈 Market Context
Gold starts the new week holding a clear 4H bullish market structure after a decisive BOS from the prior consolidation range. Price is now respecting a rising bullish trendline while consolidating beneath recent highs, suggesting controlled accumulation rather than distribution.
With USD-sensitive headlines and U.S. macro events ahead, Smart Money is likely to engineer a pullback into a discounted zone to rebalance positions before attempting another expansion leg. This environment favors patience and precision, not chasing breakouts.
🔎 Technical Analysis (4H / SMC View)
🟢 Buy Zone: 4316 – 4314
SL: 4306
TP Targets: 4350 → 4380 → 4420+
Rationale:
• Discounted pullback within a strong 4H bullish structure
• Confluence with rising bullish trendline support
• Prior consolidation high acting as demand flip
• Sell-side liquidity resting below 4310 likely to be swept
• High R:R alignment for trend-continuation longs
🔴 Sell Scenario (Conditional):
Only considered if a 4H bearish CHoCH forms below 4306 after a liquidity sweep. Otherwise, shorts are counter-trend and low probability.
⚠️ Risk Management Notes
• Execute only after M15–M30 ChoCH/BOS confirmation — no blind buys.
• Expect stop-hunts and fake breakdowns near London & New York opens.
• Scale out partials at each TP; trail runners only after structure confirms.
• Reduce risk exposure ahead of high-impact USD or Fed-related news.
Summary
Gold remains structurally bullish on the 4H timeframe. The 4316–4314 zone represents a Smart Money reload area where liquidity is likely to be swept before continuation higher.
Patience is the edge this week — let price come to value, let structure confirm, then execute with discipline.
Liquidity leads. Structure confirms. Entries follow.
🚀 Follow @Ryan_TitanTrader for more weekly SMC breakdowns

You Don’t Lose by Being Wrong — You Lose by OveranalyzingYour problem isn’t that you don’t understand the market.
In fact, most losing traders understand the market fairly well. They know what a trend is, where key levels sit, and which side the structure is leaning toward. But when it’s time to make a decision, they sabotage that edge with something very familiar: just a little more analysis.
At first, everything is clear. The chart tells a simple story.
Then doubt creeps in. You zoom into another timeframe. Add another zone. Add another tool. Not because the market demands it, but because you’re not ready to accept the risk of a decision. And with every extra layer of analysis, you don’t gain more certainty — you create another narrative.
This is the key point many traders miss:
the market hasn’t changed — the story in your head has.
When you overanalyze, you’re no longer reading the market; you’re negotiating with yourself. One timeframe says buy, another says wait. One level looks valid, another suddenly looks dangerous. In the end, you’re no longer searching for a good opportunity — you’re searching for reasons to delay or reverse a decision. And by the time you enter, you’re either late or lacking conviction.
Overanalysis also destroys your sense of informational weight.
On a chart, not all data carries equal value. A price level in the right context is worth more than ten minor signals. But when everything is marked, everything looks “important,” and you lose sight of what’s actually worth risking money on. The market needs prioritization, not enumeration.
Here’s an uncomfortable truth:
Many traders overanalyze not because they’re curious, but because they’re afraid to commit. They fear being wrong, so they look for more confirmation. But the market doesn’t reward the trader with the most confirmations. It rewards the trader who accepts risk at the right location. Every time you delay a decision through analysis, you move yourself further away from that location.
I only started trading better when I realized this:
analysis is not meant to make decisions certain — it’s meant to make them reasonable.
Beyond that point, what matters is discipline and acceptance of outcomes. The market doesn’t require you to be right 100% of the time. It only requires that you don’t break your own structure.
If you often find yourself “right on direction but wrong on results,” try cutting back on analysis. Not to oversimplify the market, but to clarify what truly matters. When the picture is already clear, adding detail doesn’t make it better — it just makes you hesitate.
And in trading, hesitation is often more expensive than being wrong.

USO - In Symmetrical triangle consolidation since 2022USO - In Symmetrical triangle consolidation since 2022.
Has broken out of a prior decade long term downtrend.
After such a long period of three years in consolidation, next move likely to be steep, and volatility will likely pick up.

LNG Week 51: 185 BCF Draw – Winter Demand Outpaces Supply*Due to the platform's features, the charts are arranged in sequence from left to right, from the first to the ninth chart. The charts were created by our team and based on an analysis from Bloomberg and the EIA data. This analysis was conducted in cooperation with Anastasia Volkova, analyst of LSE.
Current prices compared to price dispersion 10 days before expiration by month since 2010
The US natural gas market in December 2025 is characterized by high volatility: prices initially rose sharply due to cold weather at the beginning of the month, reaching a three-year high, but then fell amid milder weather forecasts for the end of December. The main factors are heating demand, inventories, record LNG exports, and stable production.
Forward curve compared to 2020-2025
The shape of the 2025 forward curve on nearby contracts is moving even closer to the 2023–2024 ranges. Despite high volatility on nearby contracts, contracts with delivery in two years and beyond continue to show clear price stabilization at historically stable levels.
Current stocks and forecast for next week compared to 2020-2024
According to the forecast for week 50 (EIA report, December 12), a second consecutive significant withdrawal is expected. Gas stocks in underground storage facilities will decrease by a record -185 BCF, which is significantly lower than the average for the past 5 years by 125 BCF. At the same time, stock levels will reach 3560 BCF, which is 74 BCF lower than the 2024 level and 28 BCF lower than the 5-year average.
HDD+CDD based on current NOAA data and forecast for the next two weeks compared to 1994-2024
Currently, the total HDD + CDD (heating and cooling degree days) indicators for all climatic regions of the United States are declining after peaking on December 15-16. According to meteorological model forecasts, the weather in the next two weeks will be within the average and moderately warm ranges of the 30-year climate norm.
HDD+CDD based on current NOAA data and forecast compared to 1994-2024 by region
As of December 17, no significant increase in the number of degree days is expected in the coming week across regions.
Daily supply/demand difference compared to 2014-2024
On December 17, the difference between supply and demand in 2025 declines after abnormal growth and approaches the upper interquartile range for 2014–2024.
Number of days for delivery from warehouses
The graph shows the number of days of supply from storage alone, based on current consumption levels. As of December 17, reserves are sufficient for ≈26 days, which is 5 days less than in 2024, 7 days below the average, and in the lower minimum range for the past 10 years. With this level of reserves and consumption, even minor disruptions in production or spikes in demand could cause strong price reactions, especially in late winter and early spring.
Filling level of European storage facilities
The overall fill rate of European gas storage facilities continued to decline on December 17, reaching 68.8% (-2.7% over the week), which is 9.9% below the average fill rate and 8.7% lower than last year.
Electricity generation by source
Compared to last week, gas generation in the US48 energy balance on December 17, 2025 fell to an average of 38.5% of the total, the share of nuclear generation fell below a 5-year low to 18%, and the share of coal generation remained at an average of 19.3%. The share of wind (12.6%) and solar (3.9%) remained virtually unchanged compared to last week.

SILVER: Still Bullish! Buy The Dip!In this Weekly Market Forecast, we will analyze the XAGUSD (SILVER) for the week of Dec. 15 - 19th.
Silver .... still strong! With a weakened USD due to an interest rate cut by the Fed, there are no headwinds to offer resistance.
Be mindful that this market is overextended, and a pullback is pending.
There is a +FVG to draw price to it below. That would make a great area to look for dip buying opportunities.
Enjoy!
May profits be upon you.
Leave any questions or comments in the comment section.
I appreciate any feedback from my viewers!
Like and/or subscribe if you want more accurate analysis.
Thank you so much!
Disclaimer:
I do not provide personal investment advice and I am not a qualified licensed investment advisor.
All information found here, including any ideas, opinions, views, predictions, forecasts, commentaries, suggestions, expressed or implied herein, are for informational, entertainment or educational purposes only and should not be construed as personal investment advice. While the information provided is believed to be accurate, it may include errors or inaccuracies.
I will not and cannot be held liable for any actions you take as a result of anything you read here.
Conduct your own due diligence, or consult a licensed financial advisor or broker before making any and all investment decisions. Any investments, trades, speculations, or decisions made on the basis of any information found on this channel, expressed or implied herein, are committed at your own risk, financial or otherwise.

Swing/Posistiong Idea On Coffee(KC1!)Based on :
- Supply zone and VP Key levels
- Seasonality
- overbought conditions
- AVWAP and VP as potential targets

Gold updatesGold is in a strong bullish trend, and 4380.990 is a short-term target that price is likely to reach.
Key buy support levels:
• 4334.020
• 4284.440
• 4244.595
Buying on pullbacks from these support zones is preferred while the bullish structure remains intact.

UUUU expecting more downside As long as price remains within the 24–26 local zone, the odds, in my view, favor a continuation lower in the coming weeks — first toward the 16–14 area and potentially later toward 12.
Chart:
Weekly view:
Previously:
• On upside potential (Jul 16):
Link: www.tradingview.com
• On bullish trend structure (Jun 6):
Link: www.tradingview.com
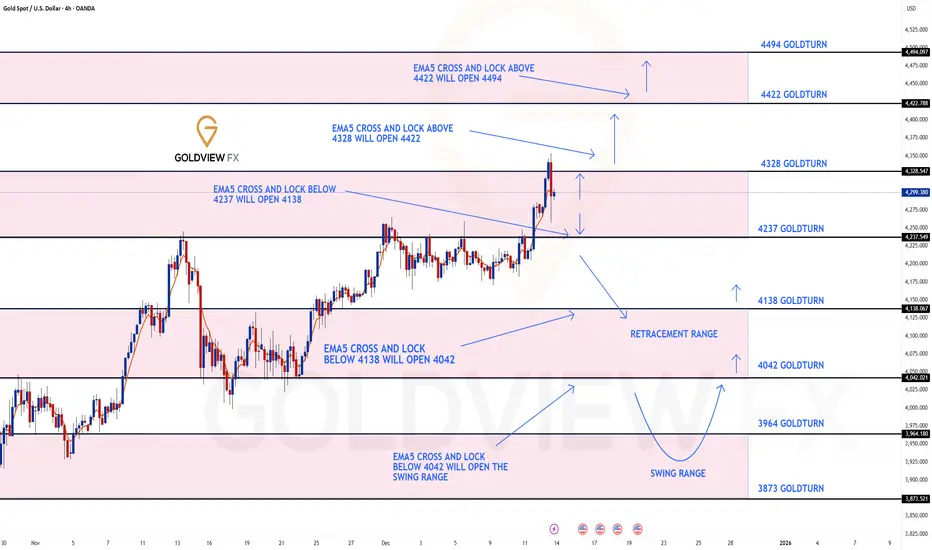
GOLD 4H CHART ROUTE MAP UPDATE & TRADING PLAN FOR THE WEEKHey Everyone,
Please see our 4h chart route map and trading plan for the week ahead.
We are now seeing price play between two weighted levels with a gap above at 4328 and a gap below at 4237. We will need to see ema5 cross and lock on either weighted level to determine the next range.
We will see levels tested side by side until one of the weighted levels break and lock to confirm direction for the next range.
We will keep the above in mind when taking buys from dips. Our updated levels and weighted levels will allow us to track the movement down and then catch bounces up.
We will continue to buy dips using our support levels taking 20 to 40 pips. As stated before each of our level structures give 20 to 40 pip bounces, which is enough for a nice entry and exit. If you back test the levels we shared every week for the past 24 months, you can see how effectively they were used to trade with or against short/mid term swings and trends.
The swing range give bigger bounces then our weighted levels that's the difference between weighted levels and swing ranges.
BULLISH TARGET
4328
EMA5 CROSS AND LOCK ABOVE 4328 WILL OPEN THE FOLLOWING BULLISH TARGET
4422
EMA5 CROSS AND LOCK ABOVE 4422 WILL OPEN THE FOLLOWING BULLISH TARGET
4422
EMA5 CROSS AND LOCK ABOVE 4422 WILL OPEN THE FOLLOWING BULLISH TARGET
4494
BEARISH TARGETS
4237
EMA5 CROSS AND LOCK BELOW 4237 WILL OPEN THE FOLLOWING BEARISH TARGET
4138
EMA5 CROSS AND LOCK BELOW 4138 WILL OPEN THE FOLLOWING BEARISH TARGET
4042
EMA5 CROSS AND LOCK BELOW 4042 WILL OPEN THE SWING RANGE
3964
3873
As always, we will keep you all updated with regular updates throughout the week and how we manage the active ideas and setups. Thank you all for your likes, comments and follows, we really appreciate it!
Mr Gold
GoldViewFX
XAUUSD BUY SETUPGOLD — Trade Setup
📈 Bias: Bullish
🎯 Entry: 4315 / 4325
🛑 Stop Loss: 4305
🎯 Target: 4355
📊 Technical Reasoning:
Gold is maintaining bullish momentum after holding above a key support zone. The entry area is positioned where buyers are expected to defend price and continue the move higher. The stop loss is placed beyond the invalidation level to manage downside risk, while the target is aligned with a higher liquidity objective and continuation structure.
📌 Execution Plan:
* Buy from the marked entry zone
* Apply disciplined risk management
* Monitor price behavior as it approaches the target
❌ Invalidation:
A clear break and close below 4305 would invalidate this bullish setup.
💬 Do you expect continuation toward 4355, or consolidation before the next leg up?
⚠️ This analysis is for educational purposes only. Not financial advice.

XAUUSD H1 | Bullish Continuation Off Pullback SupportMomentum: Bullish
Price is currently above the ichimoku cloud, and there is an ascending trendline present.
Buy entry: 4,343.93
- Pullback support
- 50% Fib retracement
Stop Loss: 4,315.21
- Multi-swing low support
Take Profit: 4,379.34
- Multi-swing high resistance
- 100% Fib projection
High Risk Investment Warning
Stratos Markets Limited (tradu.com/uk ), Stratos Europe Ltd (tradu.com/eu ):
CFDs are complex instruments and come with a high risk of losing money rapidly due to leverage. 70% of retail investor accounts lose money when trading CFDs with this provider. You should consider whether you understand how CFDs work and whether you can afford to take the high risk of losing your money.
Stratos Global LLC (tradu.com/en ): Losses can exceed deposits.
Please be advised that the information presented on TradingView is provided to Tradu (‘Company’, ‘we’) by a third-party provider (‘TFA Global Pte Ltd’). Please be reminded that you are solely responsible for the trading decisions on your account. Any information and/or content is intended entirely for research, educational and informational purposes only and does not constitute investment or consultation advice or investment strategy. The information is not tailored to the investment needs of any specific person and therefore does not involve a consideration of any of the investment objectives, financial situation or needs of any viewer that may receive it. Past performance is not a reliable indicator of future results. Actual results may differ materially from those anticipated in forward-looking or past performance statements. We assume no liability as to the accuracy or completeness of any of the information and/or content provided herein and the Company cannot be held responsible for any omission, mistake nor for any loss or damage including without limitation to any loss of profit which may arise from reliance on any information supplied by TFA Global Pte Ltd.

BTCUSD (2H) – chart patternBTCUSD (2H) – chart pattern
Based on the chart my shared (trendline breakdown + weak structure):
📉 Bearish Targets
TP1: 84,500
TP2: 82,000
Main Target: 79,000 – 79,500 ✅ (marked target zone)
🛑 Invalidation / SL
SL: Above 90,000 (trendline + structure reclaim)
