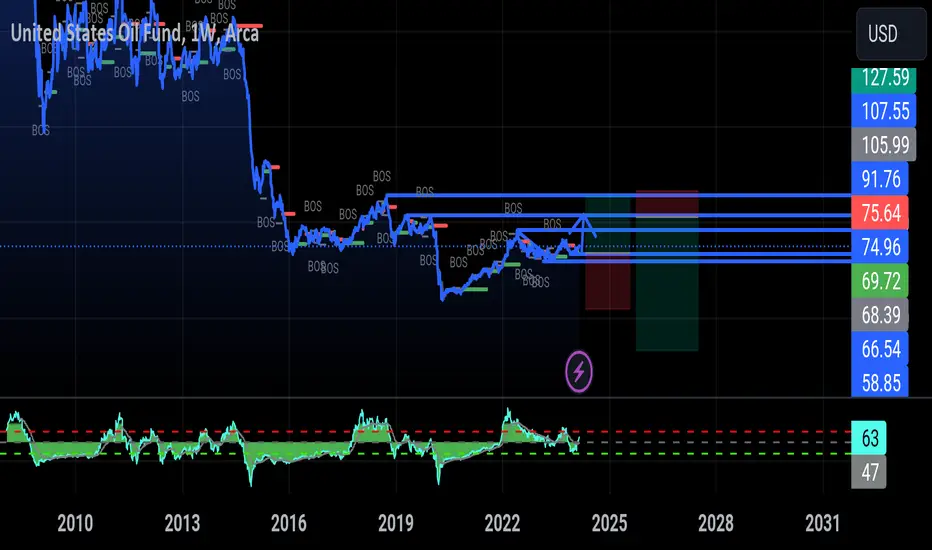
USO is in a sweet spot on its chart LONGUSO while the middle east, the Houthi rebels and the Suez Canal shipping quagmire affect
oil liquidity globally and prices at the pump continue to be volatile the federal government
seeks contracts to restore the national strategic reserves depleted in the last supply demand
challenge while the
Key stats
About United States Oil Fund
Expense ratio
0.60%
Home page
Inception date
Apr 10, 2006
USO delivers its exposure to oil using near-term futures. USO gets exposure to oil using derivatives, like several oil ETPs. The fund predominately holds near-month-futures contracts on WTI, rolling into future contracts every month. This method is particularly sensitive to short-term changes in spot prices. USO held front month contracts until April 17, 2020, at which time following leeway in the prospectus, USO changed the exposure from holding specifically front-month contracts to holding predominantly front-month contracts, 30% next month and 15% contracts with further expiry. USO is structured as a commodities pool, so expect a K-1 at tax time. Long-term holders will be taxed on any gains even if they didn't sell shares.
Classification
What's in the fund
Exposure type
Cash
Futures
Bonds, Cash & Other100.00%
Cash54.74%
Futures45.02%
Miscellaneous0.24%

USO - Oil Prices are Rising LONGUSO follows the futures prices of oil barrels. On this 30 minute chart, price falls have been
rejected by the POC line of the volume profile and the Lux Algo Donchian channel has
transitioned from downgoing to trending up. The dual TF RSI of Chris Moody now shows
RSI holding above 50 in both th

USO / UCO a play on barrel oil shock LONGUCO is shown here as a one month trend - It is sitting on the rising support tendline about
2% below the recent high. Oil prices contribute to inflation. Anyone in the USA is aware of
gasoline prices at the pump. Geopolitics plays into price. At present, US Navy warships are
consuming refined o

$USO Oil targets hit. Sideways plus downside, maybe two weeks Breakout was a success and we saw $80s for a good moment there. Plenty of time to have taken any profit on any positions I had. The pullback in between also happened according to the bar chart. Let’s see if the rest of my pattern can make its way through into a plummet for late May.

$USO Small pullback into wedge, then breakout possible. $88 🎯Continued from previous post. Breakout possible. Wait for pullback into the wedge. Stop on Calls would be below the Box. 4/19 $70 call could pay well if the breakout occurs.

$USO August 23' Rally similar to today's PACompare said time frames and you will see the similarities in RSI and MACD although if it fails, new lows could be on the way. If a B/O occurs , look for $100 sooner than later. Will revisit later. I will attach the next post to this one for continued reference.


Opening (IRA): USO April 19th 66 Monied Covered Call... for a 64.51 debit.
Comments: IV of 32.3%.
Selling the -75 call against a one lot of stock to emulate a 25 delta short put with built-in short call defense.
Metrics:
Cost Basis in Stock/Break Even/BPE: 64.51/share
Max Profit: 1.49
ROC at Max: 2.31%
ROC at 50% max: 1.15%

US Oil trading planFirst of all before I follow the trend I check what kind of trend is this, soo that is gonna be easy for me to get into position, US Oil is a down trend market however a down trend market does goo up n down, soo there is a short buy to 91 n 105 coming weeks before another leg down, before you can an

See all ideas