GOLD 1H CHART ROUTE MAP UPDATE & TRADING PLAN FOR THE WEEKHey Everyone,
Please see our 1h chart levels and targets for the coming week.
We are seeing price play between two weighted levels with a gap above at 4306 and a gap below at 4270, as support. We will need to see ema5 cross and lock on either weighted level to determine the next range.
We will see levels tested side by side until one of the weighted levels break and lock to confirm direction for the next range.
We will keep the above in mind when taking buys from dips. Our updated levels and weighted levels will allow us to track the movement down and then catch bounces up.
We will continue to buy dips using our support levels taking 20 to 40 pips. As stated before each of our level structures give 20 to 40 pip bounces, which is enough for a nice entry and exit. If you back test the levels we shared every week for the past 24 months, you can see how effectively they were used to trade with or against short/mid term swings and trends.
The swing range give bigger bounces then our weighted levels that's the difference between weighted levels and swing ranges.
BULLISH TARGET
4306
EMA5 CROSS AND LOCK ABOVE 4306 WILL OPEN THE FOLLOWING BULLISH TARGETS
4334
EMA5 CROSS AND LOCK ABOVE 4334 WILL OPEN THE FOLLOWING BULLISH TARGETS
4362
EMA5 CROSS AND LOCK ABOVE 4362 WILL OPEN THE FOLLOWING BULLISH TARGETS
4395
EMA5 CROSS AND LOCK ABOVE 4395 WILL OPEN THE FOLLOWING BULLISH TARGETS
4430
BEARISH TARGETS
4270
EMA5 CROSS AND LOCK BELOW 4270 WILL OPEN THE FOLLOWING BEARISH TARGET
4231
EMA5 CROSS AND LOCK BELOW 4231 WILL OPEN THE FOLLOWING BEARISH TARGET
4184
EMA5 CROSS AND LOCK BELOW 4184 WILL OPEN THE SWING RANGE
4150
4102
As always, we will keep you all updated with regular updates throughout the week and how we manage the active ideas and setups. Thank you all for your likes, comments and follows, we really appreciate it!
Mr Gold
GoldViewFX
Commodities

Continue to be bullish, 4380 is definitely not the high point#XAUUSD OANDA:XAUUSD TVC:GOLD
Yesterday, the gold market released a positive signal: after hitting a high, gold prices did not fall back quickly, but instead showed signs of continuing to rise and break through. This makes me even more convinced that real pressure doesn't offer repeated opportunities, repeated testing is often for the sake of a final breakthrough. Currently, we only need to wait for a valid breakout of the 4345-4355 range. Once this level is firmly established, the upside potential will be fully unlocked.
Currently, gold prices are hovering around 4333, providing room for both bulls and bears to battle. However, in my opinion, I still tend to be bullish. Firstly, although the area above 4345-4355 represents short-term resistance, repeated tests indicate that the resistance is limited and will eventually be broken. Secondly, the upward structure we have been optimistic about remains intact, and no reversal signals have been seen. Meanwhile, Tuesday's data has already increased expectations of an interest rate cut, and if tonight's CPI data is moderate, it will further strengthen that expectation.
Therefore, today's trading strategy remains focused on buying at lower levels, Short-term support is seen at 4325-4320, while key support remains at 4300-4290. Holding this level will lead to a full-scale counterattack by the bulls. In short, the market tends to be relatively calm before the release of big data, it's best to observe more and act less, only participating at key points

XAU/USD Intraday Plan | Gold Stalls Below Key ResistanceGold is once again stalling near the 4334 resistance. Price remains supported by both the MA50 and MA200, which are sloping upward, keeping the broader bullish structure intact.
A confirmed break and hold above 4334 would open the way toward 4362, with scope for 4395 if momentum strengthens. If this resistance continues to hold, price may rotate back into the reaction zone. Should selling pressure build and 4270 fail, attention shifts to the support zone for a potential bullish reaction.
📌Key levels to watch:
Resistance:
4334
4362
4395
Support:
4301
4270
4237
4185
🔎Fundamental focus:
All eyes are on U.S. CPI, the key risk event today. Expect heightened volatility around the release, with potential sharp moves in gold as markets react to inflation expectations. Manage risk accordingly.

Silver Bullish Structure into Supply, Pullback Targets MarkedThis 1H Silver (XAGUSD) chart highlights a well-defined bullish market structure with multiple BOS (Break of Structure) confirmations as price trends higher along a rising trendline. After a strong impulsive move, price enters a consolidation phase, then continues upward, respecting the dynamic trendline support.
Price is currently trading just below a clearly marked Supply Zone, signaling potential short-term exhaustion. The projection illustrates a possible corrective pullback from supply, with downside targets aligned at prior structure and liquidity levels.
1st target sits near the previous support (~63.37)
2nd target aligns deeper into the range (~61.17)
Below, a higher-timeframe Demand Zone is marked, representing a strong area of interest if deeper retracement occurs.
Overall, the chart presents a trend-continuation context with a tactical short-term pullback scenario from premium prices.

SILVER Strong Uptrend! Buy!
Hello,Traders!
SILVER is reacting from a higher-timeframe demand cluster aligned with the rising trendline. Sell-side liquidity has been swept, followed by strong bullish displacement, suggesting smart-money re-accumulation and a continuation toward the next liquidity pool above. Time Frame 4H.
Buy!
Comment and subscribe to help us grow!
Check out other forecasts below too!
Disclosure: I am part of Trade Nation's Influencer program and receive a monthly fee for using their TradingView charts in my analysis.

XAGUSDXAGUSD remains in a strong uptrend and has made a new high of $66.44. Short-term view: If the price fails to break through $67, we expect a potential downtrend. Consider selling in the red zone.
🔥Trading futures, forex, CFDs and stocks carries a risk of loss.
Please consider carefully whether such trading is suitable for you.
>>GooD Luck 😊
❤️ Like and subscribe to never miss a new idea!

EUR/USD | EURUSD Pullback From Supply, Buyers Step Back In!By analyzing the #EURUSD chart on the 6 hour timeframe, we can see that price moved up as expected and reached the supply zone between $1.178 and $1.182. As soon as price hit this key area, selling pressure appeared and EURUSD dropped to $1.17.
After reaching this level, buyers stepped in again and demand increased. Right now, #EURUSD is trading around $1.17330. I expect to first see another upward move, and then we should watch the price reaction again at the $1.178 to $1.182 supply zone.
THE LATEST TA on EURUSD :
Please support me with your likes and comments to motivate me to share more analysis with you and share your opinion about the possible trend of this chart with me !
Best Regards , Arman Shaban

GBP/USD | GBPUSD Hits Supply,Strong Drop Then Bounce From DemandBy analyzing the #GBPUSD chart on the 4 hour timeframe, we can see that price reacted exactly as expected to the supply zone and dropped more than 130 pips, reaching $1.3311. After hitting this key demand level, buyers stepped in and price bounced.
Right now, #GBPUSD is trading around $1.3348. I expect price to fill the large liquidity gap created by the sharp drop in the short term. Keep a close eye on price reaction around the marked FVG zone. This analysis will be updated.
The Last TA :
Please support me with your likes and comments to motivate me to share more analysis with you and share your opinion about the possible trend of this chart with me !
Best Regards , Arman Shaban

Gold (XAU/USD) Analysis: Strong Bullish Breakout Expected Soon!In this analysis, we're looking at gold on the 2-hour timeframe. Right now, gold is around $4336, and many people expect the price to get rejected (bounce down) from this level. But in my opinion, gold's momentum is much stronger than it appears, and I expect we'll soon see a powerful breakout above this level! If it breaks out, my upside targets are $4344, $4350, and $4366 in order. I'll post an update for this analysis soon!

GOLD Buyers In Panic! SELL!
My dear friends,
Please, find my technical outlook for GOLD below:
The price is coiling around a solid key level - 4341.0
Bias - Bearish
Technical Indicators: Pivot Points Low anticipates a potential price reversal.
Super trend shows a clearsell, giving a perfect indicators' convergence.
Goal - 4331.9
Safe Stop Loss - 4346.7
About Used Indicators:
The pivot point itself is simply the average of the high, low and closing prices from the previous trading day.
Disclosure: I am part of Trade Nation's Influencer program and receive a monthly fee for using their TradingView charts in my analysis.
———————————
WISH YOU ALL LUCK

XAUUSD: Market Analysis and Strategy for December 18thGold Technical Analysis:
Daily Resistance: 4382, Support: 4175
4-Hour Resistance: 4350, Support: 4290
1-Hour Resistance: 4338, Support: 4302
The 4-hour chart shows that although gold prices have experienced a slight pullback during the day, the overall technical pattern remains bullish: moving average support is gradually moving upwards. The Bollinger Bands are expanding, indicating increased volatility; the RSI indicator is running above the 50 midline, suggesting that bullish momentum has not been broken. If the bulls continue to exert force and effectively break through the upper Bollinger Band near $4350, gold prices are expected to challenge the historical high of $4380 again, and then launch an attack on the psychological level of $4400. Conversely, if the pullback continues and falls below $4290 (the low of December 17), it may trigger more stop-loss orders for bullish positions in the short term. Close attention should be paid to the support levels around $4270 and $4230. The key resistance level for the NY market is 4353-4366, while the support level is 4302-4285.
The short-term support/resistance level is 4302. My personal suggestion: prioritize buying on dips; selling is a secondary strategy.
Trading Strategy:
SELL: 4347~4340
BUY: 4305~4312
More Analysis →

Gold vs SPX500 - Metals will LEAD the 2026!The end of the year is a good time to figure out what might be trending next year. The XAUUSD / SPX500USD chart can serve us good in this task.
As you can see, Gold is ABSOLUTELY READY to outperform stocks in 2026! There is a clear Cup&Handle pattern formed on the chart. At the moment the index is breaking the 0.635 resistance and preparing for a massive ride in 2026.
XAUBTC chart also looks very bullish for Gold.
Gold is programmed to reach $5000 next year , while stocks & crypto look pretty... bad (ugly) .

GOLD | CPI Volatility Incoming — Watching 4314 & 4291GOLD (XAUUSD) | Short Technical Overview
Gold is currently trading around the 4314 pivot line, showing a consolidation pattern after failing to break the 4347 resistance zone.
The chart indicates two possible paths: a short bullish correction back toward 4340–4347, or a continuation of the bearish move toward the 4291 support if the pivot breaks.
Today’s U.S. CPI is expected to be released above 3.00%, which typically strengthens the USD and pressures Gold downward.
If CPI comes in higher, Gold may drop toward 4291, and a break below it could open the way toward deeper support levels.
Key Levels:
Pivot: 4314
Resistance: 4334 → 4347
Support: 4303 → 4291 → 4267

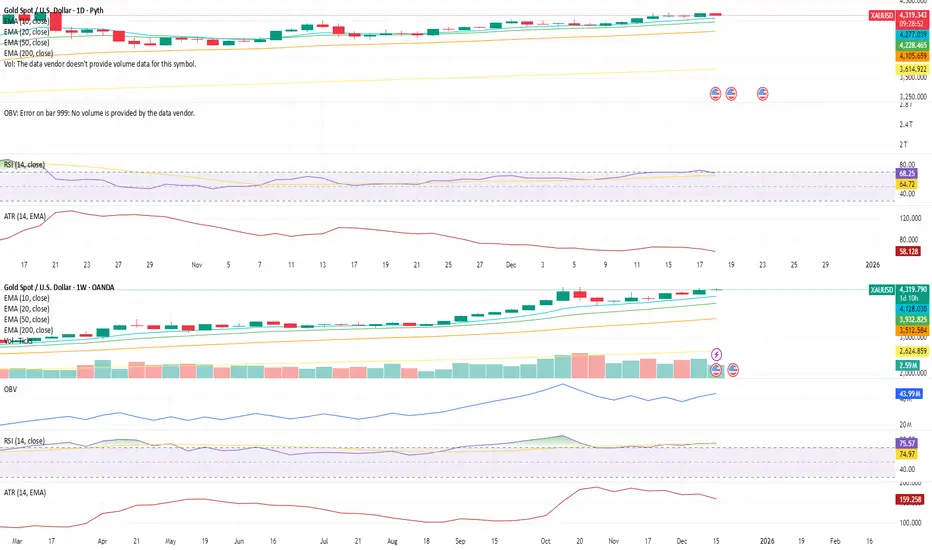
XAUUSD Structure Update — Daily & Weekly View1D Chart (Daily)
Gold continues to trade above all key EMAs, with the 10 EMA leading and holding steady, reinforcing short-term structural support rather than impulsive momentum.
RSI is taking a brief breather but remains elevated near 68, suggesting momentum is cooling in a controlled manner rather than breaking down.
ATR remains flat, indicating volatility is contained and price is progressing in an orderly fashion rather than expanding aggressively.
Due to the nature of spot gold volume, OBV on the daily timeframe is less informative, and participation signals are better assessed from the higher-timeframe structure.
Overall, the daily chart reflects consolidation within strength, not distribution.
1W Chart (Weekly)
The weekly structure continues to support the broader bullish framework.
Price remains above all major EMAs, with the 10 and 20 EMA rising steadily — not steep, but clearly directional — reinforcing sustainable trend progression rather than late-stage acceleration.
OBV trends higher on the weekly, signaling healthy participation and accumulation beneath the surface.
RSI holds near 75, elevated yet stable, indicating persistent strength without signs of exhaustion.
ATR remains flat, confirming that volatility remains controlled even as price holds elevated levels.
The weekly structure confirms that gold remains constructive and supported, with no technical evidence of breakdown.
⭐ Final Clarity Note ⭐
In structurally strong markets, consolidation often appears before continuation, not after failure.
When price holds above trend EMAs, volatility remains compressed, and participation persists on higher timeframes, it typically reflects positioning rather than speculation.
Gold’s current structure suggests the market is digesting gains, not abandoning them.
USOIL (WTI) | Moving Downtrend...USOIL | Technical Overview🕯
Bearish Setup:
USOIL continues to show bearish momentum as long as the price trades below 56.40 and 56.05, maintaining pressure toward the next target at 54.38.
Bullish Setup:
To shift into a bullish structure, the market must close a 4H candle above 56.40, which would support an upside move toward 57.40.
Key Levels
Pivot Zone: 56.00 – 56.40
Support: 55.00, 54.40
Resistance: 56.90, 57.40
Timeframe: 4H | Bias: Bearish Volatility | Current Price: 56.00
previous idea:

XAGUSD M30 | Bearish Reversal Off 50% Fib ResistanceMomentum: Bullish
Price is reacting off the sell entry, which aligns with the 50% Fibonacci retracement, adding significant confluence and strength to this level.
Sell entry: 62.66
Pullback resistance
50% Fibonacci retracement
Stop loss: 63.80
Pullback resistance
78.6% Fibonacci retracement
Take profit: 60.73
Pullback suport
High Risk Investment Warning
Stratos Markets Limited (tradu.com ), Stratos Europe Ltd (tradu.com ):
CFDs are complex instruments and come with a high risk of losing money rapidly due to leverage. 70% of retail investor accounts lose money when trading CFDs with this provider. You should consider whether you understand how CFDs work and whether you can afford to take the high risk of losing your money.
Stratos Global LLC (tradu.com ): Losses can exceed deposits.
Please be advised that the information presented on TradingView is provided to Tradu (‘Company’, ‘we’) by a third-party provider (‘TFA Global Pte Ltd’). Please be reminded that you are solely responsible for the trading decisions on your account. Any information and/or content is intended entirely for research, educational and informational purposes only and does not constitute investment or consultation advice or investment strategy. The information is not tailored to the investment needs of any specific person and therefore does not involve a consideration of any of the investment objectives, financial situation or needs of any viewer that may receive it. Past performance is not a reliable indicator of future results. Actual results may differ materially from those anticipated in forward-looking or past performance statements. We assume no liability as to the accuracy or completeness of any of the information and/or content provided herein and the Company cannot be held responsible for any omission, mistake nor for any loss or damage including without limitation to any loss of profit which may arise from reliance on any information supplied by TFA Global Pte Ltd.

XAU/USD | CPI incoming (READ THE CAPTION)As you can see in the 4H chart of Gold, it is consolidating between the Bearish OB and the 4H FVG, mostly because it is waiting for CPI to make a move.
There's a support level at 4317 to monitor, and there's a Buyside liquidity below 4306 and another one below 4300.
Monitor these zones and make sure NOT to set an order for CPI news, cause it will without a doubt hurt you.
Hope you have a good day folks.

Platinum (XPTUSD) Holds Trendline — CPI Is the CatalystSummary:
Platinum remains in a clean bullish structure, printing higher highs and higher lows while respecting a rising dynamic support zone. Price reaction near the trendline suggests continuation is possible, but CPI news could be the volatility trigger.
Chart Analysis:
🟢 Market Structure: Clear uptrend with consistent higher highs & higher lows — buyers remain in control.
📐 Dynamic Trendline: Price is reacting well around the rising channel, acting as a key decision zone.
🔁 Pullback Logic: Recent dip looks corrective, not impulsive, indicating healthy trend behavior.
📰 Fundamental Risk: CPI news ahead — expect expansion in volatility and a potential breakout or fakeout.
Takeaway (Simple Trader Language):
➡️ Bullish as long as price holds above the rising trendline.
⬇️ Bearish only if we get a clean break and close below the dynamic support.
Hashtags:
#Platinum #XPTUSD #Commodities #TradingView #MarketStructure #TrendTrading #CPI 📊🔥

Market always looking for liquidityUnpopular opinion. But people are still waiting on $135k from 2021.
Markets go up and they go down.
Here's some general info - regardless of up or down.
The basics...
The local Point of control.
The bigger picture.
Once price reaches an external liquidity pocket, it runs out of steam as it's overcrowded in terms of the asset and there's enough supply to fulfil the demand. Depending on up or down directions.
From there, the market looks to work a slower move to find internal liquidity - some will see this as a pullback or searching for an order block or imbalance. But the idea is to take eager players out and load up or sell off more for the bigger players.
The price here has a nice pocket of liquidity sat just under the local low.
The issue here is that there is a fair amount of buying liquidity down a lot lower, too. As you can see at roughly 60k.
Next, we have a good chance that the Bank of Japan will hike rates in the next 24-48 hours.
Anyway, be careful. It could be a thrill or it could be a deep slide before Xmas. Take it easy, be careful and happy Holidays to you!
Disclaimer
This idea does not constitute as financial advice. It is for educational purposes only, our principal trader has over 25 years' experience in stocks, ETF's, and Forex. Hence each trade setup might have different hold times, entry or exit conditions, and will vary from the post/idea shared here. You can use the information from this post to make your own trading plan for the instrument discussed. Trading carries a risk; a high percentage of retail traders lose money. Please keep this in mind when entering any trade. Stay safe.

#EURUSD , Risky Setup📌 Market Insight: {#EURUSD }
⚠️ Risk Assessment: {High}
🚀 Approach:
Not a Quality setup at all ... need VALID LTF entry sign first. ... shouldn't go to Edge and then back up .... QuickScalp setup
#Ash_TheTrader #Forex #GBPJPY #MarketAnalysis #TradingSetup #RiskManagement #GOLD #Scalper #NQ #EURUSD

XAUUSD Long: Trend Line Holds - Buyers Aim for $4,350Hello, traders! Gold (XAUUSD) is trading within a well-defined bullish structure, supported by an ascending channel that started from the pivot point near the trend line. After forming higher lows, price entered a consolidation Range, indicating temporary balance between buyers and sellers. This range acted as an accumulation phase before the next impulsive move.
Currently, a clean breakout above the Range high occurred around the 4,260 Demand Zone, confirming renewed buying pressure. This level is now acting as a key support area, aligned with the rising Trend Line, strengthening its importance. Following the breakout, price accelerated upward and is currently trading below the major 4,350 Supply Zone, where sellers have historically shown strong reactions. The recent pullback from the highs appears corrective, not impulsive, suggesting that buyers are still in control as long as price holds above the Demand Zone.
My scenario remains bullish while XAUUSD holds above the 4,260 Demand Zone and the rising Trend Line. If buyers continue to defend this area, I expect another push toward the 4,350 Supply, which remains the primary upside target. A confirmed breakout above 4,350 would open the path for further bullish continuation. However, a failure to hold the Demand Zone could trigger a deeper pullback toward the Trend Line, while still keeping the broader bullish structure intact. For now, the market favors buyers, with 4,260 as key support and 4,350 as the main resistance to watch. Manage your risk!

OIL analysisOIL has formed a butter fly harmonic pattern and it reacted and made positive reversal if it played well i think the target is 60$
Technical research and market hypotheses shared here are for educational purposes only. This content does not constitute financial advisory or a solicitation to trade. ⚖️

AUDUSD: potential medium-term reversal🛠 Technical Analysis: On the 4-hour timeframe, AUDUSD is forming a classic Head and Shoulders pattern, indicating a potential trend reversal from bullish to bearish. While a "Global bullish signal" remains on the chart, the price action has stalled, creating a defined "Neckline" support at 0.66200. The current accumulation at this support level suggests seller pressure is building. The trade setup relies strictly on a breakout confirmation: a candle close below 0.66200 would validate the pattern and trigger a sell-off towards the next major support zone at 0.64500.
———————————————
❗️ Trade Parameters (SELL)
———————————————
➡️ Entry Point: Sell only on a confirmed breakdown of support (approx. 0.66033 / below 0.66200)
🎯 Take Profit: 0.64523 (Support)
🔴 Stop Loss: Above the Right Shoulder (approx. 0.66786)
⚠️ Disclaimer: This is a potential trade idea based on current chart patterns; do not enter before the support level is broken, as the trend could still hold.
