Gold Uptrend Strengthens, New Expansion Phase BeginsOver the past week, gold has continued to advance in a very “textbook” manner. What stands out is not how far price has moved, but how it has moved: steady, controlled, and consistently supported by both technical structure and the macro backdrop. On the H4 chart, this is the type of bullish behavior traders like to see—impulse higher, shallow pullback, then continuation.
Gold started the week around the 4,370 USD/oz area, quickly reclaimed the 4,400 level, and more importantly, managed to hold above it for most of the week. Structurally, 4,400 is no longer acting as resistance; it has transitioned into a new support base, signaling that the market is accepting a higher price regime.
As price approached the 4,440–4,450 zone, profit-taking pressure emerged, leading to a brief pullback toward the 4,426 area. What I find particularly constructive is that this entire retracement did not damage the structure. Price never lost 4,400, and each dip was quickly absorbed by fresh buying interest. This behavior clearly reflects the current market state: buyers remain in control, while sellers are only strong enough to create short-term fluctuations, not a reversal.
By the end of the week, gold decisively broke above the psychological 4,500 USD/oz level and closed around 4,510. On the H4 timeframe, this was a relatively clean break-and-hold, suggesting the market is ready to operate at a higher range rather than merely staging a temporary breakout.
From a purely technical perspective, the uptrend remains firmly intact. Price continues to trade above the H4 EMAs, both of which are sloping upward. Pullbacks are not breaking prior lows, and key support zones—most notably 4,450–4,470, and deeper at 4,400—remain valid. With this structure, I see no meaningful signs of weakness in the medium-term trend. If anything, the market looks like it is undergoing a brief re-accumulation phase ahead of the next leg higher.
This price action aligns well with the macro narrative. After the NFP report came in broadly in line with expectations, markets have maintained the view that the Fed is unlikely to re-tighten policy aggressively, easing rate-related pressure on gold. At the same time, central bank gold demand remains strong, geopolitical risks have not faded, and the US dollar continues to face longer-term pressure from monetary and fiscal dynamics. Together, these factors provide a sufficiently solid macro foundation to support the current bullish trend in gold.
Commodities

Falling towards pullback support?Gold (XAU/USD) is falling towards the pivot and could bounce to the 1st resistance.
Pivot: 4,495.44
1st Support: 4,404.03
1st Resistance: 4,612.12
Disclaimer:
The opinions given above constitute general market commentary and do not constitute the opinion or advice of IC Markets or any form of personal or investment advice.
Any opinions, news, research, analyses, prices, other information, or links to third-party sites contained on this website are provided on an "as-is" basis, are intended to be informative only, and are not advice, a recommendation, research, a record of our trading prices, an offer of, or solicitation for, a transaction in any financial instrument and thus should not be treated as such. The information provided does not involve any specific investment objectives, financial situation, or needs of any specific person who may receive it. Please be aware that past performance is not a reliable indicator of future performance and/or results. Past performance or forward-looking scenarios based upon the reasonable beliefs of the third-party provider are not a guarantee of future performance. Actual results may differ materially from those anticipated in forward-looking or past performance statements. IC Markets makes no representation or warranty and assumes no liability as to the accuracy or completeness of the information provided, nor any loss arising from any investment based on a recommendation, forecast, or any information supplied by any third party

GOLD - Consolidation near 4600. Breakout or correction?FX:XAUUSD has updated its ATH to 4600. A local range is forming, with growth potential, against the backdrop of escalating geopolitical risks and concerns about the independence of the Fed, which remain.
Trump's consideration of military operations in Iran amid internal unrest and the tense situation in the Russia-Ukraine conflict (emergency UN Security Council meeting) create geopolitical risks.
Questions for the Fed: A criminal investigation has been launched against Chairman Powell, heightening concerns about pressure on the central bank's independence.
US employment data (NFP) for December (+50K) was weaker than expected, supporting expectations of Fed policy easing. Attention is shifting to December inflation data (CPI), which will assess the likelihood of a rate cut in March (current probability ≈30%).
The correction may continue, but the combination of risks and soft monetary policy creates medium-term support for further growth.
Resistance levels: 4600, 4625, 4650
Support levels: 4561, 4550, 4517
Since the opening of the session, gold has exhausted its intraday ATR reserve, which creates additional opportunities for consolidation or correction, within which the market may test key support zones, such as the previous ATH, before continuing to grow. A long squeeze of the specified support may provide the market with liquidity for further growth. However, an aggressive market could trigger a breakout of 4600 without correction...
Best regards, R. Linda!

Bullish bounce off?USO/USD has bounced off the support level, which serves as a pullback support, and could bounce from this level to our take-profit.
Entry: 58.64|
Why we like it:
There is a pullback support level.
Stop loss: 57.36
Why we like it:
There is a pullback support level.
Take profit: 61.15
Why we like it:
There is a swing high resistance level.
Enjoying your TradingView experience? Review us!
Please be advised that the information presented on TradingView is provided to Vantage (‘Vantage Global Limited’, ‘we’) by a third-party provider (‘Everest Fortune Group’). Please be reminded that you are solely responsible for the trading decisions on your account. There is a very high degree of risk involved in trading. Any information and/or content is intended entirely for research, educational and informational purposes only and does not constitute investment or consultation advice or investment strategy. The information is not tailored to the investment needs of any specific person and therefore does not involve a consideration of any of the investment objectives, financial situation or needs of any viewer that may receive it. Kindly also note that past performance is not a reliable indicator of future results. Actual results may differ materially from those anticipated in forward-looking or past performance statements. We assume no liability as to the accuracy or completeness of any of the information and/or content provided herein and the Company cannot be held responsible for any omission, mistake nor for any loss or damage including without limitation to any loss of profit which may arise from reliance on any information supplied by Everest Fortune Group.

Silver - This metal is blowing up now!💣Silver ( OANDA:XAGUSD ) is rallying even higher:
🔎Analysis summary:
Just a couple of months ago, we witnessed another bullish break and retest on Silver. It was quite obvious that Silver will rally accordingly and just recently, we experienced another +150% rally. However, looking at the higher timeframe, Silver is still not done.
📝Levels to watch:
$100
SwingTraderPhil
SwingTrading.Simplified. | Investing.Simplified. | #LONGTERMVISION

Tudor Gold: Multi-Year Breakout Signals Start of Major MarkupTudor Gold has been capped by a long-term descending resistance line that dates back to late 2020. In 2025 it briefly broke above this trendline, failed, and then pulled back into a broad support range where price spent months basing. That consolidation now appears to have completed. Price has once again pushed above the multi-year resistance and, importantly, has successfully retested it from above and held.
This behavior strongly suggests a major structural shift from distribution and markdown into accumulation, and now into the early stages of markup. The long period of compression under a declining macro trendline, followed by a breakout, retest, and hold, often precedes powerful expansion phases.
With the overhanging resistance absorbed and long-term moving averages beginning to flatten and turn up, Tudor Gold looks positioned for a sustained upside move. The technical structure aligns with a Wyckoff transition into markup, and the risk-reward now favors higher prices over time. Given this setup, Tudor Gold appears to have significant long-term upside potential as the next impulsive leg of the cycle begins.

1911 Gold's Next Leg Up1911 Gold (AUMBF) had a big run up last year. Since it topped back in september its been developing a bull flag range. It is nearing the end of its triangle, and likely to start expansion soon. In this chart i've blocked out the distribution, markdown, and accumulation zones that have occurred. I've also blocked out the likely markup zone that price is headed for. A liquidity sweep or two is still possible. 1911 is likely to be a heavy hitter this year.

GOLD 1H CHART ROUTE MAP UPDATE & TRADING PLAN FOR THE WEEKHey Everyone,
Please see our 1h chart levels and targets for the coming week.
We are seeing price play between two weighted levels with a gap above at 4530 and a gap below at 4505, as support. We will need to see ema5 cross and lock on either weighted level to determine the next range.
We will see levels tested side by side until one of the weighted levels break and lock to confirm direction for the next range.
We will keep the above in mind when taking buys from dips. Our updated levels and weighted levels will allow us to track the movement down and then catch bounces up.
We will continue to buy dips using our support levels taking 20 to 40 pips. As stated before each of our level structures give 20 to 40 pip bounces, which is enough for a nice entry and exit. If you back test the levels we shared every week for the past 24 months, you can see how effectively they were used to trade with or against short/mid term swings and trends.
The swing range give bigger bounces then our weighted levels that's the difference between weighted levels and swing ranges.
BULLISH TARGET
4530
EMA5 CROSS AND LOCK ABOVE 4530 WILL OPEN THE FOLLOWING BULLISH TARGETS
4559
EMA5 CROSS AND LOCK ABOVE 4559 WILL OPEN THE FOLLOWING BULLISH TARGETS
4588
EMA5 CROSS AND LOCK ABOVE 4588 WILL OPEN THE FOLLOWING BULLISH TARGETS
4619
BEARISH TARGETS
4505
EMA5 CROSS AND LOCK BELOW 4505 WILL OPEN THE FOLLOWING BEARISH TARGET
4467
EMA5 CROSS AND LOCK BELOW 4467 WILL OPEN THE SWING RANGE
4427
4391
EMA5 CROSS AND LOCK BELOW 4391 WILL OPEN THE SECONDARY SWING RANGE
4345
4314
As always, we will keep you all updated with regular updates throughout the week and how we manage the active ideas and setups. Thank you all for your likes, comments and follows, we really appreciate it!
Mr Gold
GoldViewFX

$NEM – Leading Gold Stock Nearing a Key Inflection BreakoutNewmont ( NYSE:NEM ) is one of the leaders in the gold sector, and it’s now pushing right into the 91.50–92 breakout zone — a level that has acted as major resistance for months. This is a high-stakes inflection point.
🔹 The Setup:
Price is tightening underneath 91.50–92, a clean horizontal resistance.
NYSE:NEM has been showing relative strength, tracking gold’s move nearly tick-for-tick.
Structure is clean: rising EMAs, bullish slope, and volume building underneath the trigger.
🔹 Why This Matters:
AMEX:GLD itself looks fantastic — tightening, trending, and primed for continuation.
When gold futures and GLD look this strong, leading miners like NYSE:NEM tend to run first.
This is exactly the kind of setup where institutional money steps in.
🔹 My Trade Plan:
1️⃣ Entry: Add through a clean breakout over 92 with volume confirmation.
2️⃣ Stop: Under the 9 EMA — tight and mechanical.
3️⃣ Target: Trend continuation, first into prior pivot highs, then toward measured move extensions.
Why I Like This Setup:
Leader stock + leader sector = high probability.
Technicals and macro backdrop (rates, inflation tailwinds, dollar softness) all point the same way.
NYSE:NEM is often the “tell” for the entire gold complex — if this breaks, the whole sector could run.

XAUUSD 30M – Descending Channel Breakout SetupPrice has broken out of the descending channel, indicating a shift from corrective to bullish momentum.
Former resistance is now acting as support around 4,485–4,495, holding structure after the breakout.
Sustained strength above support favors continuation toward first target at 4,520–4,525 and the main target near 4,550–4,560, while a break back below support would invalidate the bullish setup.

Gold - XAUUSD - Double Butterfly Harmonic PatternsOn 4 hr time frame, two Butterfly harmonic patterns have been drawn. Both are more than 90% compliant to standard values.
Now if price goes up crossing first minor resistance at 4595~4505 region then it is most likely to test 4630~4650. RSI also suggesting upward momentum.
If price is dropped from this resistance then we might see a very deep retracement up to 3940~3920; which I personally do not find acceptable on fundamental's grounds.

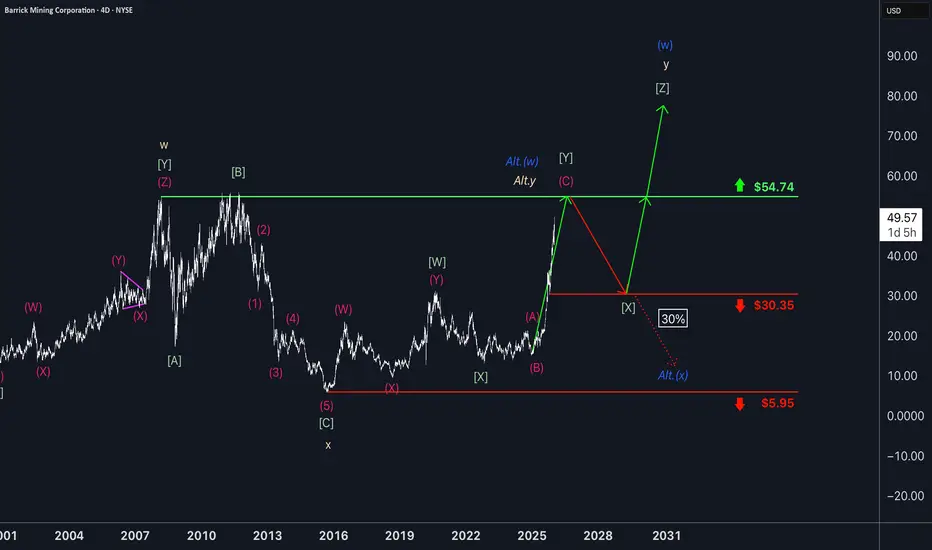
Barrick Gold slowly advancingWithin the ongoing three-wave pattern, the magenta wave (C) is expected to give the miner another boost, ultimately completing the green wave just below the resistance at $54.74. The following wave should then pull the stock back toward support at $30.35, from which wave is likely to start again. This move should once again lift Barrick higher, with the blue wave (w) projected to finish well above the $54.74 level. There is, however, a 30% chance that wave Alt.(w) could wrap up imminently. In that scenario, wave Alt.(x) would push price directly below $30.35, but would still bottom out before reaching the support at $5.95.
Crude OilUS Oil
- Falling Wedge as an corrective pattern in Short Time Frame
- Break of Structure
- Change of Characteristics
- Support Level
- Order Block

Gold Weekly Levels: Break above 4555 → 4625/4635🔱 GOLD WEEKLY SNAPSHOT — EXECUTIVE SUMMARY
✨ Bulls remain in control as price transitions into the Wave-5 extension sequence
🟡 Key unlock level: 4555 — a clean break/acceptance above opens continuation fuel
🚀 Wave-5 extension target: 4625–4635 (primary upside objective / price discovery ceiling)
🧲 Fresh overhead sell-side liquidity: 4625–4635 = high-probability “max-out + reversal” zone
🔄 Expectation after 4625–4635: corrective rotation lower profit-taking + liquidity sweep
🛡 Bull structure remains intact while above: 4350 first major buy-side pool
⚠️ Bears’ post-extension objectives: 4350 → 4275 fresh buy-side liquidity targets
🎯 Strategy this week: trade with the trend into 4625–4635, then shift mindset to correction timing
🏦 Core play: don’t chase highs under 4625–4635; scale out into target, then stalk reversal setup
________________________________________
🗳️ Gold Weekly Scenarios — What’s Your Play?
Which path do you have for XAUUSD next week?
🅰️ Hold above 4555 → wave-5 extension triggers → 4625–4635 sweep
🅱️ Fakeout / dip under 4555 early week → reclaim → squeeze into 4625–4635
🅲 Direct drive into 4625–4635 → rejection confirms reversal → correction targets 4350/4275
🅳 Your key level: 4555
________________________________________
🔥 GOLD WEEKLY SNAPSHOT — BY PROJECTSYNDICATE
🏆 Swing Structure
Gold is still operating in a bull-controlled tape, but this week is about finishing the move:
• 4555 is the trigger level that opens the door for continuation.
• Once continuation engages, the market is likely to seek a final liquidity run into 4625–4635.
• That zone is important because it’s not just a target — it’s fresh overhead sell-side liquidity, meaning it’s where late longs get trapped and smart money sells into strength.
• After the sweep completes, the roadmap flips: correction phase begins, with bears likely targeting fresh buy-side liquidity at 4350 and 4275.
________________________________________
📈 Trend
Higher-timeframe bias
Primary bias remains bullish, with the market positioned for a Wave-5 extension.
Tactical
This week is likely to trade in two phases:
Phase 1: Continuation & Extension
• Bulls defend structure, build pressure, then break 4555
• Momentum rotates higher as stops/liquidity fuel expansion
• Price seeks the 4625–4635 magnet
Phase 2: Max-Out & Correction
• Once 4625–4635 is tagged/swept, upside becomes asymmetric risk
• Expect rejection behavior stall → wick → displacement down
• Market shifts to “where’s the next liquidity pool?” → 4350, then 4275
________________________________________
🛡 Supports — Demand / Buy-Side Liquidity Zones
4555 Pivot / Trigger
This is the most important tactical level this week:
• Above it: continuation bias stays active
• Below it: market may chop, reload, or run a dip-reclaim pattern
4350 Fresh buy-side liquidity
• This is a post-extension magnet.
• If Wave-5 completes near 4625–4635, 4350 becomes the first major “bear target”.
• Also likely to act as a reaction zone once tagged.
4275 Fresh buy-side liquidity
• Secondary downside objective once 4350 is taken.
• Often the “final grab” zone that completes the correction leg.
• Expect increased bid interest here after liquidity is swept.
________________________________________
🚧 Resistances — Upside Objectives / Wave-5 Expansion Targets
4555 Breakout gate
• Break + acceptance = green light
• Rejection + failure = delay, not necessarily reversal until 4625–4635 is visited
4625–4635 Wave-5 extension + fresh sell-side liquidity
This is the main event:
• The market is expected to run this zone because it holds fresh overhead liquidity
• This is where you expect:
o stop runs
o late FOMO entries
o liquidity sweep behavior
o reversal conditions forming
Trade mindset at 4625–4635:
✅ take profits / reduce risk
❌ don’t initiate fresh longs late into the zone (unless you’re scalping with strict rules)
________________________________________
🧭 Bias Next Week
Primary bias: bullish continuation into 4625–4635, then correction expected.
What you’re trading this week:
• Bulls: break 4555 → push extension
• Bears: wait for 4625–4635 sweep → trigger correction → target 4350/4275
________________________________________
⚖️ Base Case Scenario Most likely path
Early week: pressure + positioning
• Market holds firm and works around the pivot zone
• Any dips are likely corrective and designed to reload liquidity for the break
Mid-week: trigger + acceleration
• 4555 breaks/holds
• Momentum expands; price begins seeking the upper liquidity pool
Late week: target hit + reversal risk increases sharply
• Price reaches 4625–4635
• Expect “max-out” behavior:
o stall / compression at highs
o wick sweeps
o sharp rejection candles
• Once rejection confirms, correction leg begins targeting:
o 4350 first
o 4275 next
________________________________________
🚀 Breakout / Invalidation Triggers
✅ Bullish confirmation trigger
Clean break + acceptance above 4555
• Confirms Wave-5 continuation is active
• Increases probability of reaching 4625–4635
⚠️ “Max-out” reversal trigger (what you’re watching at the top)
Sweep into 4625–4635 + rejection
Common confirmation behaviors:
• quick spike into the zone, then close back below
• repeated failure to hold above 4630-ish
• sharp displacement down after a liquidity grab
✅ Bearish continuation trigger
Rejection confirmed from 4625–4635 + breakdown through local supports
• Opens correction flow into 4350, then 4275
________________________________________
🔓 Bull / Bear Structural Lines
🟢 Bull control line: Above 4555
🟡 Transition line: 4625–4635
🔴 Bear objective line: Below post-top breakdown correction seeks 4350 → 4275
________________________________________
🧭 Recommended Strategy Framework
1️⃣ Primary Play — Ride Wave-5 into the extension
Idea: Bulls maintain control → break 4555 → push into 4625–4635
• Build exposure only when the market proves it can hold above 4555
• Prefer entries on:
o reclaim/hold of 4555
o shallow pullbacks that respect the breakout structure
• Risk management focus: avoid chasing once price is extended and nearing 4625–4635
2️⃣ Profit-taking Plan — Scale out into 4625–4635
This is your sell-side liquidity zone:
• Reduce longs into the target
• Tighten risk aggressively
• Assume reversal risk rises the closer price gets to 4635
3️⃣ Secondary Play — Hunt the correction AFTER the sweep
Once Wave-5 extension completes:
• Bears likely target fresh buy-side liquidity:
o 4350
o 4275
Correction mindset:
• First drop often sharp (trap release)
• First bounce likely around 4350
• If 4350 breaks clean, expect continuation into 4275
________________________________________
✅ Weekly Levels
• 4555: breakout gate / continuation trigger
• 4625–4635: wave-5 extension + sell-side liquidity (reversal window)
• 4350: buy-side liquidity target #1 (post-top correction)
• 4275: buy-side liquidity target #2 (deeper correction objective)

XAUUSD (Gold) – Bullish Exhaustion → Short OpportunityGold is currently trading near a strong resistance zone after a sharp impulsive move, showing signs of bullish exhaustion. Price is respecting the rising trendline, but rejection from the upper zone suggests a potential pullback / correction.
🔹 Key Observations:
Strong bullish push followed by consolidation
Price reacting near a premium resistance area
Possible lower high formation
Trendline break or rejection could trigger downside momentum
🎯 Bearish Scenario:
If price fails to hold above resistance, we may see a corrective move toward the demand zone highlighted on the chart.
📌 Targets:
First support near 4536 area, followed by deeper continuation if momentum increases.
🛑 Invalidation:
A strong close and hold above the resistance zone will invalidate the short setup.
⚠️ Risk Management:
Always wait for confirmation and manage risk properly. This is not financial advice.

XPTUSD (Platinum) — 1H Trade Plan | Multi-TF ConfluenceXPTUSD (Platinum) — 1H Trade Plan | Multi-TF Confluence
Multi-Timeframe Bias
• Daily: Strong bullish trend intact; price holding above 0.786 Fib → continuation structure
• 4H: Higher highs & higher lows; pullbacks respected Alligator support; no trend breakdown
• 1H (Execution): Bullish structure, higher lows, price accepted above key Fib & demand zone
➡️ Overall Bias: BULLISH CONTINUATION
⸻
Candle & Momentum Read
• 1H Candles: Bullish engulfing + strong continuation candles from demand
• RSI (1H): Holding above 50 (bullish regime)
• Divergence: ❌ No bearish divergence detected across H1 / H4
⸻
Key Levels
Resistance
• 2465–2485 (Daily high)
• 2500 (Psychological)
Support
• 2350–2340 (0.786 Fib + H1 structure)
• 2320–2300 (H4 demand zone)
⸻
🎯 Trade Plan (1H Execution)
🟢 Buy Setup – Trend Continuation
Entry (EP):
• Buy pullback 2350–2360
• OR buy H1 bullish confirmation above 2350 or aggressive entry at current level
Stop Loss (SL):
• Below 2320
• Conservative: 2290
Take Profits (TPs):
• TP1: 2415 if entering on pullback
• TP2: 2465–2485 from current level
• TP3 (Runner): 2500+
⸻
❌ Invalidation
• H1 close below 2320
• RSI breaks below 45
• Strong bearish engulfing with follow-through from resistance
⸻
✅ Checklist Scoring (Lecture Framework)
Daily Trend BULLISH
H4 Structure BULLISH
RSI Regime BULLISH
Candle Pattern BULLISH
Location (Fib + S/R) BULLISH
Divergence NIL
Score:
Bulls 5 / 6
Bears 0 / 6
