$XPD , PALLADIUM One of my biggest bets for 2026
ENTRY : CMP
SL: Only if you wish
TP: $2927, that´s going to be a coll 75% up , I´ll take something out there
Financial Disclaimer:
This is not financial advice. This is a technical perspective based on price action and market structure. Always manage risk, do your own research, and never trade solely based on a single chart or scenario.
Commoditytrading

Crude Oil at Key Short-Term Reversal ZoneCrude Oil – 15 Min Short-Term View
Crude Oil is currently taking support in the 5100–5130 zone and is trading near the lower band of a falling channel.
Reversal Scenario:
If the support holds, a short-term reversal towards 5180–5190 is possible.
Breakdown Scenario:
A decisive break below the support may lead to a move towards the major support zone at 4900–5000.

Crude Oil Pattern Formation: Breakout or BreakdownCrude Oil – 1 Hour Timeframe Analysis
Crude Oil is currently trading within a well-defined parallel channel between 5130–5150.
Price action is forming a symmetrical triangle pattern, with a key support zone near 5180–5200.
Breakdown Scenario:
If the price breaks below the pattern support, Crude Oil may first test the 5130–5150 support zone. A sustained breakdown could extend the downside move towards 5050–5030.
Upside Scenario:
If the support zone holds and price sustains above the pattern, an upside move towards 5300–5330 can be expected.
Thank You !!

Agro Commodity Watch: Soybean Sets Stage for Bullish Expansion🏦💰 SOYBEAN HEIST: The Cash Flow Caper! | SOYBEAN/USD Strategic Entry Plan
🎯 THE SETUP: Agricultural Gold Rush Edition
Market: SOYBEAN vs USD (Agro Commodity - Cash Flow Management Strategy)
Trading Style: Swing/Day Trade Hybrid
Mission Status: 🟢 BULLISH BIAS ACTIVATED
📊 THE MASTER PLAN: Triangular Moving Average Breakout Strategy
🚀 Entry Conditions:
Wait for the Triangular Moving Average (TMA) breach to the upside — this confirms our bullish trend validation! Once we see that clean break above resistance, we're ready to "acquire our positions" strategically.
⚠️ CRITICAL: Set price alerts on your trading platform to catch the breakout in real-time!
💎 Layered Entry Zones (Scaling In Like Pros):
Strategic accumulation levels for risk management:
Layer 1: $10.050 🎯
Layer 2: $10.100 🎯
Layer 3: $10.150 🎯
Layer 4: $10.200 🎯
Pro Tip: You can choose ANY price level entry after the breakout confirmation — these layers simply optimize your average cost basis!
🛡️ RISK MANAGEMENT PROTOCOL
⛔ Stop Loss Zone: $10.000
Important Disclaimer: This is MY personal risk tolerance level. As traders, YOU must determine your own risk appetite and stop-loss placement. Trade at your own risk and only risk capital you can afford to lose!
🎯 PROFIT EXTRACTION TARGET
💰 Primary Target: $10.400
The "Police Barricade" Analysis:
This zone presents multiple confluences:
🔴 Strong resistance acting as psychological barrier
📉 Oversold conditions may trigger reversals
Potential bull trap zone — time to secure profits!
Exit Strategy: Consider scaling out positions as we approach $10.400. Don't get greedy — secure gains incrementally!
Important Note: This target is MY analysis. YOUR profit-taking strategy should align with your personal trading plan and risk management rules. Always secure profits at YOUR comfort levels!
🌾 RELATED AGRICULTURAL COMMODITIES TO MONITOR
Watch these correlated markets for confirmation signals:
CORN ( CBOT:ZC1! ) 🌽 - Direct grain market correlation, often moves in tandem with soybean fundamentals
WHEAT ( CBOT:ZW1! ) 🌾 - Grain sector sentiment indicator, affects overall agricultural commodity flows
SOYBEAN MEAL ( CBOT:ZM1! ) 📦 - Derivative product, reflects processing demand and crush spreads
SOYBEAN OIL ( CBOT:ZL1! ) 🛢️ - Key byproduct, influenced by biodiesel and cooking oil demand
DBA (Invesco DB Agriculture ETF) 💵 - Broad agricultural sector strength gauge
Dollar Pairs for Macro Context:
DXY (US Dollar Index) 💵 - Inverse correlation: weaker USD = stronger commodity prices
DX1! (Dollar Futures) - Real-time currency strength affecting agricultural export competitiveness
Key Correlation: Soybeans typically exhibit negative correlation with USD strength. Monitor the Dollar Index for macro tailwinds supporting our bullish thesis!
🔑 KEY TECHNICAL CONFLUENCES
✅ Triangular Moving Average breakout confirmation
✅ Multi-layered entry approach minimizes timing risk
✅ Clear risk-defined stop loss below psychological support
✅ Target aligned with technical resistance + overbought zones
✅ USD weakness could provide fundamental tailwinds
Risk Warning: Commodity futures and options trading carries significant risk and may not be suitable for all investors. You could lose more than your initial investment.
"Thief Style" Context: The playful "heist" terminology is purely thematic storytelling to make technical analysis engaging — it does NOT encourage or endorse any illegal activities or unethical trading practices. All strategies discussed involve legitimate, legal market participation.
📣 COMMUNITY ENGAGEMENT
✨ If you find value in my analysis, a 👍 and 🚀 boost is much appreciated — it helps me share more setups with the community!
#SOYBEAN #Commodities #AgricultureTrading #SwingTrading #DayTrading #TechnicalAnalysis #PriceAction #BreakoutStrategy #CashFlow #RiskManagement #TradingSetup #FuturesTrading #GrainMarkets #USD #ForexCorrelation #MovingAverages #SupportAndResistance #TradingPlan #MarketAnalysis #CommodityFutures

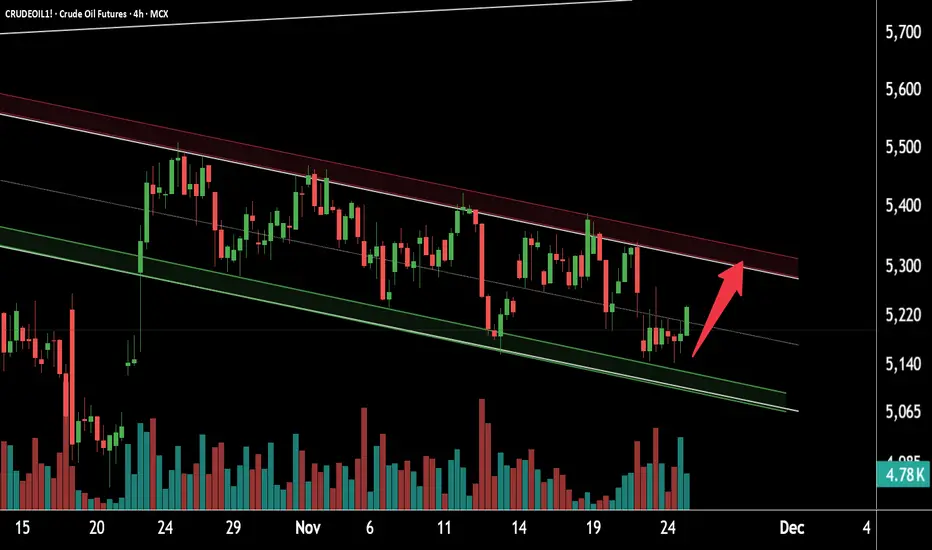
Crude Oil Showing Strong Upside SetupThis is the 4-hour timeframe support zone of Crude Oil.
The price is moving within a falling channel and is currently trading near the support zone at 5050–5100.
Crude Oil is respecting this support and has started taking a reversal.
If the momentum continues, the bullish move may extend towards the resistance zone at 5350–5400.
Thank you.
CORN Bulls in Control? Retest Pullback Confirms Trend Bias🌽 CORN Institutional Edge Plan (Swing/Day Trade Setup)
🔍 Market Context
CORN (CFD on US Corn Futures) is showing signs of bullish momentum after testing a key resistance area. Institutional order flow hints at accumulation in the mid-420s region — a potential pullback zone before continuation higher.
🧭 Thief Strategy Plan — Layered Entries
This setup follows the “Thief Strategy”, a layered entry approach using multiple buy limit orders to capture volatility and improve average entry cost.
📈 Layered Buy Zones:
1️⃣ 428
2️⃣ 430
3️⃣ 432
(Traders may extend layers based on risk appetite and confirmation signals.)
🛑 Protective Stop (Thief SL): Around 424
🎯 Profit Zone (Thief TP): Around 445
🧠 Plan Insight
Expecting a resistance retest pullback to confirm the bullish structure.
Momentum aligns with higher-timeframe bias after institutional demand emerged near 420s.
Targets align with overbought resistance and prior liquidity traps — best to secure profits and protect gains as price nears 445.
💡 Note: Each trader should manage risk independently. This setup is educational only — showing how to structure a layered “Thief-style” plan, not a recommendation to buy/sell.
🔗 Correlated Assets to Watch
OANDA:WHEATUSD – Often mirrors agricultural flow shifts.
$SOYBEANUSD – Moves inversely at times; watch for divergence.
TVC:DXY – A stronger dollar can pressure commodity prices.
OANDA:SPX500USD – Risk appetite correlation; strong equities can support commodity demand.
🕵️♂️ Thief’s Key Notes
Dear Ladies & Gentlemen (Thief OG’s) — this plan shows how I structure entries, not where you should trade.
You can make money — then take money — at your own risk.
Manage your own stop-loss, target, and position sizing like a pro.
✨ “If you find value in my analysis, a 👍 and 🚀 boost is much appreciated — it helps me share more setups with the community!”
📜 Disclaimer:
This is a Thief-style trading strategy created just for fun and educational purposes.
Not financial advice. Trade responsibly.
#CORN #Commodities #Futures #InstitutionalTrading #SwingTrade #DayTrading #LayeredEntries #ThiefStrategy #SmartMoney #PriceAction #CommodityMarket #Agriculture #DXY #WHEAT #SOYBEAN #TradingView #ThiefTrader

Beyond the Chart - GOLD Market Technicals & Fundamentals🟡 XAUUSD Daily OG FlowMaster Zones
Gold is testing the key 3,930-3,910 demand region after rejecting the 4,250 distribution zone. The market is in a mid-term correction phase within a broader bullish structure.
🔴 Short-Term
If 3,910 breaks, expect a continuation toward 3,750 → 3,500 — next OG accumulation layers where liquidity may build again.
🟢 Mid-Term
Holding above 3,900 could trigger a bounce toward 4,100–4,250 (previous imbalance zone) before the next decision phase.
⚙️ Accumulation / Distribution Map
Distribution: 4,250–4,300
Current Reaction: 3,910
Next Demand Pools: 3,750 → 3,500
📰 Market Data Watch
Upcoming U.S. inflation, bond yields, and Fed tone can sharply impact gold’s volatility and decide if the correction extends or reverses.

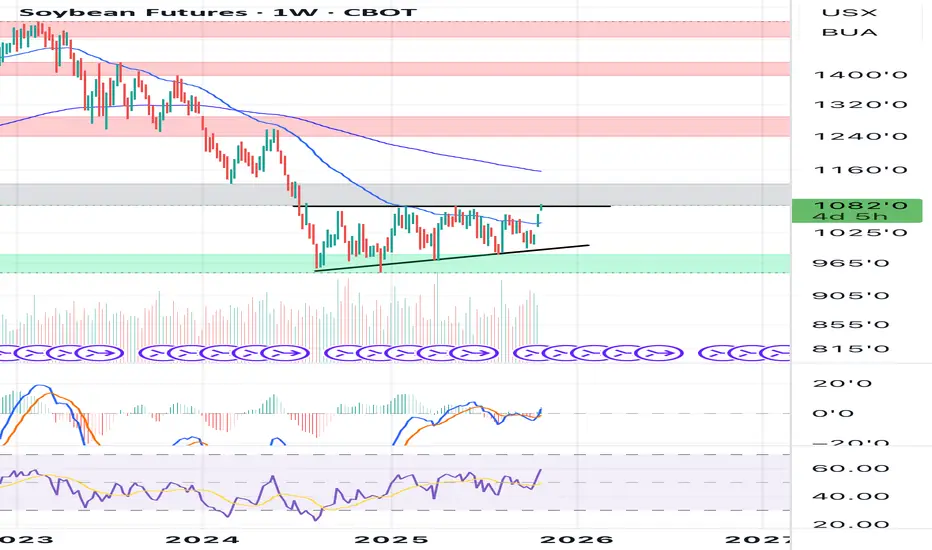
Long on Soybeans Clear ascending triangle in play.
RSI, MACD are bullish and also above the 50 EMA.
I’m bullish on soybeans and current fundamentals.
I will long on breakout of ascending triangle.
TP - 1200
$GOLD Rally Pause – Will the Golden Fib Hold?TVC:GOLD has seen a strong rally after months of accumulation, but the recent sharp pullback looks like a healthy correction rather than a trend reversal.
Currently, price is approaching the Golden Fib Zone (0.5–0.618), an area that often acts as a strong support during ongoing uptrends. If the price manages to hold this zone and form a solid base, we could see the next leg higher, potentially leading to new highs.
For now, the focus remains on how price reacts at this Fib zone, a bounce here could confirm continuation, while a breakdown below may signal a deeper correction.
DYOR, NFA
THANKS FOR THE READING

Gold short Trade Idea Trend: Bullish
Divergence: Bearish
Reversal Pattern: Double Top
Bias: Bearish
Scenario: Entry at HL Breakout
Trade Plan
Stop Loss : 4405
Entry Level: 4175
TP: 3945

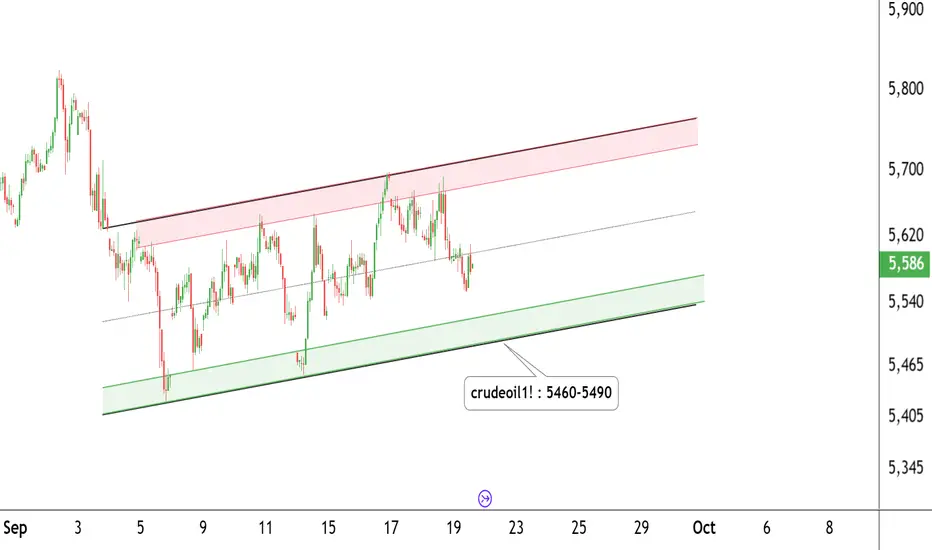
Crude Oil Trading Levels – Plan Your Move!CRUDE OIL – Daily Timeframe Update
Crude Oil is trading within a well-defined parallel channel on the daily chart.
The price is currently taking support near the 5460–5490 zone and moving within an ascending channel.
Support Zone: 5460 – 5490
Resistance Zone: 5700 – 5720
If these levels sustain, we may see higher prices ahead in Crude Oil.
Thank you!!
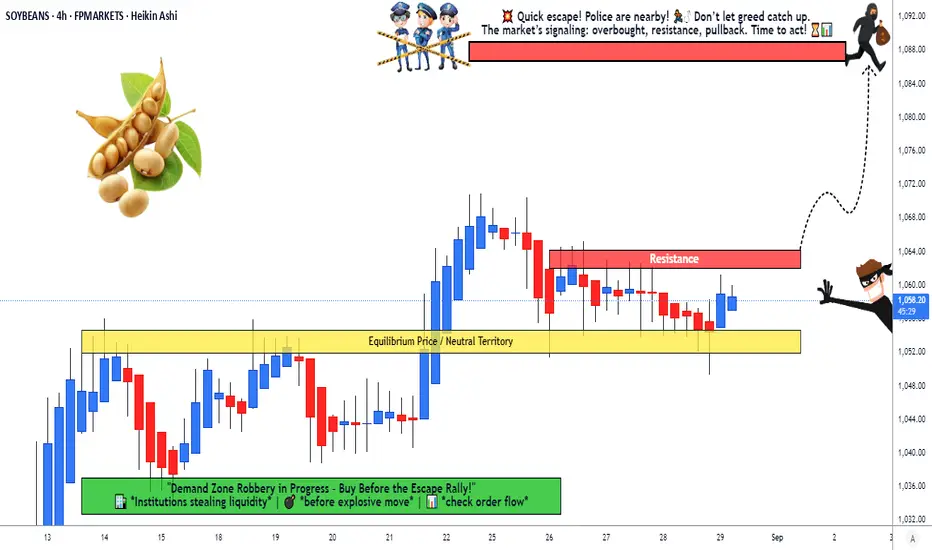
Soybeans vs USD: Breakout Robbery in Progress – Join the Escape!🚨💰🌱 Soybeans vs. US Dollar Commodities CFD Heist Plan (Swing/Day) 🕶️⚡
👋 Dear Ladies & Gentlemen… and my fellow Thief OG’s 🐱👤💵,
Tonight’s grand heist is in the Soybeans Vault 🌱💰 vs. the Mighty Dollar 💵.
We move Bullish 📈 – the loot is ripe, and the guards are weak!
🎯 The Master Heist Plan
Entry (Breakout Trigger): ⚡ 1065.00
👉 Once the vault door cracks open at 1065, we sneak in with Thief Layer Entries 🕶️🔪:
1063.00
1060.00
1055.00
1052.00
(Keep layering your entries, thief-style… the deeper the pullback, the fatter the loot 💎💸).
Stop Loss (Thief Escape Plan): 🏃♂️💨
📍 The secret tunnel is at 1040.00.
But hey thieves, adjust your SL 🔑 based on your strategy & risk appetite.
Target (Police Barricade 🚔):
👉 1088.00 – That’s where the cops set up the roadblock, so escape with the bag before they catch you 🏆💰✈️.
🕶️ Thief Trading Wisdom
Multiple buy limit layered orders = professional thief entry strategy.
Always confirm the breakout before layering in.
Police (market makers) will try to trap you – stay one step ahead 🐱👤⚡.
🔥 Boost our Robbery Plan if you’re part of the crew 💣💵!
The more likes & views, the bigger the gang grows 🚀.
#ThiefTrading 🕶️ #SoybeansHeist 🌱💰 #CommodityLoot 💸 #SwingTradePlan ⚡ #DayTradeRobbery 🐱👤 #USDvsSoybeans 💵 #BreakoutStrategy 📈 #LayerEntry 🔑 #TradingViewHeist 🚔 #MarketLootPlan
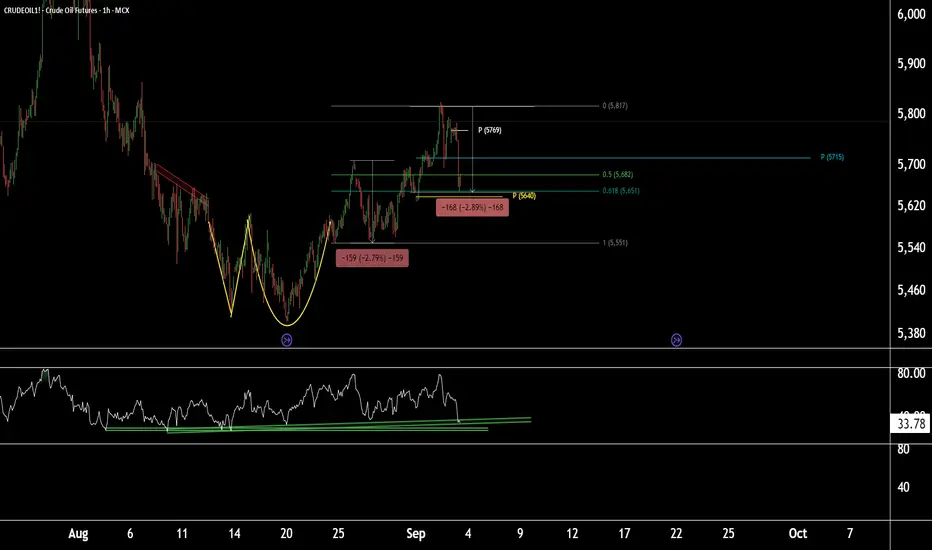
Price action + RSI support = fresh buy opportunity in CrudeOil1!CrudeOil1! (1-Hour Timeframe) Technical Outlook
CrudeOil1! is currently sustaining at the Fibonacci Golden Ratio level of 0.618, with the weekly pivot placed near 5640. Based on Fibonacci projections and price action, this 5640 zone appears to be a crucial area, as it aligns with a 2.8% retracement completion.
On the 1-hour timeframe, the RSI is showing a decline but may take support near the current levels, adding further weight to this support zone.
All technical indicators together suggest that the 5640–5650 zone could act as a strong support in the short term. If this support holds, we may see upside targets at 5715 and 5750, with the potential for CrudeOil1! to make a new high if the bullish momentum continues.
Thank you.
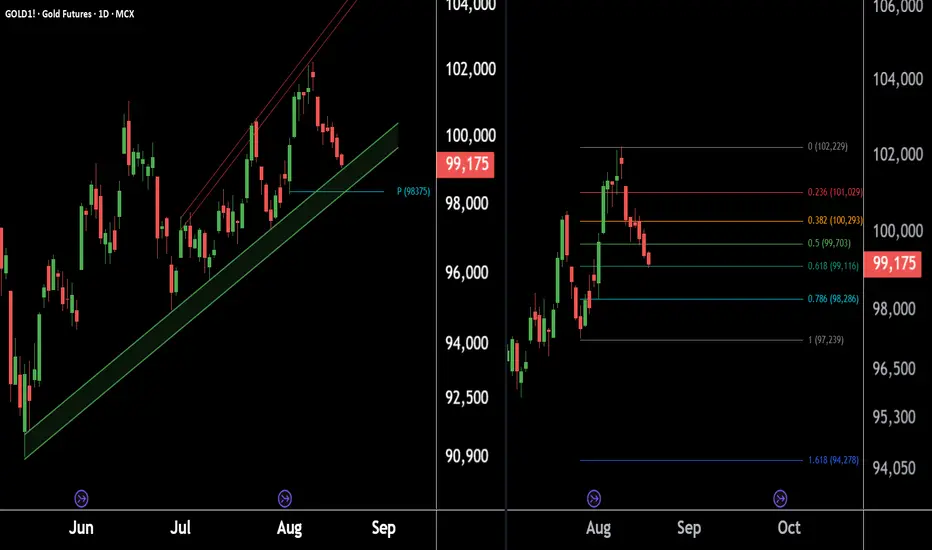
Gold is testing key levels – setup indicates a favorable buying.Here are 2 charts of Gold on the Daily Timeframe.
GOLD1! is approaching its support zone, with key levels at ₹98,200 and ₹98,800.
The Monthly Pivot at ₹98,375 also aligns with this zone, indicating a strong support area.
Fibonacci Golden Ratio is also indicating key support levels around ₹99,200 and ₹98,200, which may act as strong demand zones.
If respected, these levels could trigger a fresh upside move.
Thank You !!
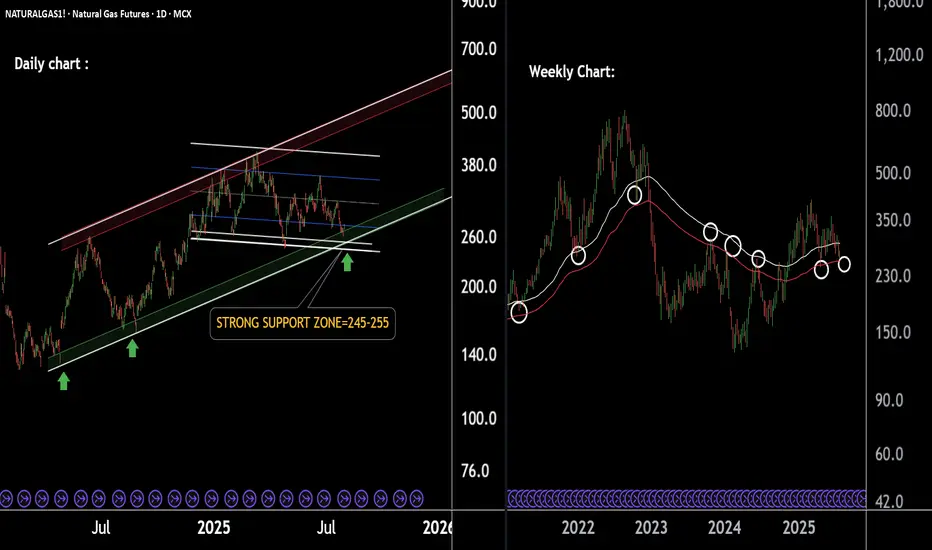
Natural Gas Cooling Near Support Zone – Bounce Ahead!Natural Gas Technical Overview (2-Chart Analysis):
Chart 1 – Parallel Channel Formation:
Natural Gas is moving within a well-defined parallel channel.
The lower support boundary of this channel is observed near 250, indicating a potential bounce zone.
Chart 2 – EMA-Based Support Structure:
Price is currently sustaining above key EMAs, reflecting short-term strength.
The last EMA support lies around 252, acting as an additional support confluence.
If this level is sustain then we may see higher prices in Natural gas futures.
Thank you !!
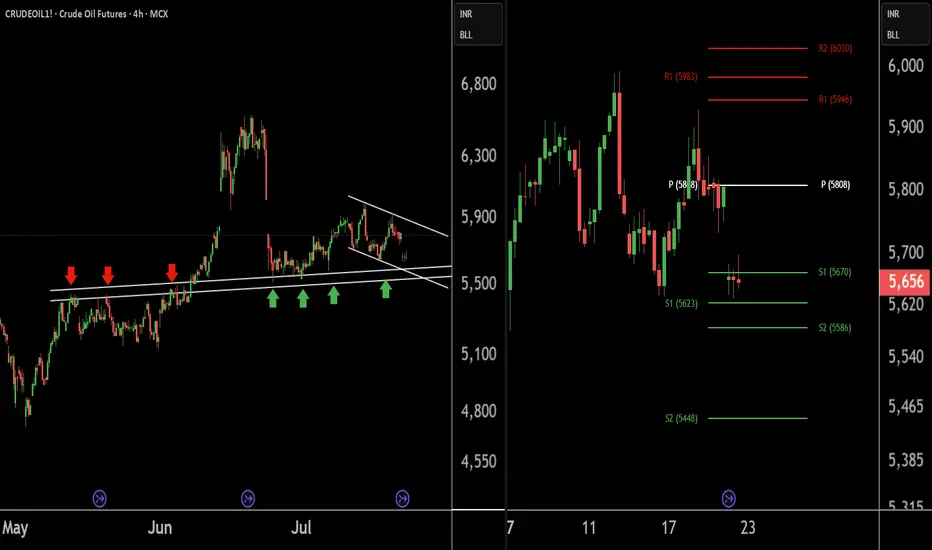
Crude Oil Buying Alert: Strategic Entry Point IdentifiedThere are two charts of Crude Oil on the 4-hour timeframe.
In the first chart, Crude Oil is sustaining near its lower point (LOP), with a support range of 5540-5580.
A-VWAP is also providing support to Crude Oil around the 5580 level.
The Pivot Point is also supporting Crude Oil around the 5580-5620 level.
If this level is sustain then we may see higher prices in Crude Oil.
Thank you !!
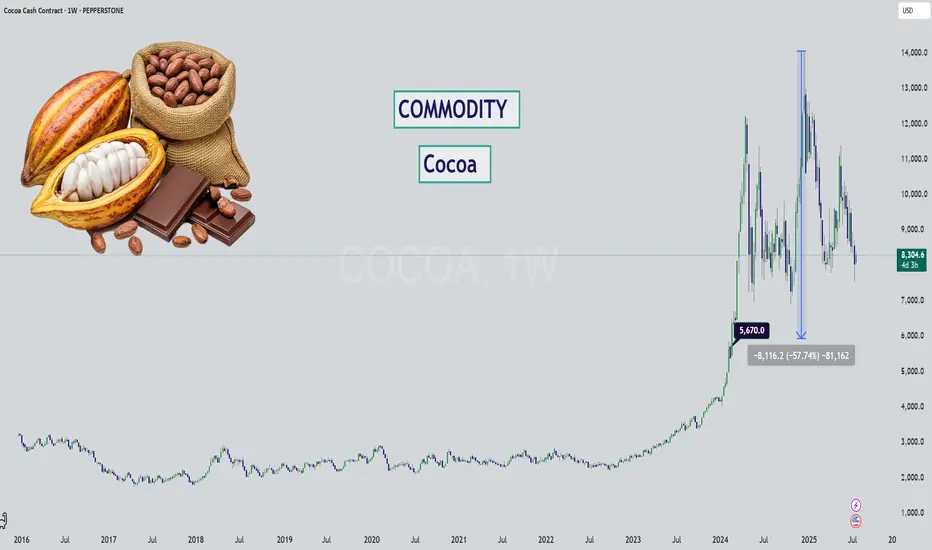
Cocoa - Chocolate is DIPPING (literally)Hello Market Watchers 👀
I bring today an update on your favorite commodity (mine actually)... 🍫
The weekly timeframe from a multi-year perspective is what's on the cover and one thing is clear - cocoa has never increased so much as it during May23' to Dec24'.
Sure inflation brought on by covid has a role to play. But even so, factoring in the amount of +509%? That is way out.
We could likely see this kind of stair step down movement on cocoa, since it has been following the logic of: " previous support = new resistance ".
Either way what this tells me is that cocoa has been running overly hot for too long... and it's time for a cooldown. Prices will likely never return to pre-covid levels, unless there is unfortunate weather or other supply chain issues.
Ultimately, a return back to the $5,600 zone would be a reasonable market correction for such a large increase.
XAGUSD Weekly Analysis (MMC) : Bullish Channel Toward Target🧠 1. Trend Shift Confirmed – Silver in Full Bullish Momentum
Silver has officially broken free from its multi-year sideways range and has entered a well-defined ascending channel, pushing toward higher highs week after week. The momentum is strong and supported by a combination of technical elements, structure shifts, and clean retests.
The trend is now clear: bullish, with the price aiming for the Next Reversal Zone between $46 and $48 — a level not seen since mid-2020.
🔷 2. Blue Ray Break – Start of the Rally
The breakout began with a clean move above the Blue Ray trendline, a key structure that had suppressed Silver’s growth for several years.
As the chart notes:
“Blue Ray Always Continue Trend” — until broken.
Once Silver broke above this resistance, it not only confirmed the trend reversal but also triggered the formation of a new bullish market structure, supported by aggressive buying.
🔁 3. SR – Interchange Zone Holding Strong
The SR Interchange zone (around $27 – $30) has played a critical role in this breakout. It acted as:
Resistance during the multi-year range.
Then Support after the breakout, confirming a classic Support-Resistance Flip (SRF).
This zone now serves as a solid demand base, giving the rally a stable foundation to push higher.
🪙 4. QFL Formation – Momentum Confirmation
The breakout also aligns with a QFL (Quick Flip Level) structure — a powerful bullish continuation pattern.
QFL setups form when price breaks above a former base, pulls back slightly, and then quickly resumes the upward trend.
This indicates that buyers are aggressive and unwilling to let price fall too far, fueling a rally.
Combined with the ascending channel, the QFL structure gives extra confidence that Silver is on track to reach the $46–$48 Reversal Zone.
📏 5. Trendline & Channel – Price Structure in Control
Silver is currently moving cleanly within an ascending parallel channel, respecting both upper resistance and lower support trendlines. The inner trendline has been tested multiple times, and price is now riding its upper half.
This shows:
Buyers are in control.
Each correction is shallow.
Market confidence is growing week after week.
Expect volatility to increase as Silver approaches the next target area.
🎯 6. Next Reversal Zone: $46 – $48
The green box at the top marks the Next Reversal Zone, where Silver might:
Stall temporarily and consolidate.
Or face a pullback back toward the mid-channel line or lower support.
This zone corresponds to:
Historical supply area (2020 highs)
Strong psychological resistance
Potential profit-taking by institutions or swing traders
🔭 Trade Scenarios to Watch
✅ Bullish Continuation:
If Silver maintains support above $36 and remains inside the ascending channel, we may see a smooth ride into the reversal zone. Look for:
Break-and-retest of the midline
Bullish candles with long wicks on dips
⚠️ Short-Term Rejection:
If price reaches $46–$48 and shows signs of exhaustion (like long upper wicks, evening star, or bearish engulfing), expect a healthy pullback toward $35–$36 or even $32.
As long as the ascending structure holds, bulls remain in control.
🧩 Key Technical Levels
Element Zone / Level Action
SR Interchange Support $27 – $30 Strong demand zone
Blue Ray Breakout Confirmed Trend reversal signal
QFL Zone Around $36 Retest and rally confirmation
Reversal Zone $46 – $48 High-probability reaction area
Trendline Support Dynamic ($35–$36) Bullish channel continuation
📌 Final Thoughts:
Silver is now playing in the big leagues again. With the Blue Ray broken, QFL confirmed, and price following a disciplined trendline channel, this rally looks both technically sound and fundamentally strong.
Watch the $46–$48 zone carefully. Whether price rejects or breaks through, there will be high-probability setups for both breakout traders and dip buyers.
Stay disciplined, don’t chase, and let price give you confirmation.

GOLD1! Best Key Level !!This is the 1 hour Chart of Gold!.
Gold is forming a bearish structure and is consistently respecting the resistance zone, leading to a downward move. The key resistance area is between 97,800 and 97,400..
Gold is finding support in the 96,250 – 96,330 zone on the short time frame.
A breakdown below this level may trigger aggressive selling pressure.
Thank you !!

CRUDEOIL1! at Best Support Zone !!This is the Daily Chart of CRUDEOIL1!.
CRUDEOIL1! having a good law of polarity at 5500-5600 level .
CRUDEOIL1! is currently trading between its quarterly pivot 5603 level and monthly pivot 5805 levels , indicating a range-bound movement."
Once the Crudeoil1! sustains above the monthly pivot, it may trigger a potential upside rally."
If this lop is sustain , then we may see higher prices in CRUDEOIL1!
Thank You !!

NATURALGAS1! 's key Level |This is the 4 hour chart of NATURALGAS1!
NATURALGAS1! has once again started sustaining above
its LOP (Law of Polarity) zone near at 290-295
If This level is sustain then ,we may see higher prices again in NATURALGAS1!.
Thank You !!

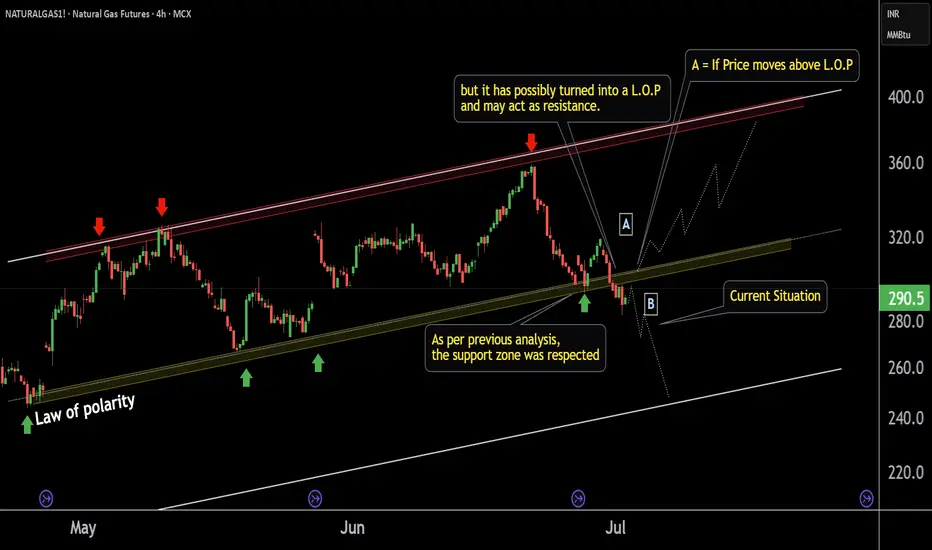
NATURALGAS1! Short time Breadkdown Alert !!This is the 4 hour chart of Natural Gas Futures.
NATURALGAS1 has given a short-term channel breakdown; the previous support may now possibly act as resistance at 300 level.
The breakdown target is the lower boundary of the broader channel, which may now act as support near at 240 level.
If lop is sustain then we may see lower prices in NATURALGAS1.
Thank You !!
NATURALGAS at Best Support Zone This is the 4 hour chart of Natural Gas.
Natural Gas having a good Support Zone at 290-295 range.
Natural Gas has shown a reversal from its support zone.
Natural Gas is trading within a parallel channel support at 293 level Natural Gas.
Thank You !!
