Compression

What do you think about CADJPY?we have structure here... what do you think guys? Buy on demand after break compression pattern? or BUY on breakout 82.585?


KLAC in CompressionKLAC is in a compression mode after a strong run upward to a new high. The stock is showing some minor Dark Pool Quiet Rotation™ at this price level, but for now the stock is holding the gains.

KLAC Compression Pattern Ahead of Earnings SeasonKLAC has hit a new all-time high and is now in a tight compression, even as Dark Pool Quiet Rotation™ continues.

NKE Compression Pattern Near Highs of the Trading RangeNKE shows price has compressed into a tighter candlestick pattern formation near the highs of its long-term trading range pattern. The compression has minor Dark Pool Quiet Rotation™.

MSFT Compression Attempted Breakout FailsMSFT has been in a tightening compression pattern that failed to break out and maintain a higher price. The stock has been under heavy Buyback mode over the past several months. Dark Pool Quiet Rotation™ continues.

Fresh demand for buy positionThe Gold price compressed down toward the demand below.
It seems like a great demand to buy Gold,
The confluence of price compressed down and a fresh demand is a great one for buy position.
I'll buy the demand at the first touch

MU Under Dark Pool Quiet Rotation™MU is in a Trading Range pattern at this time. The compression of that candlestick pattern in August is showing signs of heavier Dark Pool Quiet Rotation. The large lot long-term investors are slowly lowering inventories on MU over many weeks, and this increases downside pressure.


Overnight compression is overall probable for BTCSideways price action is something you can bet on, but only if you're sitting around to day trade it. Sad thing is, I'm sleep. See you tomorrow morning!

INCY Triangle FormationINCY has been sideways for a year, but it is not showing a compression candlestick pattern to a potential Triangle Formation. Triangles tend to be continuation patterns much of the time.

AUDNZD Long Swing Trade IdeaAUDNZD - Long
-------------------------------------------------------------------------------------------------------
Posted this setup in May for a sell and TP got smashed without a doubt. Now we are looking for a buy after seeing compression into demand.
We also see down trendline broken by that strong bullish impulse move last week. Buyer now have regained control.
Looking to buy at 1.04129
SL : 30 pips
TP: 1.07257
R:R Ratio of 1:5
Til we meet again beloved!
---------------------------------------------------------------------------------------------------------

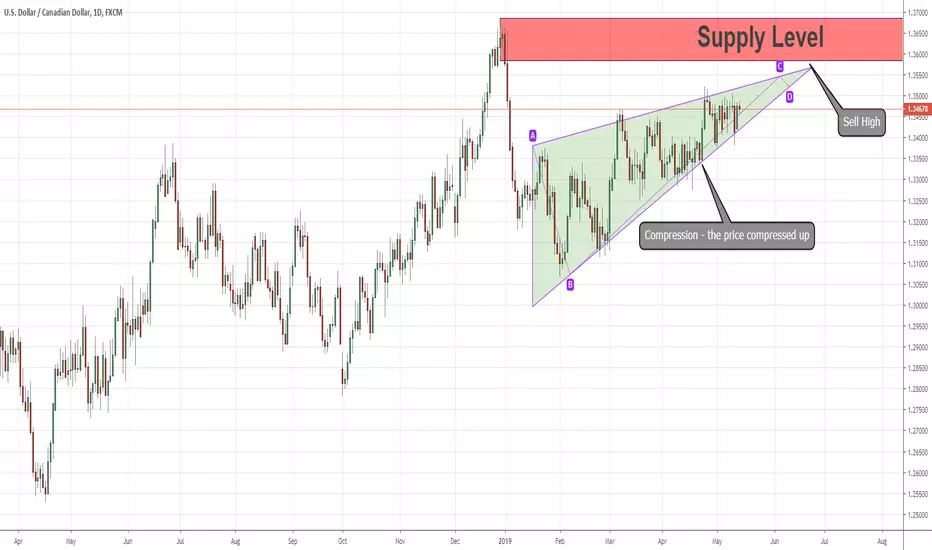
What Make The Supply Above A Great Level For Sell Position 14/05As we can see on the 1D chart, the USDCAD price is struggling to move up, this kind of price behavior called “Compression“, the price move up step by step in a way that looks powerless, many Small candles, everything seems pressed, above us, there is a great supply which most probably holds many unfilled orders, that indicates a strong level, the combination of a price move up by Compression and a supply level creates a great opportunity for sell position, when the price touch the supply above, it’s the time to sell.

What Make The Supply Above A Great Level For Sell Position 14/05As we can see on the 1D chart, the USDCAD price is struggling to move up, this kind of price behavior called “Compression“, the price move up step by step in a way that looks powerless, many Small candles, everything seems pressed, above us, there is a great supply which most probably holds many unfilled orders, that indicates a strong level, the combination of a price move up by Compression and a supply level creates a great opportunity for sell position, when the price touch the supply above, it’s the time to sell.
USDCHF Trading Plan Naked Chart Education1. Sideway at Supply Zone (DISTRIBUTION)
==>> Place Sell Limit at resistance zone
==>> Stop loss should be 30-50pips above shadow
==>> BIG LOT advice = you must know how big your capital is and risk with lot equivalent to 100 pips
2. Breakout Tips (For Short Scenario on this USDCHF)
==>> Wait until break confirmed with new Lower Low
==>> 25% CHANCE price will continue its drop
==>> 25% CHANCE price will retrace and form Drop (Breakout) - base - rally (FTB First time back) - base - drop (elliot Wave correction)
==>> 25% CHANCE price will form Drop - Base - Drop
==>> 25% CHANCE priice will Break lowest low then Rally up again canceling bearish scenario (Fail to Break / manipulation / SL Hunter / Take Pending Order)
3. COMPRESSION / CONTINUATION
==>> its similar to these patterns = FALLING/RISING WEDGE, DESCENDING/ASCENDING TRIANGLE
==>> when price retrace or forming corrective move, that means Price already comeback to S/D to take Pending order and those areas considered as CLEAR no order placed again
HENCE there is no significant support/resistance and BIG DROP or Rally Likely are likely happen..
GoodLuck, Take your time to study MARKET BEHAVIOUR to refresh your mind and get clearer perspective what is market telling you....

Hasbro Gap HeldHAS gapped up on strong earnings news. The gap is a breakaway and is now in a compression mode. Balance of Power shows some pro trader activity in the stock at this time. The next resistance level is the highs of September. This is a swing or day trading setup.

VRSN Compression Gaps on NewsVerisign Inc. had a typical compression pattern and then gapped on good news. The gap is a breakaway due to the pattern of the consolidation.

HFTs Make a Mistake on CELGCelgene Corp has had 3 HFT gaps this year. The first was gigantic. Then HFTs made a mistake and gapped the stock down. This resulted in Pro Trader buying at that lower level. Recently it gapped up and is in a compression mode.
C

TWTR: Completion pattern imminent following strong earningsTWTR gapped beyond the trading range highs after a strong earnings report. If TWTR can hold above the prior trading range highs, this will be a completion pattern. Note the compression of price near the highs of the trading range prior to this big gap.

Crude WTI Oil Short 1 Hour Trade IdeaCrude Oil Short
After seeing the first drop at 60.25, oil has been declining ever since.
And a bearish flag pattern is seen on the 1 hour.
I see this as a CP (Continuation Pattern)
To tie in this thought, I also see compression into demand where buyers keep buying until it reaches an area where supply exceeds demand and it quickly falls,
Within that blue zone, price will form supply once more and freefall.
This is a high probability, low risk trade forming.
Easy 6R trade!
Until next time beloved!

USDJPY Long Trade Idea (SHORT TERM)Last week saw a decline in USDJPY. After seeing this decline, i expect price to rally for the short term which would give sellers ample time to get in the market to continue the decline.
You will now see compression into demand where demand zones will keep on creating until price meets a strong supply zone up top. That's where our TP will be, because near that area is where the huge sell-off came from last week and that was no fluke!
Take care til we meet again!
P.S.: I entered this trade a few minutes ago myself so I have my stoploss below this daily candle low.
