BTC – The Perfect Intersection!I called this area the "perfect intersection" for a reason.
BTC is now reacting around a level where everything lines up:
- the lower blue trendline
- the 90,000 round number
- a clear demand zone
- and prior structure acting as support
When multiple factors meet at one place, I pay attention.
As long as BTC respects this zone, the path remains open for another push higher.
If buyers step in here and defend it, I’ll be looking for continuation rather than guessing tops.
⚠️ Disclaimer: This is not financial advice. Always do your own research and manage risk properly.
📚 Stick to your trading plan regarding entries, risk, and management.
Good luck! 🍀
All Strategies Are Good; If Managed Properly!
~Richard Nasr
Confluence

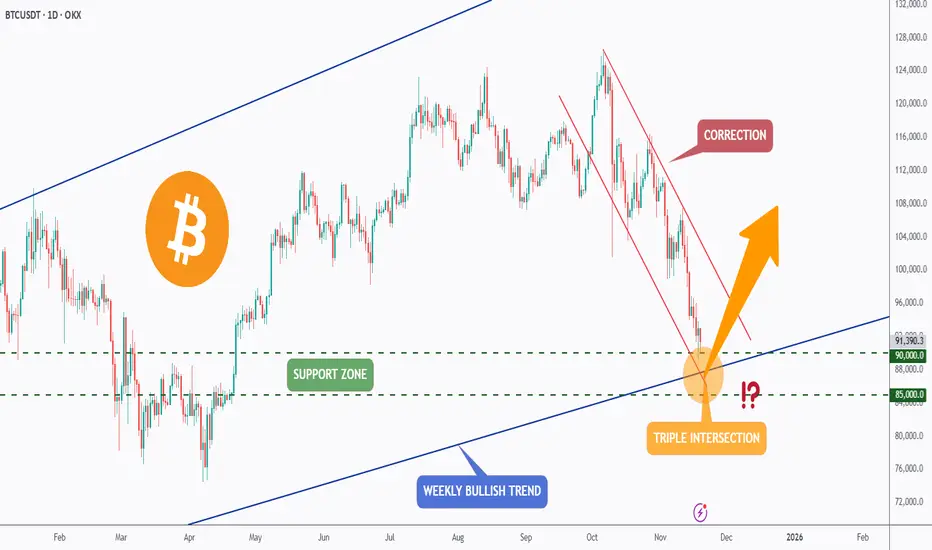
BTC - Triple Intersection… Now or Never for the Bulls?Bitcoin has been in a steep correction for weeks, sliding inside a clear falling channel. Despite the heavy sell-off, price is now approaching one of the strongest confluence zones on the entire chart, a triple intersection.
This key level combines:
1- The major weekly bullish trendline
2- The horizontal support between $85,000–$90,000
3- And the lower boundary of the falling corrective channel
This kind of alignment doesn’t happen often. It’s the area where long-term bulls typically show up.
As long as BTC holds above $85,000–$90,000, the macro bullish structure remains intact. A strong reaction here could trigger a reversal and kick off the next impulsive wave upward. However, if this triple confluence fails, the market may face a deeper correction before stabilising.
We’re standing at a decisive moment… will this zone ignite the next bullish leg or break down into another wave of fear? 🤔
⚠️ Disclaimer: This is not financial advice. Always do your own research and manage risk properly.
📚 Stick to your trading plan regarding entries, risk, and management.
Good luck! 🍀
All Strategies Are Good; If Managed Properly!
~Richard Nasr.
EUR/GBP – Corrective C Wave in PlayPrice already tapped the black BC, suggesting the first correction leg is done.
Now, the pink wave’s C target aligns perfectly with both the descending trendline and the order block — a strong confluence zone likely to induce liquidity before a deeper retracement of the black wave.
Setup remains valid as long as the black B isn’t broken. A break above B would invalidate the sequence and shift market structure bullish.
Strengths:
Trendline + order block + C target alignment
Internal correction forming cleanly within larger structure
Clear invalidation and strong confluence logic
Weaknesses:
Liquidity sweeps may occur before confirmation
Requires patience for MSS confirmation before entry

TSLA: Watching Prior Resistance Turn into Key SupportIntroduction & Thesis
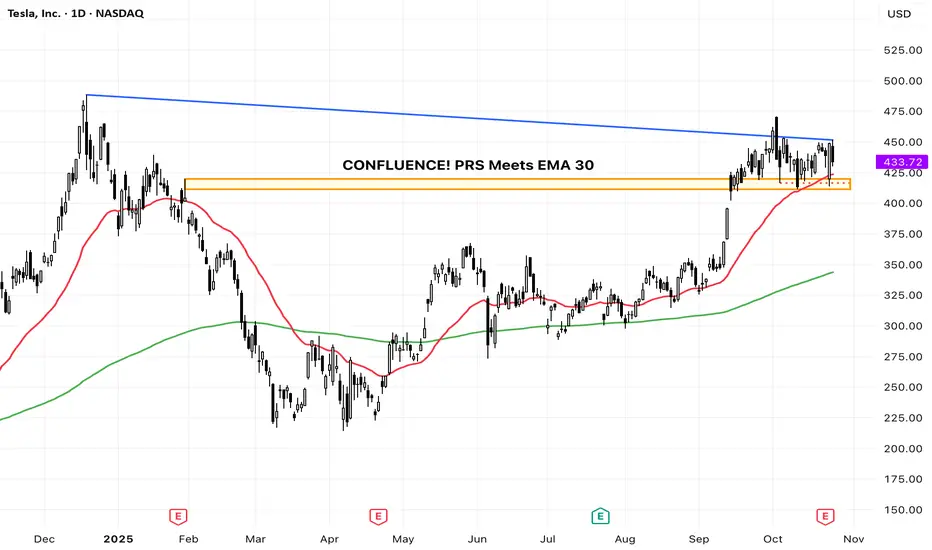
Tesla ( NASDAQ:TSLA ) is currently presenting a textbook technical setup on the daily chart. After a strong uptrend from May to October, the price has pulled back to a critical zone that previously acted as heavy resistance in early 2025. This analysis explains why this level is a crucial 'make-or-break' point for the bulls.
The Breakout and The Retest
Observe the orange rectangle (approx. $410 - $425). This region was a significant ceiling for the price action earlier this year. According to technical theory, once a strong resistance level is decisively broken (which occurred in September), it is expected to flip its role and become a crucial support level. This is often referred to as a Prior Resistance Turned Support (PRS) area.
The price is currently pulling back right into this PRS zone, a common and healthy movement known as a retest.
Confluence of Support
Crucially, the 30-day Exponential Moving Average (EMA 30), which defines the short-term trend, is also converging with this key support zone. This creates a powerful confluence of support, significantly increasing the probability of a bounce. The long-term trend, indicated by the upward-sloping 200-day EMA (green line), remains firmly bullish, supporting the overall upward bias.
Scenarios
🎯 Bullish Scenario (The Bounce)
If the $410 - $425 zone holds and we see a strong bullish rejection candle (e.g., a hammer or engulfing pattern), it would confirm the support flip, suggesting the next leg of the rally towards the recent highs around $475.
🛑 Bearish Scenario / Invalidation (The Failure)
Conversely, a sustained daily close below $410 would be a crucial failure signal. This would invalidate the bullish retest thesis and suggest a deeper correction is underway, likely targeting the next major support zone around the 200-day EMA (currently near the $343 region).
📚 Educational Takeaway
This setup perfectly illustrates how traders look for confluence. The strongest support zones are those where multiple technical factors—like a former resistance level (PRS) and a strong moving average (EMA 30)—converge. A successful bounce here reinforces the power of market structure principles.
(Disclaimer: This is for educational purposes only and not financial advice.)
GBPUSD Short Confluence and stacking the oddsFPMARKETS:GBPUSD
Fundamental: Bearish (5/5).
Technical: Bearish (7/7) — Diamond Vault (7-Stack) candidate; SL=0.0121, TP distance=0.0314.
Weak UK inflation and growth; dollar steadies. Trend structure bearish across EMAs; momentum favors sellers while rebounds face supply overhead.

USDJPY Long #confluence country #trade the stacks. OANDA:USDJPY
Fundamental: Bullish (5)
Technical: Bullish (6/7) — actionable threshold met (≥6)
20-word summary: Dollar-yen supported by rate differentials; EMAs aligned; momentum constructive; watch 152 zone and intervention risk while trend persists this week.
Actionable Trade (Long): ATR 1.181 → SL distance 1.79512; Stop 150.08088; TP 156.54331 (2.6R).

EURJPY Long Confluence between fundamental & TechnicalOANDA:EURJPY
Fundamentals: Bullish — 5 Stacks
Technicals: Diamond Vault Bullish — 7 Stacks
Summary: Strongest dual confirmation; macro and momentum align perfectly. Carry advantage, ECB tone, and ADX strength sustain powerful uptrend.
This pair is ready to jet higher.
Good luck.

Copper Long 5/6 Special.Fundamental: 5 | Technical: 6 StacksCAPITALCOM:COPPER COPPER We trade with the odds stacked in our favour. That's confluence. Fundamental: 5 | Technical: 6 Stacks. That was we like to call the perfect trade. No such thing however when the stars align we pull the trigger. Copper supported by infrastructure demand and tight supply; technicals show sustained strength near
$4.90.

EURJPY Long 5 Fundamental Stacks 7 Technical Tacks. Confluence OANDA:EURJPY
We are trading odds on every trade that is our edge. Its a big edge especially when we have 5 fundamental stacks and 7 Technical stacks. The reason why we do this is so when we close our eyes and night and wake up the next day we are pretty sure we know the outcome. This method fused with proper money management is a sure fire winning strategy over time. We need to be able to sustain 4 or 5 maybe 7 loses and remain in the game so don't trade more then your account can handle. Stop losses are your best friend and you should always remember that. I wish you all the best of luck. Happy Trades.

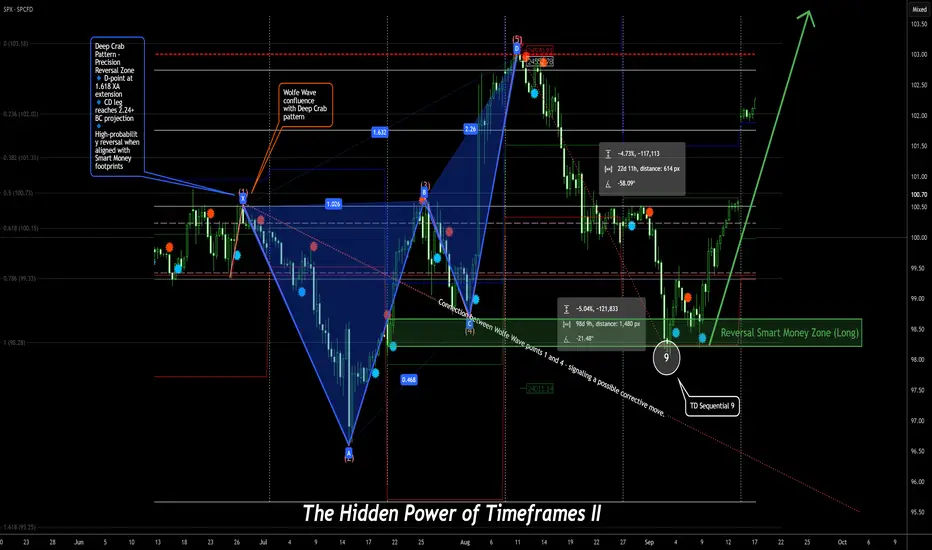
The Hidden Power of Timeframes – Part 2 🔮 The Hidden Power of Timeframes – Part 2 Connection Confluence” – The Invisible Architecture of Precise Trades
Seeing the Invisible
Welcome to Part 2.
If Part 1 gave you clarity on how timeframes interact, we now go one level deeper — into the unseen forces that move beneath the surface of every chart.
🧠 The question is:
“How can I recognize where structure is headed — before it even forms?”
🧠 It’s Not Just About Alignment – It’s About Multi-Timeframe Confluence
The magic doesn’t lie in one indicator or one pattern.
It’s born in the interplay of powerful concepts:
🌀 Wolfe Waves forming at the edges of Order Blocks
🧬 Harmonic Patterns merging with RSI or MACD divergences
🔢 TD Sequential counts signaling exhaustion at precise turning points
🕯️ Japanese Candlesticks confirming what orderflow already whispers
🔐 Smart Money footprints revealing where the crowd dreams — and where those dreams get crushed
This is more than technical analysis.
This is about reading intention — before it becomes visible.
⏳ Multi-Timeframe Fractals – The Echo of the Market
The market is fractal.
What unfolds on a 15-minute chart can mirror the Daily — and often previews the next big move on the Weekly.
📌 Example Scenario:
✅ Bullish divergence on the 4H chart
✅ Aligns with a Gartley pattern on the Daily
✅ Completes just as a TD9 count signals exhaustion on the Weekly
✅ While retesting a monthly liquidity pool
That’s not coincidence — that’s Signal Confluence.
And those who read it are always one step ahead of the market.
🛰️ Smart Money & Orderflow – Trade the Why, Not Just the What
Smart Money doesn’t chase candles.
It trades intent, imbalance, and psychology.
🛠️ Tools of the Trade:
Fair Value Gaps (FVG)
Order Blocks
Liquidity Sweeps
Breaker Blocks
Displacement & Inducement
Retail traders chase patterns.
Smart Money chases the dreams of retail.
🔗 The Real Edge: Seeing Connections Others Miss
A Wolfe Wave is just a shape
An Elliott Wave is just a count
A TD9 is just a number
But when…
🌀 A Wolfe Wave forms during the 5th Elliott Wave
🔢 Ends with a TD9 at a liquidity high
🔐 Inside an Order Block...
💥 That’s not just technicals — that’s chess on the chart.
That’s how real precision is born.
That’s how you anticipate moves weeks — or even months — in advance.
🧭 The Meta Skill: Navigating Confluence Across Timeframes
You don’t need to know everything.
You just need to:
✔️ Recognize when timeframes align
✔️ Feel where systems converge on one idea
✔️ Avoid forcing trades when there’s no synergy
✔️ Only act when the market’s story is consistent across all levels
A true edge doesn’t come from more tools —
It comes from clarity in complexity.
🧩 Bonus Insight: Alignment Within a Single Timeframe
Timeframe confluence is powerful.
But don’t underestimate the strength of multiple high-probability signals inside just one timeframe.
Example:
In a 4H chart:
Wolfe Wave
Harmonic Pattern
Orderflow Zone
Divergence
…all pointing to the same reversal area.
That’s not clutter — that’s weighted confluence.
These moments often deliver the most decisive trades.
💬 Comment below – or share this with someone who’s always fighting their own timeframes.
🚀 Let’s trade with precision — not prediction.
NEAR — Prime Swing Setup at $2.5NEAR is shaping up for a high-probability swing trade, and the chart is lining up beautifully. The $2.5 zone is packed with confluence, making it one of the most attractive long opportunities on NEAR in a while.
Confluence Support Zone
Previous Monthly Open (Key Level): $2.535
0.786 Fib Retracement: $2.506
Liquidity Pocket: Sitting right at this zone
📌 Together, these factors make the $2.53–$2.50 area a critical support level to watch.
🟢 Long Setup
Entry: $2.53–$2.50 zone
Stop-Loss: Below monthly open at $2.366
Target: $4 (major resistance + TP zone)
Potential Gain: ~+50% if played to target
R:R 1:7+
Trade Outlook
If NEAR reacts strongly off the $2.5 zone, this setup could unfold into a powerful swing trade. The structure suggests this could be the launchpad for the next leg higher.
As always, confirmation is key: I’ll be watching closely for a clean reaction before committing fully. Profit-taking decisions will be refined as price action develops, but the $4 level stands out as the main TP zone.
Indicators used
DriftLine — Pivot Open Zones → For identifying key yearly/monthly/weekly/daily opens that act as major S/R reference points
➡️ Available for free. You can find it on my profile under “Scripts” and apply it directly to your charts for extra confluence when planning your trades.
_________________________________
💬 If you found this helpful, drop a like and comment!

The Power of Confluence – Turning Chaos into Clarity!Most traders lose because they jump on the first signal they see. A trendline break, an RSI crossover, a candlestick pattern… But in isolation, these signals are weak and often misleading.
The market rewards patience and confluence; when multiple factors align at the same level, turning noise into clarity.
📈 Why Confluence Matters
Think of trading signals like witnesses in court. One alone may be unreliable. But when several confirm the same story, the probability of truth skyrockets. The same applies to trading setups.
🔑 Types of Confluence
- Structure + Trendline: A horizontal support aligning with a rising trendline.
- Fib + Zone: A 61.8% retracement overlapping with a demand area.
- Pattern + Level: A double bottom forming right on a key support.
- Multi-Timeframe: Weekly support intersecting with a daily trendline.
- The more elements lining up, the stronger the zone becomes.
📊 Example
Imagine Bitcoin approaching $107,500. On the weekly, it’s a major structure. On the daily, a falling wedge support. On the 4H, RSI is oversold. Alone, each signal is average. Together, they form a high-probability buy zone.
⏳ The Takeaway
Confluence isn’t about predicting the market; it’s about stacking probabilities in your favor. Instead of chasing every move, wait for the market to whisper the same message from different angles. That’s where consistency is built.
What’s your favorite type of confluence setup? 🤔
⚠️ Disclaimer: This is not financial advice. Always do your own research and manage risk properly.
📚 Stick to your trading plan regarding entries, risk, and management.
Good luck! 🍀
All Strategies Are Good; If Managed Properly!
~Richard Nasr

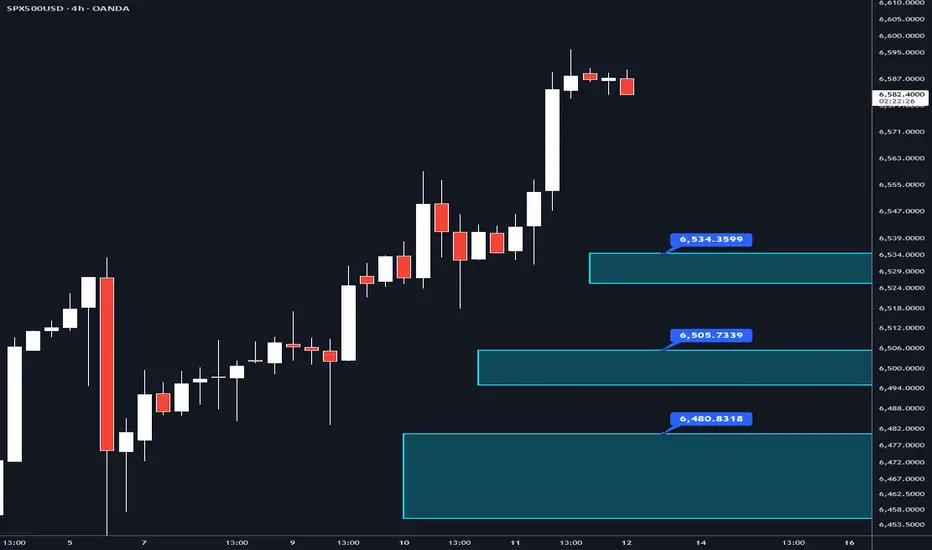
SPX500USD – Important Levels Below (Watch for Next Week)The S&P 500 is holding near all-time highs. When markets sit at extremes, it’s useful to map out where the structure lives underneath. These are levels that:
Could act as strong support if price pulls back (buy interest).
Or, if broken, could accelerate downside momentum into deeper zones.
Here are some confluent areas to keep in mind for next week (as today is Friday):
6.525 – 6,534 → Weekly vWAP, weekly time POC, and a poor low.
6,495 - 6,506 → Naked weekly POC and naked daily POC.
6,455 – 6,479 → Naked daily, naked weekly, monthly vWAP, daily naked POC, weekly naked POC, current monthly POC, and weekly time naked POC. So clearly the biggest level to watch!
Why these matter: when multiple levels overlap (VWAP, POC, HTF highs/lows, etc, liquidity often pools there. That makes them “decision points” — either support for a bounce or, if broken, fuel for a larger move down.
If you’re new to terms like VWAP or POC, don’t worry — they can be confusing at first. Leave a comment and I’ll happily explain, or DM me if you prefer to ask privately.
This post is for educational purposes only. It is not financial advice or a trading signal.
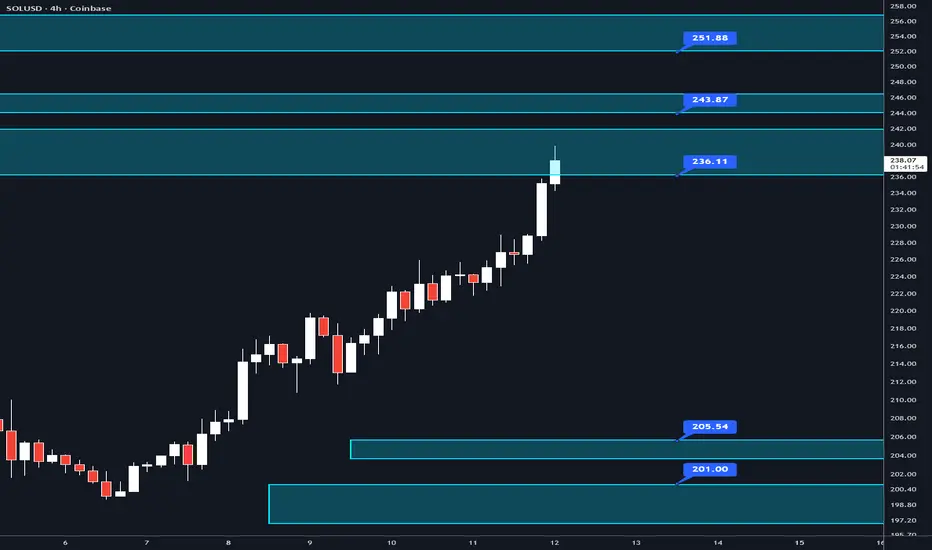
SOLUSD – Key Confluence Levels to WatchHere are some levels on SOLUSD worth noting. The goal is to show how confluence builds around certain areas of price, not to predict direction.
$197 - $201 → Naked weekly level, two naked daily levels, daily naked POC, poor low, and a naked weekly VAL.
$203.50 - $205.50 → Current monthly POC, weekly naked POC, and a poor low.
WHERE SOL IS NOW: $237 - $242 → All time high range POC which is extremely important, and weekly naked VAH.
$244 - $246.50 → Important wick high, all time high range VAH, and a single print.
$252 - $256.50 → Naked weekly, monthly naked POC, weekly naked POC, daily naked POC, weekly time POC, and a naked daily level.
When multiple levels line up (high timeframe levels, point of controls, value areas, liquidity levels, TPO levels, etc), the level tends to attract more attention and liquidity. That makes it an important ‘decision point’ — even without predicting bullish or bearish outcome.
If you’re new to concepts and levels like these, don’t worry — these terms can feel overwhelming at first. Feel free to drop a comment or send me a message if you’d like me to explain any of them in more detail. Always happy to help.
This post is educational only. No predictions or trade signals. If you find this helpful, follow for more breakdowns of confluence levels.
Looking for Zuari's Golden Zone - Fib RetracementZuari's fib retracement on the daily chart on the run up from 200 to 390 shows a clear pullback to 38.2% followed by a failed attempt to break 100% in a seeming double top formation around 390, invalidating immediate bullish momentum.
Daily Macd and RSI look weak with bearish divergences forming against PA, denoted with green brush lines showing both indicators with lower highs against price's equal high.
A retest of the golden zone (61.8% to 78.6%) puts us between roughly 240 and 275, which should offer a high probability zone for accumulation and eventually a bounce.
Look out for confluences of major fib levels with 1d 50ma, 99ma and 200ma. 61.8% also has a horizontal confluence with the Dec 3rd peak, and 78.6% has horizontal confluence with April 24th peak, also potentially infleuntial to support levels.

USDJPY — Bulls on Standby for a Big Comeback!USDJPY is approaching a key confluence zone where the 🟧 daily support aligns with the long-term bullish trendline.
Price has been in a medium-term correction, but now it’s knocking on the door of a potential bullish reversal.
As long as the highlighted support holds , I’ll be looking for trend-following longs targeting a continuation of the long-term bullish structure.✅
A clear break above the short-term 🔴 channel will confirm the shift in momentum and open the door for the next 📈 impulse move.
📚 Always follow your trading plan regarding entry, risk management, and trade management.
Good luck!
All Strategies Are Good; If Managed Properly!
~Richard Nasr
Disclosure: I am part of Trade Nation's Influencer program and receive a monthly fee for using their TradingView charts in my analysis.

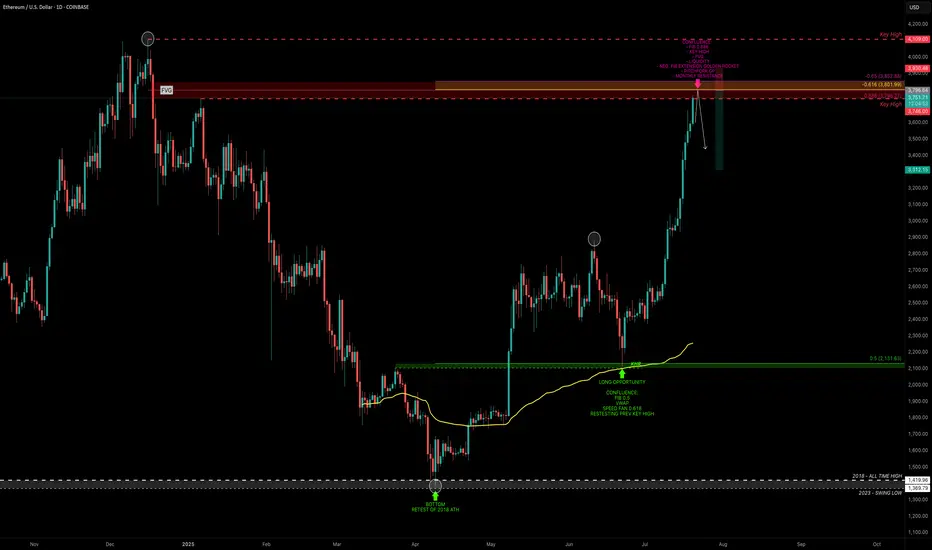
ETH — Rally Exhaustion or More Upside?ETH has been on an absolute tear. After retesting its old 2018 all-time high, it marked a bottom at $1383 — a brutal -66% correction over 114 days from the $4109 top.
From there, ETH ripped +100% in just one month, followed by 40 days of consolidation, and now, over the past 28 days, it’s surged another +76%, currently trading around $3715 — all without any major correction.
So the big question:
What’s next? Are we near a short setup, or is it time to long?
Let’s break it down.
🧩 Key Technicals
➡️ Bounce Zone:
On June 22, ETH retested the 0.5 fib ($2131.63) of the prior 5-wave Elliott impulse, with extra confluence from:
Anchored VWAP
Speed fan 0.618
➡️ Key Highs to Watch:
$3746 → recent local high
$4109 → 2021 all-time high
➡️ Fib Retracement Levels:
ETH has smashed through all major fibs, including the golden pocket (0.618–0.65) and 0.786 fib. The 0.886 fib at $3798.27 is the last major resistance, just above the $3746 key high.
At this zone, we also have:
Fair Value Gap (FVG)
Monthly Resistance
Negative Fib Extension Golden Pocket Target
➡️ Momentum Signal:
ETH is currently on its 8th consecutive bullish daily candle — historically, after 8–13 consecutive candles, price tends to cool off or correct. A sign to be cautious about longing here and consider profit-taking.
🔴 Short Trade Setup
Look for a potential SFP (swing failure pattern) at the key high $3746 to initiate a short trade.
This offers a low-risk setup with:
Entry: around $3746 (if SFP confirms)
Target (TP): ~$3300
Stop-loss: above SFP
R:R ≈ 1:4+
💡 Educational Insight: Why You Don’t Want to Long the Top
Markets often trap late longers near key highs or resistance zones — this is where smart money distributes while retail piles in emotionally.
Lesson: Look for zones of confluence (fib, VWAP, liquidity, FVG) and avoid chasing extended moves after multiple bullish candles.
Patience and confirmation at reversal points lead to higher-probability setups — you don’t need to catch every pump.
Final Thoughts
We’re approaching major highs, so this is a time for caution, not FOMO. Watch for reaction and potential reversals near $3750–$3850.
Stay sharp, manage risk — and remember, tops are where longs get trapped.
_________________________________
💬 If you found this helpful, drop a like and comment!
Want breakdowns of other charts? Leave your requests below.
The Power of Confluence: Building Trade Setups Using 3 Indicator🔵 INTRODUCTION
Many traders fall into the trap of relying on a single indicator to make trading decisions. While one tool might work occasionally, it often leads to inconsistent results. The key to consistency lies in confluence — the strategic combination of multiple indicators that confirm each other.
In this article, you'll learn how to build high-probability trade setups by combining three essential components: trend , momentum , and volume .
🔵 WHY CONFLUENCE MATTERS
Confluence refers to multiple signals pointing in the same direction. When different indicators agree, your trade idea becomes much stronger. It helps reduce noise, avoid false signals, and increase confidence in your entries.
Think of it like crossing a busy road: you wait for the green light, check both sides, and make sure no cars are coming. The more confirmations you have, the safer your move.
🔵 WHAT IS CONFLUENCE IN TRADING?
Confluence means agreement. In trading, it’s when different methods, indicators, or tools all point toward the same outcome.
Think of it like this:
One green light? Maybe.
Two green lights? Worth watching.
Three green lights? That’s a trade worth considering.
Imagine you're planning a road trip. You check the weather forecast (trend), Google Maps traffic (momentum), and ask a local for advice (volume). If all three say “go,” you’re more confident in your decision. Trading works the same way — using multiple tools to validate a setup reduces risk and removes guesswork.
Important: Confluence is NOT about cramming 10 indicators onto your chart. It’s about using a few that each offer different types of information — and only acting when they align.
🔵 THE 3-STEP CONFLUENCE SETUP
1️⃣ Identify the Trend (Using EMAs)
Before entering any trade, you need to know the market direction. You can use:
Moving Averages (e.g., 21 EMA and 50 EMA crossover)
Structure-based analysis (e.g., higher highs = uptrend)
Trade only in the direction of the prevailing trend.
2️⃣ Check Momentum (Using RSI, MACD, or Stochastic)
Momentum tells you whether the market supports the current trend or if it's weakening.
RSI above 50 → Bullish momentum
MACD histogram rising → Acceleration
Stochastic crossing above 20 or 80 → Momentum shifts
Avoid entering when momentum is fading or diverging from price.
3️⃣ Confirm with Volume (To Validate Participation)
Volume reveals the strength behind the move. A breakout or trend continuation is more reliable when it's backed by volume.
Look for:
Volume spikes at breakout points
Increasing volume in the direction of the trend
Volume confirmation after pullbacks or retests
No volume = no conviction. Watch how the market "votes" with actual participation.
🔵 EXAMPLE TRADE SETUP
Let’s say you spot a bullish trend with 21 EMA above 50 EMA. RSI is above 50 and rising. A pullback forms, and volume picks up as price starts to push higher again.
That’s trend + momentum + volume lining up = a confluence-based opportunity.
🔵 BONUS: HOW TO ENHANCE CONFLUENCE
Add price action patterns (flags, wedges, breakouts)
Use support/resistance zones for cleaner entries
Combine with higher timeframe confirmation
Wait for retests after breakouts instead of chasing
Confluence doesn't mean complexity — it means clarity.
🔵 CONCLUSION
The best traders don’t guess. They wait for the market to align. By combining trend, momentum, and volume, you filter out weak setups and focus only on the highest-probability trades.
Start testing confluence-based setups in your strategy. You’ll likely find more consistency, fewer fakeouts, and greater confidence in your execution.
Do you trade with confluence? What’s your favorite trio of indicators? Let’s talk in the comments.

How To Filter Signals On The 1 Minute Scalping IndicatorThis tutorial shows you how to use external indicators to filter out signals on the 1 Minute Scalping Indicator so that you only get signals that are in the direction of the trend.
Step By Step Process:
1. Pick an external indicator that provides an output value of 1 for bullish, -1 for bearish or 0 for neutral and add it to your chart. We have multiple indicators that can do this, but you can also customize your own indicators to provide this value and use that to filter out signals.
2. Set your desired trend parameters on your external indicator and make sure that indicator is on the same chart as the 1 Minute Scalping Indicator.
3. Go to the indicator settings for the 1 Minute Scalping Indicator and turn on one of the 3 available External Indicator Filters. Then from the dropdown menu, select the external indicator you want to use and make sure to choose the output value that gives the 1, -1 or 0 output for trends. Our indicators will have an output titled "Trend Direction To Send To External Indicators" to make that value easy to find in the dropdown menus.
That's it! Let the 1 Minute Scalping Indicator reload with the external indicator trend values and it will only show buy signals during bullish trends, only show sell signals during bearish trends or no signals during neutral markets. Make sure to back test your setup until you find the best external indicators and settings to use that work best for your trading style and then apply that setup to any chart you would like.
Here is the code you can use to add a trend value to your own custom indicators and send it to the 1 Minute Scalping Indicator:
trendDirection = 0
if close > ema1
trendDirection := 1
else if close < ema1
trendDirection := -1
else
trendDirection := 0
plot(trendDirection, title="Trend Direction To Send To External Indicators", color=#00000000, display=display.data_window)
Change the (close > ema1) and (close < ema1) to use your own variables from within your script.

Examples of invalid setups | Judas Swing Strategy 07/04/2025As traders, it's crucial to spend time in the lab backtesting your strategy and exploring ways to optimize it for better performance in live markets. You’ll start to notice recurring patterns, some that work in your favor, and others that consistently lead to unnecessary losses. It might take time to spot these patterns and even longer to refine them to fit your trading system, but going through this process is what helps you evolve. In the long run, this is what you need to do to become a better trader.
We spent a considerable amount of time refining our entry technique for the Judas Swing strategy after noticing a recurring issue where entering with a limit order sometimes gets us stopped out on the very same candle. After testing a few alternative entry methods and making some key adjustments, we finally found an approach that worked consistently for us. On Monday, April 7th, 2025, this refinement proved its worth by saving us from two potentially painful losses. In this post, we’ll walk you through exactly what happened and how the improved entry made all the difference.
We got to our trading desks ready to scout for setups and were drawn to promising setups forming on both FX:AUDUSD and $NZDUSD. This was exciting since the previous week offered no solid trading opportunities. As price swept the liquidity resting above the highs of the zone our bias quickly shifted toward potential selling setups for the session. But before taking any trade, we always ensure every item on our entry checklist is met. Here’s what we look for:
1. A break of structure to the sell side
2. The formation of a Fair Value Gap (FVG)
3. A retracement into the FVG
4. Entry only after a confirmed candle close
With the first two requirements on our checklist confirmed, all that remained were the final two and at this stage, patience is key. As price began retracing toward the FVG on both FX:AUDUSD and OANDA:NZDUSD , things got interesting. Price came into the Fair Value Gap on both pairs, checking off the third requirement. Now, all that was left was to wait for the current candle to close.
But that’s where things will be clear to you now.
Had we jumped in early with a limit order, we would’ve been stopped out on the same candle. This moment served as a perfect reminder of why we now wait for a confirmed candle close before taking any trade. It’s this extra step that helps us avoid unnecessary losses and stick to high-quality setups.
This entry technique like any other, comes with its own set of pros and cons. At times a limit order might offer a more favorable entry price compared to waiting for a candle close and that can influence both your stop-loss and take-profit placements. On the flip side, there are also instances where waiting for the candle close gives you a better entry than the limit order would have. That’s why it’s so important to backtest.
Your job as a trader is to put in the time to study and test what works best for your system. We chose this candle close entry method because we did the work. After extensive backtesting and data analysis, we found this approach aligns best with the results we aim for in the long run.

SUI’s Wild Ride – Finding the Next Long Trade SetupSUI had an incredible 2024, skyrocketing +1060% in just 154 days. The price peaked at the psychological $5 mark, where multiple rejections signaled a momentum shift. By the end of January 2025, the trend turned bearish, leading to a sharp correction.
Trend Shift & Momentum Analysis
I've been working on a new trend identifier indicator that helps spot trends, allowing traders to identify swing trade opportunities and manage their positions effectively. This indicator clearly highlighted the momentum shift, confirming the bearish turn and the sharp price drop that followed.
Key Support Zones & Confluences
Now that the bearish trend is in play, the focus is on identifying a solid long opportunity:
Point of Control (POC) from Previous Trading Range (~$2) – A major psychological level that many traders are watching
Trend-Based Fibonacci Extension (1:1) at $2.0373 – Adding confluence to this critical support area
Fib Speed Fan (0.75 Level) – Aligns with the $2 region, reinforcing support
Anchored VWAP (~$1.885) – From the 2023 lows, acting as an additional support zone
What’s Next for SUI?
The market is in search of a strong support level where bulls can regain control. Let’s see if we find support at the $3 mark. The $2 zone stands out as a prime area for a potential long entry, given the multiple technical confluences. If price reaches this level, we’ll be watching closely for confirmation of a bullish reversal.
Final Thoughts
SUI has had an extraordinary run, but corrections are natural in strong trends. The key now is to see where price stabilises and if the bulls can make a strong comeback. Time will tell how this plays out, but for now, $2 is a level to keep an eye on for a potential long setup.
BTW: I've just launched a FREE TradingView indicator – Multi Timeframe 8x MA Support & Resistance Zones. It helps visualise key support and resistance levels across different timeframes. Check it out and let me know your thoughts!

BTC Scaling Strategy: Trade Like a Pro with Precision EntriesIf you’re new to trading, this guide will walk you through a scaling in and out strategy. We’ll cover:
Risk management – protecting your capital.
Entry points – how to build your position gradually.
Exit points – how to lock in profits while leaving room for further gains.
Maximising profit – using a small runner to capture additional upside.
By the end, you'll understand:
✅ How to enter trades at optimal levels
✅ How to take profits gradually
✅ How to manage risk so you don’t blow your account
BTC Market Analysis
Bitcoin has been trading in a tight range for over 100 days near the 100K mark. For 22 consecutive days, bulls have tried to break above 100K, but as the price nears this level, bears consistently rejected the move. Currently, BTC broke below our critical support level at 90K confirming a breakdown in market structure. Adding fuel to the bearish fire, Bitcoin has slipped below the weekly 21 EMA (89,503) and SMA (90,437). With the bears now in control, the critical question emerges: Where will Bitcoin find its next foothold? Let’s map the high-probability support zones and strategic entry points for the next potential long opportunity.
Using Fibonacci analysis:
Fib Speed Fan: With a low of 49K and an ATH of 109,588 (from March), the 0.618 trend line projects support between about 78K and 82K.
Anchored VWAP: When anchored from 49K, the VWAP support is around 81.7K.
Negative Fibonacci Retracement: From the ATH down to the current low at 91,231, the –0.618 level is at about 79,886.
Fib Extension & Retracement: Additional levels lie around 79,466 (1.618 extension) and 79,230 (0.5 retracement).
Moving Averages: The 233 EMA/SMA currently ranges between roughly 83K and 78.5K.
These indicators converge to form a robust support zone between approximately 83K and 78K. For a more detailed breakdown, please check my previous Bitcoin analysis, where I conducted a deeper examination.
Step 1: Understanding Risk Management (The Golden Rule)
Before placing a trade, you must decide:
📌 How much you’re willing to lose (risk per trade)
📌 Where you’ll enter and exit (never place a trade without a plan)
How Much Should You Risk?
Always risk no more than 1–2% of your total account on a single trade.
Example (for a $100K Account):
1% Risk = $1,000 max loss
2% Risk = $2,000 max loss
For this trade, we plan to risk about $1,366, which is approximately 1.37% of a $100K account. This disciplined approach protects your capital over the long run.
Step 2: Where Do We Enter the Trade? (Scaling In)
Instead of going all-in at one price, we break our $30,000 investment into 10 smaller entries and exits. This method reduces risk and often achieves a better average entry price.
💡 Why? Because no one can time the exact bottom! Spreading entries reduces risk and gets a better average entry price.
www.tradingview.com
BTC Buy (Entry) Levels
We will buy BTC as it falls from $83,050 down to $78,050 using the following allocation percentages:
Entry # Price (BTC) % of Position Amount Invested ($) BTC Acquired
1 83,050 5% $1,500 1,500 ÷ 83,050 = 0.018072
2 82,550 5% $1,500 1,500 ÷ 82,550 = 0.018181
3 82,050 5% $1,500 1,500 ÷ 82,050 = 0.018278
4 81,550 8% $2,400 2,400 ÷ 81,550 = 0.029430
5 81,050 8% $2,400 2,400 ÷ 81,050 = 0.029606
6 80,550 10% $3,000 3,000 ÷ 80,550 = 0.037234
7 80,050 12% $3,600 3,600 ÷ 80,050 = 0.044974
8 79,550 12% $3,600 3,600 ÷ 79,550 = 0.045275
9 79,050 15% $4,500 4,500 ÷ 79,050 = 0.056956
10 78,050 20% $6,000 6,000 ÷ 78,050 = 0.076352
Total Investment: $30,000
Total BTC Acquired:
0.018072 + 0.018181 + 0.018278 + 0.029430 + 0.029606 + 0.037234 + 0.044974 + 0.045275 + 0.056956 + 0.076352 ≈ 0.37436 BTC
Average Entry Price: $80,150
Stop Loss: Set at $76,500
Risk per BTC: $80,150 – $76,500 = $3,650
Total Risk: 0.37436 BTC × $3,650 ≈ $1,366 (~1.37% of $100K)
Step 3: Where Do We Exit the Trade? (Scaling Out)
We exit gradually as BTC rises between $86,950 and $91,450. The exit percentages are as follows:
Exit # Price (BTC) % of Position BTC Sold Proceeds ($)
1 86,950 5% 0.018718 0.018718 × 86,950 = $1,628.10
2 87,450 5% 0.018718 0.018718 × 87,450 = $1,637.03
3 87,950 8% 0.029949 0.029949 × 87,950 = $2,638.15
4 88,450 12% 0.044924 0.044924 × 88,450 = $3,976.39
5 88,950 14% 0.052420 0.052420 × 88,950 = $4,664.19
6 89,450 14% 0.052420 0.052420 × 89,450 = $4,691.19
7 89,950 12% 0.044924 0.044924 × 89,950 = $4,047.12
8 90,450 10% 0.037436 0.037436 × 90,450 = $3,388.20
9 90,950 5% 0.018718 0.018718 × 90,950 = $1,705.71
10 91,450 15% 0.056154 0.056154 × 91,450 = $5,137.68
Total BTC Sold: 0.018718×3 + 0.029949 + 0.044924×2 + 0.052420×2 + 0.037436 + 0.056154 = 0.374381 BTC (matches our total acquired ~0.37436 BTC)≈ $33,488.26
Profit on the Trade: Total Proceeds – Total Investment = $33,488.26 – $30,000 = +$3,488.26
Return on the Trade:
$3,488.26/$30,000×100≈11.63%
On Overall Account: For a $100K account, $3,488 represents a gain of about 3.49% if fully realised on this trade.
Risk-to-Reward Ratio: Risk = $1,366; Reward = $3,488; Ratio ≈ $3,488 / $1,366 ≈ 2.55:1
Step 4: Profit & Risk Summary
Metric – Per Trade - Based on $100K Account
Total Investment - $30,000 - $30,000 (30%)
Risk (Stop Loss) - $1,366 (4.6%) - $1,366(1.37%)
Profit (Closed) - $3,488 (11.63%) - $3,488 (3.49%)
Profit + Runner - $4,311.18 (14.37%) - $4,311.18 (4.31%)
Risk-to-Reward Ratio Calculation:
If Stop Loss Hits ($76,500):
Average Entry Price: $80,150
Loss per BTC: $80,150 – $76,500 = $3,650
Total Risk: 0.37436 BTC × $3,650 ≈ $1,366 (1.37% of a $100K account)
If BTC Reaches Our Exit Targets:
Total Proceeds: ≈ $33,488
Profit: $33,488 – $30,000 = $3,488
Profit Percentage on Trade: ~11.63%
Overall Account Impact: ~3.49% gain on a $100K account
Risk-to-Reward Ratio: ~2.55:1
Step 5: The Power of Scaling In & Out
Capital Protection: You risk only about $1,366 (1.37% of a $100K account), protecting your capital even during a series of losses.
Optimised Entry: Scaling in from $83,050 to $78,050 yields an average entry of about $80,150—significantly lower than the top price.
Profit Locking: Scaling out from $86,950 to $91,450 allows you to lock in profits at multiple levels, ensuring you capture gains along the way.
Healthy R:R: With a risk-to-reward ratio of approximately 2.55:1, your potential reward significantly outweighs your risk.
Discipline & Consistency: This structured approach minimises emotional trading and helps you stick to your plan.
Optional Note: While this guide fully closes the trade, leaving a small portion (15%) open (runner) is an option if BTC continues to rally.
Step 6: Final Pre-Trade Checklist
🔹 Support & Resistance: Is BTC trading near a strong support zone?
🔹 Technical Indicators: Is BTC holding above key moving averages (e.g., 21 EMA/SMA)?
🔹 Risk Management: Are you only risking 1–2% of your total account?
🔹 Trade Plan: Are you scaling in and out instead of going all-in? Are your entry levels and exit levels clearly defined?
🔹 Market Confirmation: Do volume, candlestick patterns, and order flow support your trade setup?
Conclusion
✅ We protect our money by limiting risk
✅ We enter trades gradually (scaling in)
✅ We take profits at multiple levels (scaling out)
✅ We fully close the trade or leave some BTC open to ride the trend higher
Final Tips:
Common Mistakes to Avoid
👉 Overleveraging – 10x leverage + 2% risk = 20% account risk!
👉 Ignoring Volatility – Tight stops on Bitcoin often trigger early exits.
👉 Never trade based on emotions. Stick to your plan, adhere strictly to your risk management rules, and let your disciplined strategy work in your favour.

NIO Has A Broken Neck! Can we take advantage?NIO is showing a textbook head and shoulders (Bearish) pattern. It is characterized by a change in market structure where the left shoulder forms the initial high and low, the head signifies the continuation and the right shoulder is the failure in the resumption of the trend. In this chart, we notice that the right shoulder fails to make a new high and proceeds to make a new low. By connecting the pivot lows, we can identify a H&S neckline near the $5 mark. We recently fell below this line which is our first signal to enter the short.
Looking for additional confluence, we note that there was significant support that was broken in the pink zone which stems from March 2024. That zone has been tested several times since March 2024. We have also broken below the 200ma which confirms the long-term downtrend. On the most recent candle, we broke below these key levels with above-average spread and above-average volume suggesting strength to the downside. Finally, since Trump has won the presidency, he vowed to increase tariffs, especially for China. This is terrible fundamental news for the Chinese stock.
Aggressive traders may take the short as is and may ride the short to the first target (~$4) which I have identified as a potential support area. There is a second target which is projected by the head and shoulders pattern (~$3.50)
For more conservative traders, we can wait for the retest of the neckline which happens to coincide with the 200 MA and sits just above the former support turned resistance. I like this level better because it provides a better risk-reward ratio.
Key notes: Earnings are coming up in a few days. This could be a volatile event that works in the trade's favor or works against it. Please be aware of that risk while trading.
GLTA
