🏛DOGECOIN BULLISH BIAS|LONG🚀
🏛DOGE_USD fell by about 70% from all time high
And we are seeing a rebound from the horizontal support
One might also see a rising support line
Which confluences with the horizontal one
Thus,I think that after some accumulation
We will see a breakout of the falling resistance
And a move upwards towards higher supply areas
LONG🚀
✅Like and subscribe to never miss a new idea!✅
Confluence

Bitcoin Analysis complete ! Inverse Head&ShouldersA little insight on the Inverse head and Shoulders
An inverse head and shoulders, also called a "head and shoulders bottom", is similar to the standard head and shoulders pattern, but inverted: with the head and shoulders top used to predict reversals in downtrends. This pattern is identified when the price action of a security meets the following characteristics: the price falls to a trough and then rises; the price falls below the former trough and then rises again; finally, the price falls again but not as far as the second trough. Once the final trough is made, the price heads upward, toward the resistance found near the top of the previous troughs.
I call a short short (a short sell)
And as always for bitcoin:
Stop Loss = 500 pips
Take profit = 5000 pips
#forex #forextrading #forexmarket #forex #freebies #forexsignals #instagram #facebook #Divergence

GBPJPY Analysis complete, 0.382 is our fib confluence zoneAfter price bounces off the 0.382 fibonacci confluence zone, it should head all the way up to 155+ which will surpass our previous idea that also went all the way to 154,660 from 153.750.
I am Long long (a long buy).

BTCUSD - Outlook Update 2021.05.24Bitcoin opened today @35201.60 with a gap up from the Saturday close @33035.15 and has traded up into a 32.8 ER / 32.8 App confluence area.
Bullish Scenario
Should price build momentum and trade above the 32.8 ER / 32.8 App confluence area, the next target area would be a break and retest of the Daily Bearish Trendline and then a continuation to target liquidity above old daily highs at the 61.8 APP / 61.8 IR confluence @33804.00 / 38108. 05 .
Bearish Scenario
Should price not be able to break above the 32.8 ER / 32.8 App confluence area @35856. 05 / 32425.90 it is anticipate price will trade lower on lack of upside momentum towards our Elliott Wave: d target level 161.8 App / 61.8 ER @22238.70 / 20948.50.
** This should not be considered trading advice. Feel free to compare my analysis to your own research.

EURAUD: Leaving Bullish Clues!Reading price, we can see we have been on an uptrend with impulses in our favored direction. The last few candle closures have shown strong wick rejections to the downside. If price manages to maintain above this new support zone, we can anticipate price to reach 1.59000. However, if price breaks support, we must reevaluate price action. Due to the uncertainty of market fluidity, risk management is highly recommended.

EURUSD: Longs to 1.23000!Reading price, we can see that EURUSD is on an uptrend with strong shifts in momentum in our potential direction. Price has cleared previous swing highs and is testing as new swing longs with a double bottom and rejection and key psychological areas. If price holds above this zone look for longs to 1.23000. If price breaks, we must reevaluate price action. Due to the uncertainty of market fluidity risk management is highly recommended.

Has the Gold Correction ended? Confluence Analysis (Daily Chart)Gold has been in a Bearish Descending Channel since August 2020 after it hit the $2070 price mark.
Price formed a Double Bottom in March at the 1680 Price Area and since then, Gold has been moving in an Ascending Channel since 20th March 2021, with the Black Uptrend line in the Chart acting as support.
Gold has broken out of the Descending Channel and is heading towards the Verified Resistance in the 1948 - 2000 Supply Area. Is the Bearish Correction/ Retracement over?? We don't know, but we are expecting a retest of the broken Trendline Resistance. This will tell us if this is a real Breakout or a Fake Breakout.
We are expecting the Retest to happen around the 1824 Area which is also a Demand Area. We have Two Strong Areas of Confluence in the Chart. The Two Buy Zones are the Green Circles in the Chart.
First Buy Area:
1752 - 1764 (Untested Support + 38.2% Fibonacci Support Level + Retest of Trendline Support)
Second Buy Area:
1808 - 1824 (Verified Support + 61.8% Fibonacci Support Level + 100 SMA H4 Chart )
The last Demand Zone is the Proven Support at the 1680 Area.
This is a very sweet Chart Setup for different types of Traders. Elliot Wave Traders, Trendline Traders, Chart Pattern Traders, Supply and Demand Traders, Price Action Traders, Fibonacci Traders.
What do you think? I would love to hear your comments and suggestions.

🏛BITCOIN RESISTANCE CONFLUENCE SHORT🔥
🏛BTC_USD broke the key level 1
And fell sharply to retest key level 2
From where we saw an impressive recovery
Back to the key level 1 which now acts as resistance
Which confluences with the falling resistance line
Which makes me bearish, and I think BTC will continue falling
To around 34.700 as a first target!
SHORT🔥
✅Like and subscribe to never miss a new idea!✅

XAUUSD Analysis complete Inverse Head&Shoulders !.Price is going to touch the confluence zone in order to form one part of the inverse right shoulder before we long price to the moon.
Let me explain what the head and shoulder pattern entail and how to trade it..
THE HEAD AND SHOULDERS PATTERN
A head and shoulders pattern is a chart formation that appears as a baseline with three peaks, the outside two are close in height and the middle is highest. In technical analysis, a head and shoulders pattern describes a specific chart formation that predicts a bullish-to-bearish trend reversal.
NORMAL H&S
Left shoulder: Price rise followed by a price peak, followed by a decline.
Head: Price rise again forming a higher peak.
Right shoulder: A decline occurs once again, followed by a rise to form the right peak, which is lower than the head.
INVERSE H&S
Left shoulder: Price declines followed by a price bottom, followed by an increase.
Head: Price declines again forming a lower bottom.
Right shoulder: Price increases once again, then declines to form the right bottom.
#forex #forextrading #forexmarket #forex #freebies #forexsignals #instagram #facebook #Divergence
If you like this post please leave a like, share, follow and most of all, engage with the post by leaving your thoughts in the comment section.

GBP/USD - TA Update and Fib EntryAt first glance this might seem like quite confusing, let's break it down for you!
We have several key levels in price marked on the chart.
We have identified the 1.40, 1.41 and 1.42 key psychological whole levels.
We have a Fibonacci drawn to highlight a potential long entry. Drawn from the swing low to the swing high, you can see the potential long entry has been highlighted after rejection from the 0.5 Fib level.
Use Fibs in confluence to optimise your trade entries.
Price is approaching the highs around 1.4164, we're expecting some rejection at this level before a potential reversal.
Hope this helps!

EURJPY: Longs Loading?Reading price action, we can see that we are in a uptrend meaning we should be looking for long-term buying opportunities. Price has recently broken resistance and is testing as new support. If price closes with the current rejection candle, we can anticipate price to push higher. However, if we break support and the trend line, we will have to reevaluate price action. Due to the uncertainty of market fluidity, risk management is highly recommended.

3M INDIA LTD. - Looking Bullish3MINDIA has formed a very good structure on a weekly timeframe.
A strong reversal from the confluence level of support trendline and horizontal support can confirm a Good Long Positional trade with 1: 4+ Risk Reward Ratio. (Target of 30000+ with SL below 23900)

EURJPY LONG . Price show strong buy momentum . At ltf, price has break previous resistance and supposedly to retest and continue moving upwards.
Reason buy :
- Confluence with TL.
- Higher TF shows QM setup for sell .
After price hit TP. We can enter sell and watch it melt like butter. Thank you

MATIC possible swing opportunityThere is a confluence of support and 0.5 fib level at that area. placing my Buy order slightly above that channel top...
placing a SL is tricky on this one, as there are other supports right below the channel top. so its up to you and your position really. the bigger the position the tighter the SL and the more likely it will get triggered.. Remember it mainly depends on BTC how deep it can retrace...
MLong

ADA Pullback and LONGBased on my predictions, ADA Will pullback to $1.17(RSI and MACD indicate short term pullback), then will test resistance at the area of confluence at $1.239 and hopefully break through to hit resistance at $1.48. I am not a financial advisor. Please invest at your own risk.

Pump, Accumulate, Pump- 2021 Roadmap Could a fib trend extension taken from July 2017 to September 2017 have had the answers to the future the entire time? A fractal of a December 2021/January 2022 blow off top like the last bull market in 2017, but this time I am applying the repetitive pump and accumulate pattern that seems to keep playing out in between key Fib Levels. Let me know what you are thinking is going to happen.
OLong

GBPJPYGang GBPJPY was called out on sunday and ranged up for a total of 150 pips, Shes now retracing back to the 50.00% off the fibb hitting the golden zone if we see more valid support then we could possibly see this climb higher and continue to take off, we need to see divergence which hasnt been shown to the upside as of now. hopefully you guys had gotten in at the entry where this trade idea was posted!

~~XRPUSD~~GANG!! XRPUSD looking sexy for a buy to the upside i went ahead and got yall covered with two very beautiful BUY LIMITS please go ahead and execute these and dont miss out ! Cryptos on the rise !

GBPJPY Long AnalysisHello!
I want to give you some information about this analysis
So .. I chose a "Buy" position because the price intersects with several confluences of mine ..
E.g.
The price is in a demand area, it intersects with my round number, daily support and daily trendline.
As we see in the picture, the price retested my area + the round number 150,000 and the Daily trendline
Many confluences-Better chance to WIN :3
So that's why I'm going on a purchase here, because I have a good feeling for this pair.
Follow me for more explicit analysis..if you like it! <3 Thanks for viewing.
If you have different opinions you can write them in the comments section <3

AUDJPY: Showing Bullish Signs!4hr Time Frame: Reading price we can see we are testing areas of support for the third time with a double bottom formation in confluence with long wick rejection. If price is able to hold, we can see bullish movement to 84.500 and if it breaks that we can see price reach 85.500. However, if price breaks support, we must reevaluate price action. Due to the uncertainty of market fluidity, risk management is highly recommended.

USD/JPY - longWe could see a retest of previous resistance here at 109.25 followed by rejection and continued bullish movement.
Will look for:
- Rejection off of previous resistance
- Rejection off 61.8% Fibonacci level
- Bullish confluence among indicators
- In line with the current uptrend
- Bullish fundamentals

NEOBTC (09-04-2021)Key Support Levels:
- Fib Retracement 0.618 level (recent swing low to swing high)
- Trendline (Two previous swing lows)
- Anchored VWAP (Second & Third previous swing lows)
- Fib Speed Resistance Fan (Second swing previous swing low to current swing high)
- Key level (Old previous POC and Local LVN)
- Monthly level (High time frame)
- Fib Channel 0.25 level (High time frame swing highs and low)
- Rising Channel Bottom (Previous - Current swing high to swing low)
So we got a lot of nice non-biased levels that coincide in one location.
I'm predicting that we will bottom out in around 2 weeks (according to fib time) plus we have plenty of reasons to bounce.
It will be nice if we see the formation of a bullish reversal pattern heading down toward these levels along with strong bullish divergences.
For example, a high time frame candlestick reversal pattern along with a mid/low time frame classic reversal pattern or a bullish harmonic pattern that provides an entry that also coincides with these support levels.

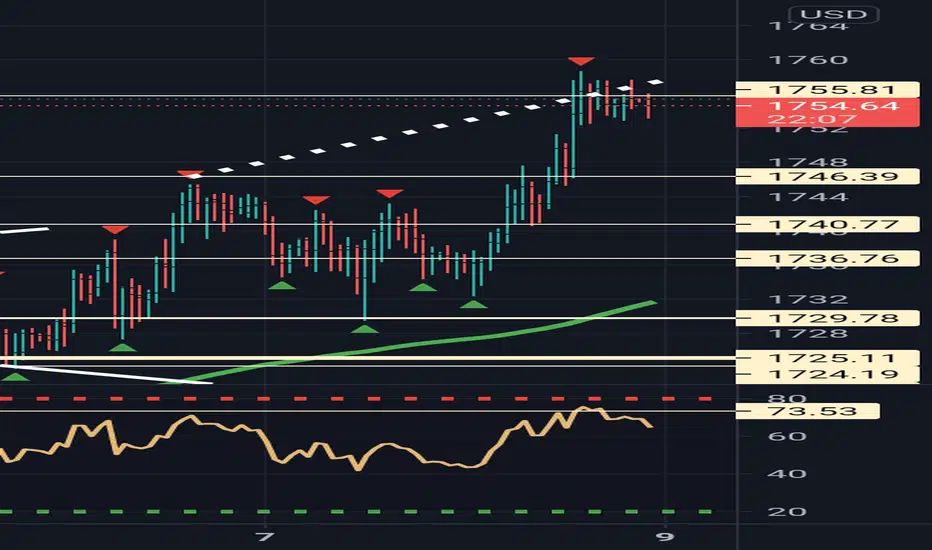
Yields are bringing the yello metal back down to restest S levelBulls have taken price all the way up and they are exhausted at the moment, is this consolidation going on meant for them to gather steam to continue their bull run or is the consolidation for testing the resistance in this level?
I believe Gold has touched a confluence over here and the bears are going to take over and bring price all the way to the 1735 area before the next major move.
Like I always state, this isn't financial advice, do your own analysis and trade wisely because trading CFD's on margin is very risky for noobs.
Have a great one!
Cheers!