ETHUSDT → Correction and hunt for liquidity ahead of growth BINANCE:ETHUSD is showing positive dynamics and breaking through the resistance conglomerate (consolidation boundary and downward correction line). The fundamental background is positive, and bulls are generally quite confident...
The cryptocurrency market, Bitcoin, and altcoins are awaiting a batch of positive news. Traders are waiting for interest rates to fall, which could attract additional capital to the cryptocurrency market, especially ETH.
The breakout of the correction resistance and consolidation resistance gives the market hope for growth. The global trend is bullish, and the fundamental background is positive. If the bulls hold their defense above 4488-4450, ETH may strengthen.
Resistance levels: 4661, 4783
Support levels: 4488, 4450
Technically, I expect a false breakdown of support (retest of the liquidity zone). If this maneuver ends with the price closing above 4488 and the formation of a confirming bullish pattern, then in this case, we can consider the continuation of growth.
Sincerely, R. Linda!
Consolidation

GOLD → Consolidation before continuing growth to 3700 FX:XAUUSD resumed its growth on Friday, approaching the $3,650 level, amid growing expectations of aggressive Fed rate cuts and geopolitical risks. The metal remains near record highs and is poised for a fourth consecutive week of gains.
Key drivers: Probability of a 25 bp rate cut on September 17 — 92%, chance of a 50 bp cut — 8%. Markets are expecting three cuts in 2024. US plans to impose new tariffs on India and China are supporting demand for safe havens.
Gold remains in a bullish trend. The weak US economy and geopolitics are pushing it to new highs, but profit-taking at current levels is possible.
There is no news today, so trading may be relatively calm.
Technically, if the price does not retest 3738 but begins to consolidate near 3657 and attempts a breakout, the chances of continued growth will increase.
Support levels: 3638, 3630
Resistance levels: 3649, 3657
I expect the market to reach the liquidity zone of 3638 before returning to retest the trigger. However, if MM deems this maneuver unnecessary and forms a trading range between 3657 and 3649, then closing above 3657 could lead to another bullish distribution.
Sincerely, R. Linda!

GOLD → Retest 3620 - 3600 (imbalance zones) on the uptrendFX:XAUUSD is consolidating ahead of important news. The market is currently testing support, but the bullish pattern remains intact despite the intraday correction.
Gold is trading near $3650 in anticipation of US inflation data (CPI), which will determine the further trend. So far, the metal is consolidating below a record high of $3675.
High CPI data: will strengthen the dollar and weaken gold (bets on Fed easing will decline).
Low data: will push gold to new highs (the likelihood of aggressive rate cuts will be confirmed).
At the moment, the probability of a rate cut on September 17 is 92% (25 bps), with an 8% chance of 50 bps.
Technically, the chart is forming a consolidation against the backdrop of a bullish trend, the market is testing support, and if the bulls hold their ground in the key zone, traders may return to buying.
Resistance levels: 3638, 3649, 3657
Support levels: 3620, 3607, 3600
There is a battle for the 3620 zone. Consolidation above this zone will confirm bullish strength; otherwise, we can expect a deeper correction to the 3607-3600 zone to retest the imbalance area before further growth.
Best regards, R. Linda!

NZDUSD → Correction before bull run to 0.600FX:NZDUSD , after breaking the downtrend, is forming a consolidation, the goal of which is the potential for continued growth...
The dollar is forming a small countertrend correction, to which the market is reacting, but overall sentiment on currencies is relatively bullish amid expectations of interest rate cuts...
NZDUSD is forming a trading range (consolidation) after breaking through the resistance of the downtrend. 0.5915 - 0.596. Before the growth, MM may form a liquidity capture at 0.5915 - 0.5f.
Support levels: 0.5915, 0.5884
Resistance levels: 0.5960, 0.5996
Interest rate cuts, especially aggressive ones, could trigger a fall in the dollar, which in turn would support forex currency baskets. Against this backdrop, NZDUSD could trigger medium-term growth from the specified support zone.
Best regards, R. Linda!

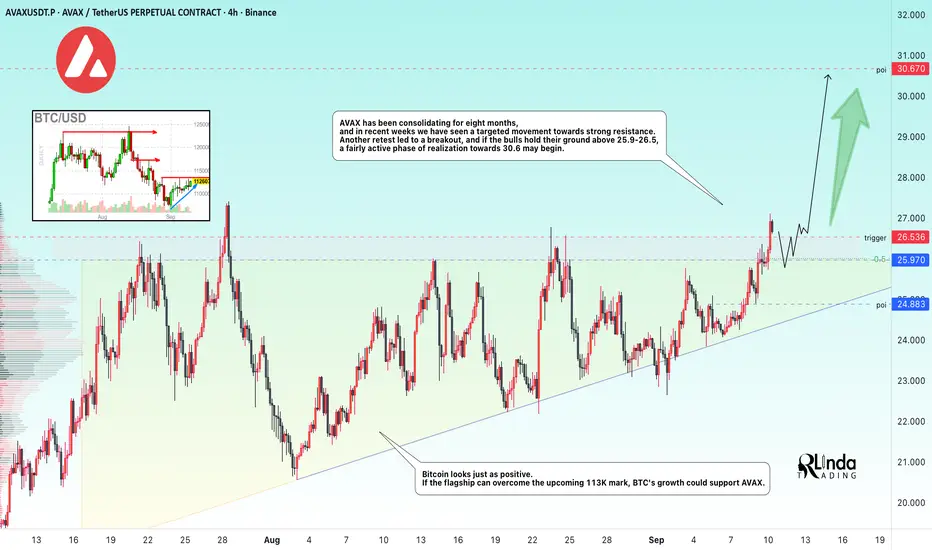
AVAXUSDT → Distribution of 8-month accumulationBINANCE:AVAXUSDT is testing the resistance of an 8-month consolidation. The market is showing positive signs that may indicate a possible rally...
Bitcoin looks positive. If the flagship can overcome the upcoming 113K mark, BTC's growth could support altcoins, including Avalanche.
AVAX has been consolidating for 8 months, and in the last few weeks, we have seen a directed movement towards strong resistance. Another retest led to a breakout, and if the bulls hold their defense above 25.9 - 26.5, a fairly active phase of realization towards 30.6 may begin.
Resistance levels: 26.550
Support levels: 25.97, 24.88
I do not rule out the possibility of a retest of the local support and liquidity zone, but a return to the zone of interest (above 25.97 - 26.55) and consolidation above the specified border could provoke a distribution towards 30.0 - 45.0.
Best regards, R. Linda!
EURUSD → Breakthrough of consolidation resistance. Rally?FX:EURUSD ends correction with a breakout of consolidation resistance. The market is waiting for a positive driver in the form of economic news that could support the growth of the euro...
A breakout of the correction (consolidation) resistance has formed. However, the momentum is being replaced by a correction aimed at consolidating in the bullish plane, which could trigger continued growth in the medium term.
The dollar looks weak, and expectations of interest rate cuts are supporting the euro. If the bulls keep the price above 1.17 - 1.172 within the current correction, the price may start to rally to highs...
Support levels: 1.173, 1.1703
Resistance levels: 1.178, 1.183, 1.190
Before continuing to grow, liquidity may be captured relative to the previously broken consolidation resistance. A false breakdown of support at 1.173-1.170 could trigger a resumption of growth towards 1.190.
Best regards, R. Linda!

BNBUSDT — Bullish consolidation ahead of resumed uptrendThe bullish consolidation in BNBUSDT that I’ve been watching has begun to resolve in the market’s favor. Price action is coiling after two consecutive white spinning-top candles, a pattern that signals indecision but also a readiness to resume the prior trend when confirmed. The move has occurred on heavier volume concentrated in the current price area, and the pair sits roughly halfway between two key Fibonacci retracement levels — a location that commonly precedes a corrective bounce rather than a full trend reversal. Trend Strength sits just above zero, suggesting a fragile bullish bias rather than conviction.
Viewed on a slightly wider timeframe, BNBUSDT is grinding inside a shallow range that resembles a consolidation brick; the path of least resistance still leans toward the upside provided the short-term structure holds. Conventionally, the presence of consecutive indecisive candles on increased volume near mid-Fibonacci territory combined with a mildly positive momentum indicator favors a corrective rebound rather than an extended sell-off.
Key short-term levels to monitor on the way up are the 38.2% Fibonacci retracement as the likeliest target for the initial bounce, with a secondary cap at the 50% retracement if buyers show enough follow-through. Beyond those, a return toward prior highs remains plausible, though that area will present a zone of elevated resistance and will need clear volume-backed breakout confirmation to be trusted.
RSI and other momentum readings are consistent with a measured recovery rather than an impulsive surge, so expect the move to unfold over the coming 2–3 weeks. If the market fails to sustain above the 38.2% level and momentum turns down, the alternate scenario would be a continuation of the consolidation or a deeper retracement toward the lower Fibonacci boundary.
Short summary:
Setup : consolidation with two white spinning-top candles, heavier volume locally, price midway between two Fibonacci levels, Trend Strength slightly > 0.
Base case : corrective bounce to 38.2% (primary) — up to 50% (maximum) — then continuation higher toward prior highs (resistance zone).
Timeframe : ~2–3 weeks.

GOLD → As prices continue to rise, so do the risks...FX:XAUUSD continues to rise, setting new highs. New ATH 3659. Focus on current consolidation, as the structure remains bullish...
Gold hit a new record high, surpassing $3,650, amid a weakening dollar and growing expectations of aggressive Fed policy easing. However, overbought conditions and profit-taking risks may limit further growth.
The USD is at 7-week lows due to fears of stagflation and deteriorating employment data. The probability of a rate cut on September 17 is 89.4% (25 bps), with a chance of 50 bps. Markets are expecting more than two cuts in 2024.
Risks for gold: “Sell the fact”: If the NFP revision turns out to be weak (as expected), investors may start to take profits.
Technically, gold remains bullish, but a near-term correction is likely due to technical factors and a possible reaction to the data. The long-term trend remains bullish thanks to a weak USD and the Fed's dovish policy.
Resistance levels: 3657, 3675, 3700
Support levels: 3636, 3628, 3620
Gold is consolidating. At the moment, the fundamental background is stable, and no news is expected today except for those that are impossible to predict (comments, rumors, etc.). Before further growth, gold may test the support area and the liquidity hidden behind it.
Best regards, R. Linda!

GOLD → Strong bullish trend. What are the targets?FX:XAUUSD continues to rally on positive fundamentals that emerged at the end of last week. The market is pricing in an almost 100% cut in interest rates, which is weakening the dollar and supporting the metal...
Gold is holding close to its record high of $3,600 after extremely weak US employment data for August. This has reinforced expectations of a 25 bp Fed rate cut this month.
This week, attention is focused on the release of US inflation data (CPI and PPI). Inflation data in the US will confirm or adjust expectations for Fed policy easing. If inflation remains high, this could delay aggressive rate cuts and cause a correction in gold. For now, the bullish trend continues.
Resistance levels: 3615, 3634, 3650
Support levels: 3600, 3578
Technically, a strong bullish trend. Growth may continue after price consolidation above 3614-3615 or after a slight correction to support at 3600 relative to the current local rally.
Best regards, R. Linda!

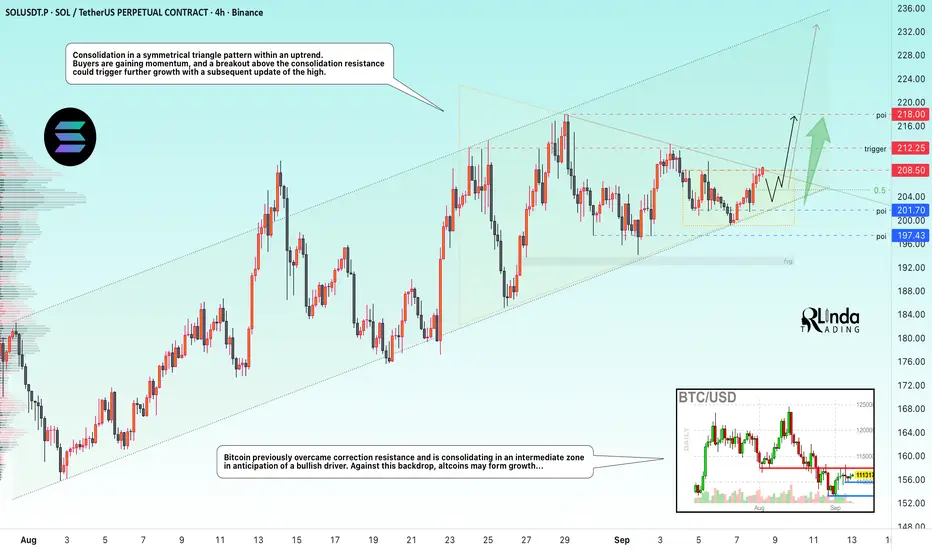
SOLUSDT → Consolidation before the rally. New high?BINANCE:SOLUSDT continues to form a bullish trend without reacting to market noise. The price is consolidating before a possible rise. Focus on the trigger...
Bitcoin previously overcame correction resistance and is consolidating in an intermediate zone in anticipation of a bullish driver, which could generally strengthen positive sentiment in strong altcoins. Against this backdrop, the market may form growth...
SOL is consolidating in a symmetrical triangle pattern within an uptrend. Buyers are gaining momentum, and a breakout of the consolidation resistance could trigger continued growth with a subsequent update of the maximum.
Resistance levels: 208.5, 212.25, 218.0
Support levels: 201.7, 197.4
Before the breakout and growth, a retest of the 205.0 - 201.7 zone may form, however, a breakout beyond the symmetrical triangle may trigger a spread. Growth targets may be 220, 245.
Best regards, R. Linda!
ENAUSDT → Attempting a trend change. Focus on 0.700BINANCE:ENAUSDT is forming an attempt to change the trend. The price breaks the descending resistance and forms a new trading range. The focus on the 0.7 support and the bulls' reaction...
Bitcoin looks quite positive after breaking the downside resistance, but there is a strong 112K zone ahead and news on Thursday / Friday. If the general backdrop maintains its bullishness, BTC's rise will support strong altcoins and the market could turn green, including the coin discussed in this publication...
ENAUSDT breaks through the downtrend resistance. Price is consolidating above the boundary and forming a trading range. The focus is on the 0.7 - 0.683 area. If the bulls keep the price above this area, it will confirm the fact of trend change, which could trigger a rally to 0.7745 - 0.853
Support levels: 0.7, 0.683, 0.668
Resistance levels: 0.736, 0.7745
Technically, there is a possible struggle between market participants for the area 0.7 - 0.668. In this case, I will not consider the return to the channel as a false breakout of the trend, as a strong upward impulse was formed earlier, which generally broke the local market structure. However, based on the technical situation, I will consider entering the position after clear signs of price holding above the key support zone.
Regards R. Linda!

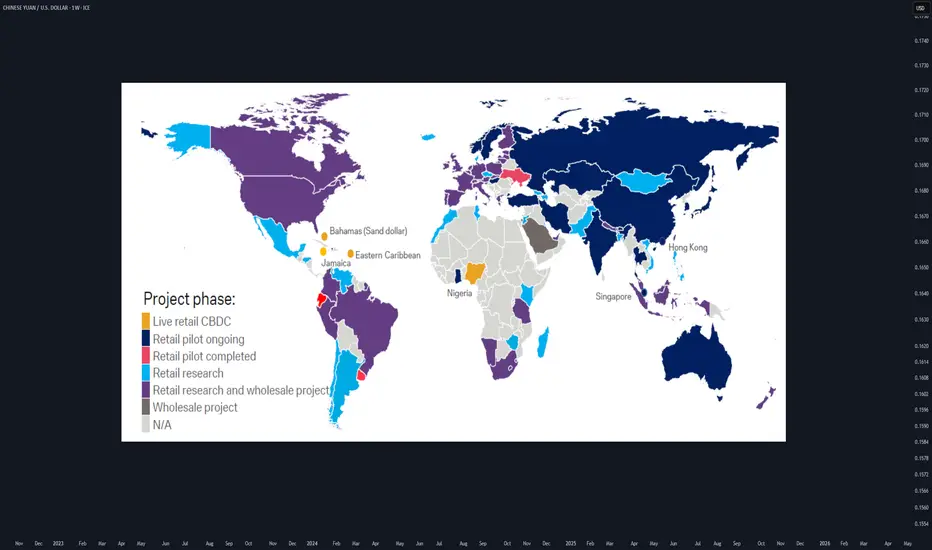
CBDCs for FXTraders :Your 2025 Guide to Digital Currency MarketsWhat if the U.S. dollar or Chinese yuan you’re trading today becomes digital tomorrow?
As of 2025, 132 countries are piloting Central Bank Digital Currencies (CBDCs) , with China’s digital yuan already in 260 million wallets. This isn’t sci-fi—it’s happening now, and it’s about to shake up forex markets.
hey I’m Skeptic :) At Skeptic Lab , we don’t chase hype—we dissect it. CBDCs are the next frontier, and I’m here to show you how to trade this shift without getting burned. In this guide, you’ll learn what CBDCs are, how they’ll mess with pairs like CNY/USD , and a beginner-friendly strategy to profit from the chaos. Let’s get ahead of the curve.
What Are CBDCs? A No-BS Breakdown
Central Bank Digital Currencies are digital versions of fiat money, backed by central banks. Think digital yuan or digital USD—same value, but on a blockchain or centralized ledger.
132 countries , including China (260M digital yuan wallets), India (digital rupee pilots), and the EU (digital euro trials), are testing CBDCs in 2025. Why? Control, speed, and lower transaction costs.
Unlike crypto, CBDCs are tied to fiat, so they’ll directly impact pairs like CNY/USD, INR/USD, or EUR/USD. Expect new volatility patterns and liquidity shifts.
I’m not sold on CBDCs being a trader’s paradise yet—central banks love control, and that could mean less freedom ( I hate XRP too, but I trade it when it gives my fuking trigger... ). But the opportunity is real if you know how to play it.
How CBDCs Will Shake Up Forex Markets
CBDCs could make cross-border transactions faster, boosting liquidity for pairs like CNY/USD. China’s digital yuan is already used in global trade pilots.
As countries roll out CBDCs, expect short-term price swings. For example, CNY/USD could spike if digital yuan adoption outpaces expectations.
Central banks might tighten forex controls with CBDCs, impacting leverage or spreads. Stay sharp—regulations are coming. Focus on CNY/USD (China’s digital yuan is live), INR/USD (India’s pilot is scaling), and EUR/USD (digital euro trials are accelerating). The hype says CBDCs will streamline forex, but I’m skeptical—centralized digital money could mean more manipulation. Still, volatility is a trader’s friend if you’re prepared.
Trading Strategy—Range Trading CNY/USD
Why CNY/USD? “China’s digital yuan is the most advanced CBDC, with 260M wallets and growing global use. CNY/USD is volatile but often range-bound, perfect for beginners.
Step-by-Step Strategy:
Identify the Range: “On TradingView, use daily charts to spot CNY/USD’s Range boxes ( Consolidation phases ). Look for consolidation after CBDC news. ”
Enter the Trade: “Buy after resistance breakout (breakout above consolidation box); sell after support breakout (breakout below our consolidation box). Set a stop-loss bellow the breakout candle or previous low in lower time frames(4h. ) or below previous support (4h) or above resistance and high (if you go for short).”
Take Profits: “clone the consolidation box and put it above or below the previous box. take partial profit (35% at rrr of 2 then 40% at rrr of 5 then 20% at rrr of 10 and close the rest when we formed lower highs and lower lows (based on dav theory)”
Risk Management: “ Risk only 1-2% of your account per trade. CBDC news can be fakout so have your other confirmations (such as RSI and PIVOT POINTS etc.)
Range trading isn’t sexy, but it’s steady. CNY/USD’s CBDC-driven swings make it a solid pick for 2025—just don’t get greedy.
Risks and What to Watch in 2025
CBDCs could tighten central bank control, reducing forex flexibility. Sudden policy shifts (e.g., China banning crypto trades again) could tank CNY/USD . Plus, tech glitches in CBDC rollouts might cause market freezes. Track CBDC adoption news on X—look for updates on China’s digital yuan, India’s rupee, or EU trials. Follow central bank announcements and IMF reports for clues.
I’m all in on spotting trends early, but CBDCs aren’t a free lunch. Stay skeptical , trade small, and always have an exit plan.
What’s your take on CBDCs in forex? Drop your thoughts bellow , and let’s debate!
Boost for more Skeptic takes :) 📈
Disclaimer: This article was written for educational purposes only and should not be taken as investment advice.
HYPEUSDT → Upward consolidation. One step away from a rally BINANCE:HYPEUSDT.P continues to consolidate while maintaining an ascending triangle structure. Any bullish driver, even a weak one, could trigger a breakout of resistance and distribution with an ATH update...
Against the backdrop of weak Bitcoin and falling altcoins, HYPE looks positive. The market is holding an upward support line and a bullish trend, and the update of the local maximum as a manifestation of bullish strength is a positive sign. The price is changing the local market structure to bullish and is ready to continue growing after a correction. Focus on the 46.15 and 45.5 - 45.08 areas. A false breakdown and closing above the level will confirm the readiness to continue growing.
Resistance levels: 47.78, 49.54
Support levels: 46.15, 45.08, 44.45
As part of the correction, the price may test the specified areas of liquidity and interest, which may provoke a change in the market imbalance in favor of buyers. If, after a false breakdown of key areas, the bulls keep the price above, then in the short and medium term, we can expect continued growth.
Sincerely, R. Linda!

BITCOIN → Sale on positive news? What to expect? 100K or 130K?BINANCE:BTCUSDT.P unsuccessfully ended another attempt to break through the 112K-113K zone. The positive background (NFP) did not affect the price, and a bearish setup formed on D1...
D1 is forming a pin-bar relative to the strong resistance zone of 112K - 113K, positive news is quickly sold off, and the price, rebounding from the resistance of the trading range, closes near the bearish trigger of 110500. Bitcoin looks quite uncertain as it faces selling pressure in the 112K-113K zone. The price cannot consolidate above this area despite the previously broken correction resistance. There is logic in this maneuver... The market is betting on a more than 90% chance of interest rate cuts, and by that point, the price of Bitcoin may fall to the maximum permissible limits before further growth. Areas of interest may be 107K - 105K - 100K
Resistance levels: 111.9K, 113.3K, 117K
Support levels: 110.5K, 107.4K, 105.0K
A breakdown of the 110.5K support could trigger further sell-offs towards the support of the key trading range. Within the current downward cycle, the price may well test 105,000, which is a fairly strong liquidity zone. The fundamental background is positive, and the current sell-off may be manipulative movement before the emergence of a bullish driver...
Best regards, R. Linda!

SOLUSDT → Stronger than the market. Correction before growthBINANCE:SOLUSDT updated its maximum to 218 and entered another phase of correction for consolidation. The altcoin looks quite strong against the backdrop of the rest of the cryptocurrency market...
Bitcoin continues its aggressive decline after yesterday's trap (false breakout of the trend line). Despite relatively positive fundamental and technical developments, the cryptocurrency market is in the red. Against this backdrop, SOL stands out as a strong altcoin compared to Bitcoin, which has been falling for two weeks. SOL updated its maximum and entered a correction phase. Within the current structure, the price may test the liquidity zone of 202.5 - 195.3 before continuing to grow to 220 - 240.
The reaction to false breakouts of local highs is weak, there is no reversal, and the nature of the current structure is “consolidation.” If the bulls keep the price above 200 during the correction, the further outlook will be positive.
Resistance levels: 216.5, 220, 244
Support levels: 202.5, 198.0, 195.3
Focus on the current correction. We need to wait for a slowdown and the end of the structure. Focus on the specified support zones, from which the market may resume bullish trading, which in turn may lead to a breakout of intermediate resistance and growth to the specified targets.
Best regards, R. Linda!

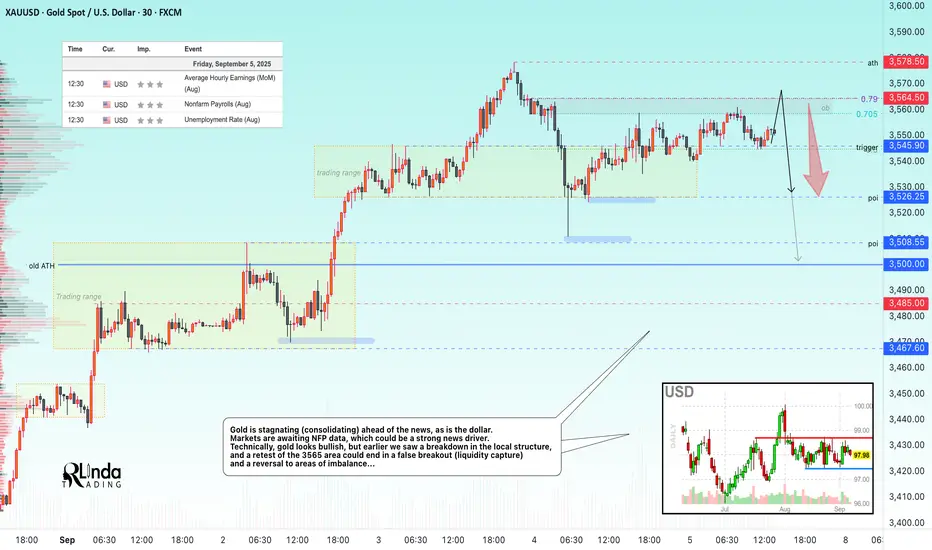
GOLD → ATH retest before NFP. High risk level...FX:XAUUSD remains in a bullish trend, but short-term dynamics depend on NFP. A break above $3578 will open the way to new highs, but profit-taking at record levels could increase volatility.
Gold remains strong ahead of US NFP data, which may confirm the Fed's policy easing. Weak data (forecast: +75K new jobs) will reinforce expectations of a rate cut and support gold. However, the risk of a correction is quite high, and any nuances could trigger liquidation. Weak employment data, namely rising unemployment and low ADP figures, are strengthening bets on a Fed rate cut, which overall only increases interest in the metal.
Resistance levels: 3564.5, 3578.5
Support levels: 3545.9, 3526, 3508
NFP data will determine the short-term trend. A weak report will lead to growth to $3600+, while a strong report will lead to a correction to 3450-3400. Technically, I expect a correction after the local bullish structure breaks down. It is not worth trading on the news; it is better to wait 20-40 minutes after the release to make decisions based on fundamental data.
Best regards, R. Linda!
EURGBP → The battle for zone 0.867. What are the prospects?FX:EURGBP is attempting to remain above 1/2 of the key trading range as part of a retest after breaking through strong resistance. The local trend is bullish, and the price has a chance to reach 0.8743.
EUR is consolidating in a wedge pattern, with the price moving away from support and attacking resistance. Against the backdrop of the expected Fed rate cut, EUR may break through the line and begin an active phase of growth, which will support EURGBP. The currency pair's price has moved beyond the lower half of the trading range and is attempting to consolidate above the bullish interest zone. If the bulls hold their defense above 0.866-0.867, the price will have a chance to test the poi
Support levels: 0.867, 0.865, 0.8635
Resistance levels: 0.871, 0.874
Against the backdrop of the news, the price may test the order block in the 0.865 zone. A false breakdown and consolidation of the price above 0.867 will confirm the bulls' intentions, allowing the price to move towards the specified target.
Best regards, R. Linda!

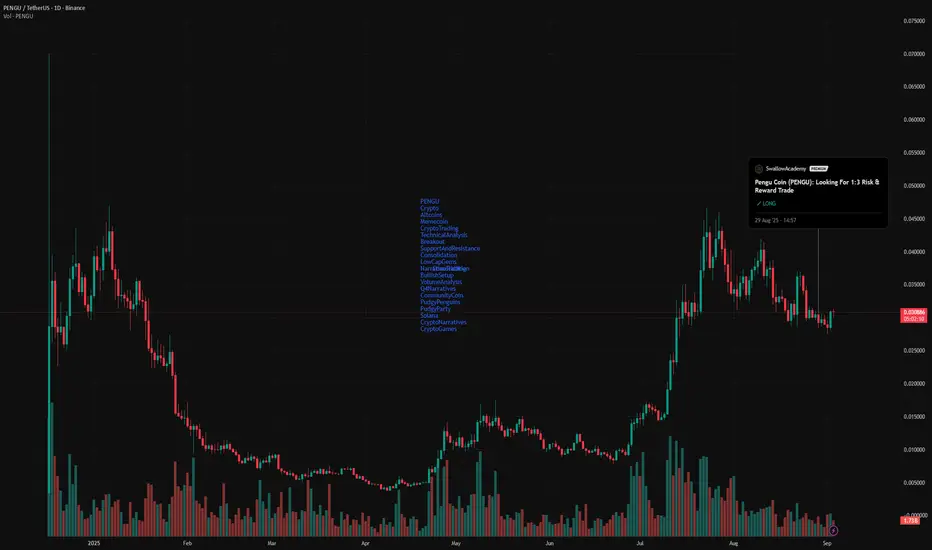
Is $PENGU about to send?TL;DR
Pengu is holding up strong around $0.030 after a big run-up. It’s been consolidating here for a bit, and it’s starting to look like we might be gearing up for the next leg. Plus, the community is super active, and there’s a lot going on behind the scenes.
So what’s Happening?
Price is chilling around ~$0.030
Strong support holding at $0.029 and I've seen multiple bounces there
Had a big run-up to $0.07+, followed by a healthy cooldown
Currently in a classic consolidation phase
Volume looks solid buyers stepping in under $0.030 every time
Why Are People Still Bullish?
Pudgy Penguins just sponsored a NASCAR team. Actual race cars with penguins on them.
The Pudgy Party mobile game is blowing up. On-chain interactions, tournaments, great reviews, and people are actually playing.
X (Twitter) is full of believers stacking more at these levels. The meme game is strong, but so is the real use case stuff.
Some guy even said this in a post:
“In a few months we’ll laugh at these prices.” He might be right.
If you're thinking of jumping in, here’s a simple setup, but always do your own research first:
Buy Zone: $0.030–$0.031
Take Profit: First target at $0.036, second target around $0.045
Stop Loss: ~$0.028
Good risk/reward if you think the sideways chop is ending soon.
Final Thoughts:
Pengu has meme energy, but it also has a growing ecosystem. Between the mobile game, the merch, the community, and real brand exposure.
You don’t have to ape, but if you're watching this one… stay close. This penguin could be heating up!
GOLD → Consolidation in the ATH zone. Risk zone...FX:XAUUSD hit a new all-time high of around $3,550 as investors worldwide rushed to safe-haven assets. As prices rise, the risk of profit-taking increases, especially with news coming up...
The key driver is the crisis in the bond market: long-term government bond yields are rising sharply in the UK and Japan. This is boosting demand for gold as a safe haven. We should also not forget about expectations of Fed easing: weak employment data could increase bets on a rate cut in September.
However, strong US employment data (starting with JOLTS today) could support the USD and limit gold's growth.
Correction: Record levels could trigger profit-taking, especially given that the price has come a long way since the last pullback, rising nearly 6% (7 days of growth).
Key factor: US labor market data (JOLTS today, NFP on Friday). Weak figures will strengthen gold, strong ones may cause a correction.
Resistance levels: 3546, 3550, 3575
Support levels: 3526, 3508, 3500
Technically, a retest of resistance at 3342-2246 could lead to a breakout and further growth. However, since the price has stopped updating its highs locally, I do not rule out the possibility of a retest of support at 3529-3526 before further growth. However, a weak reaction to support could lead to the formation of a pre-breakdown base, and a breakdown of support could trigger a decline to 3500.
Best regards, R. Linda!

GBPNZD → Retest 2.276 before resuming the bullish trend FX:GBPNZD is testing a key support level as part of a correction after breaking through consolidation resistance. The trend is bullish, and liquidity capture could resume the upward movement.
GBPNZD is testing a strong support level within the uptrend during the correction phase. Against the backdrop of the long-term decline of the NZD, the currency pair has every chance of continuing to grow.
On the daily timeframe, we have a fairly strong upward structure, with the previously broken consolidation resistance and the 0.5f area playing a key role. This tandem hides a liquidity area that could become a driver for the market. A false breakdown of 2.276 could trigger a resumption of growth.
Support levels: 2.276, 2.2682
Resistance levels: 2.2983, 2.3215
The bullish trend may support the main trend. The current correction is a healthy movement within an uptrend that may continue after a pullback and consolidation.
Best regards, R. Linda!

Conslidation Box
Closed at 9.14 (23-05-2025)
Trying to break the long consolidation box.
Important Support Zone is around 8 - 8.70
Channel bottom is around 5.30 which seems
unlikely as of now because of Bullish Divergence
on weekly tf.
Upside targets can be around 11 & then around 14

CHWY in ConsolidationHi Traders!
In my previous post, I mapped out my long plan, and took profits around resistance at $42. Since then, CHWY has returned back to my entry area I am re-adjusting myself for another set up. Right now it is retesting the Daily CHOCH area again, and seems to be in consolidation. If the Daily CHOCH is valid, I would like to see a bullish engulfing, or a strong bounce to act as support.
If the CHOCH area fails, I will look for a re-entry around $36. That will bring price towards a Daily order block. Therefore, a bearish sentiment would be a close below $39, retests from below turning into resistance. No trade if it just chops between $39 & $40 with weak candles. This will avoid me getting caught in consolidation and chopping up my contracts.
*DISCLAIMER: I am not a financial advisor. The ideas and trades I take on my page are for educational and entertainment purposes only. I'm just showing you guys how I trade. Remember, trading of any kind involves risk. Your investments are solely your responsibility and not mine.*

GOLD → False breakout at 3500. What next? 3400 or 3600?FX:XAUUSD updates its ATH on the spot market to 3508.5 and forms a false breakout, provoking liquidation and profit-taking. The imbalance in the market is changing, and a deeper correction is possible...
Gold updated its historical maximum above $3500, but faced a correction amid a short-term strengthening of the dollar. The market's attention is focused on the US ISM Manufacturing PMI data, which may determine further dynamics.
Key drivers: The probability of a rate cut in September is estimated at 90%, which supports gold. Pressure on the USD continues due to concerns about the independence of the Fed (pressure from Trump) and geopolitics. The escalation of the Russia-Ukraine conflict (new strikes by the Armed Forces of Ukraine on Russian territory) is increasing demand for defensive assets.
Ahead of the ISM Manufacturing PMI: Forecast — growth to 49 (but remains in the contraction zone). If the data turns out to be weaker, it will strengthen dollar sales and push gold to new records.
Resistance levels: 3485, 3500
Support levels: 3467.6, 3441, 3423
Technically, gold may enter a longer consolidation or correction. If the bears keep the price below 3490-3485, then in the short term, we can expect a decline to the specified support zones. I do not rule out the possibility of a retest of 3500-3505, but at the moment I do not see the potential for the market to continue growing (in the short term!).
Best regards, R. Linda!
