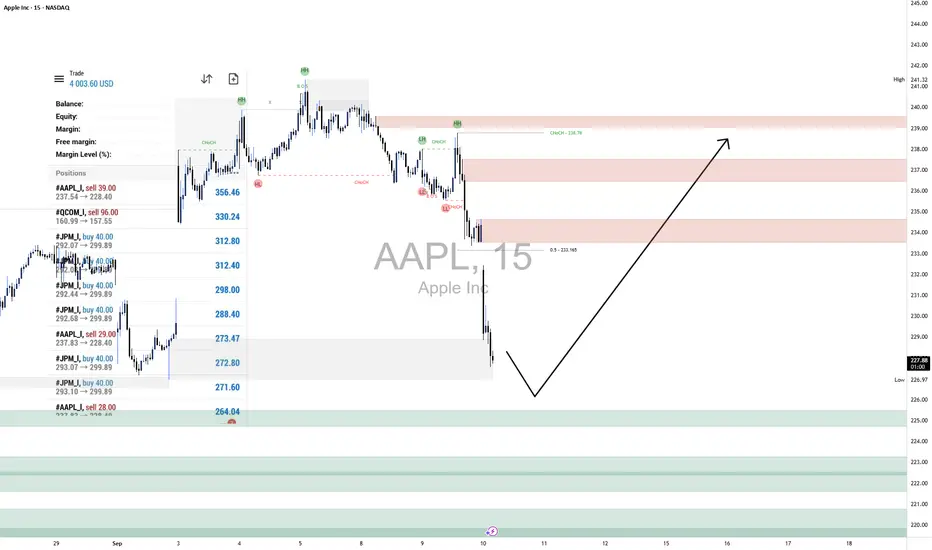
AAPL LongOn AAPL (15m), the broader market structure has shifted bearish after multiple CHoCH signals near 239–238 and a decisive Break of Structure (BOS) around 236, which confirms sellers have taken control following the rejection from the recent swing high at 241.02. The rapid downside move into the current session suggests continuation pressure, but a short-term corrective rally remains possible if demand levels hold.
The supply zones between 233–239 look strong, as price repeatedly failed to hold above them and sold off sharply each time, showing clear seller dominance. The stacked demand levels below 227 down to 220 are important to watch: buyers previously stepped in with strength here, creating impulsive rallies, but their ability to defend these zones again will determine whether a deeper recovery can take place.
Price is now trading at 227.91, extending a sharp leg lower into nearby demand. The marked projection suggests price may attempt a bounce from this area, targeting a corrective move back toward 233–238 supply. If buyers manage to defend current lows and create a bullish reaction, a retracement into those red zones is likely. However, failure to hold above 226.90 would expose lower demand layers toward 224–222.
The current trade bias is bearish, but near-term expectation is for a corrective bullish retracement into supply before sellers look to re-engage. The outlook would be invalidated if price breaks and closes decisively above 239, as that would flip structure back in favor of buyers. Momentum currently favors sellers given the sharp downside drive, but any slowing of bearish candles at demand or the appearance of strong bullish engulfing patterns would support a corrective move higher.
Contains image
GOLD WEEKLY CHART MID/LONG TERM ROUTE MAPWeekly Chart Update
Please see update on our weekly chart idea.
Sunday we stated that we had the weekly body close above the channel top at 3576 and now opened the door to the larger 3659 long-term gap target.
- this target is now complete
We will now look for a close above 3659 for a continuation or failure to lock will follow with a rejection into lower levels for support.
🔹 Range Support Levels
3576 and 3482 now act as layered support levels to keep the bullish case intact within this range.
Updated Levels to Watch
📉 Support – 3482 & 3576
Key supports for this new range. Holding above 3576 strengthens the case for continuation toward 3659. A failure back below 3576 puts 3482 into play as the next defensive level.
📈 Resistance – 3732
This becomes the next upside objective if structure holds above 3659.
Thanks as always for your support,
Mr Gold
GoldViewFX

GOLD 4H CHART ROUTE MAP UPDATEHey Everyone,
This is a follow up update on our 4H chart idea that we shared Sunday stating that we still had the final gap in the range left.
EMA5 cross and cross and lock above 3561 left 3615 open.
- This target was hit this week now completing our 4H chart idea.
Keep an eye out for our NEW 4H chart idea with updated levels and route map.
BULLISH TARGET
3424 - DONE
EMA5 CROSS AND LOCK ABOVE 3424 WILL OPEN THE FOLLOWING BULLISH TARGETS
3499 - DONE
EMA5 CROSS AND LOCK ABOVE 3499 WILL OPEN THE FOLLOWING BULLISH TARGET
3561 - DONE
EMA5 CROSS AND LOCK ABOVE 3561 WILL OPEN THE FOLLOWING BULLISH TARGET
3615 - DONE
As always, we will keep you all updated with regular updates throughout the week and how we manage the active ideas and setups. Thank you all for your likes, comments and follows, we really appreciate it!
Mr Gold
GoldViewFX

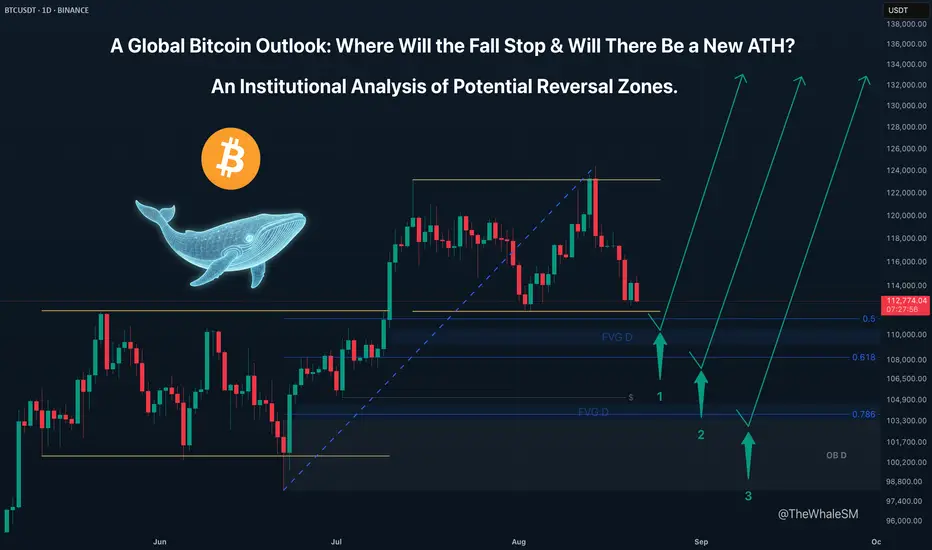
Bitcoin's Tumble: How Deep Does the Rabbit Hole Go?This isn't just a correction; it's a journey down the rabbit hole. The recent "fake" ATH was a calculated move by the whales to engineer a deep pullback. This analysis maps out the key levels in this rabbit hole where Alice—and Bitcoin—might finally find the bottom and begin the climb to a new Wonderland.
After updating its ATH on August 14th, Bitcoin did not continue its global uptrend. It was merely a liquidity sweep of the previous ATH, which confirmed the formation of a large range on the weekly and daily structures. In essence, this new ATH was a deviation above the range, after which the asset began a sharp markdown, collecting all the internal liquidity.
Most likely, the recent ATH was not the final one in this global bull cycle for Bitcoin because a proper, definitive high that would look like the start of a bear cycle was not established. Instead, it was achieved through a manipulation aimed at engineering a correction for the instrument down to key institutional levels.
Three Potential Long Scenarios
General Entry Conditions for All Scenarios:
Since these are levels from a global structure, a valid entry requires a clear reversal reaction and price finding acceptance above the respective Fib level . Confirmation of this may require waiting for 1-2 daily candles to close if the 1-4H candles do not immediately confirm the reversal.
SCENARIO 1 (Primary): The 50% Weekly Fib Level
This is the first corrective level from which a reversal is possible. A key confluence here is that reaching this level would be accompanied by a sweep of the external liquidity from the lower boundary of the range, as well as the mitigation of the upper boundary of the previous range, which could provide the necessary fuel for the next major impulse up. An added plus would be the price reaching the daily FVG that lies just below this level.
SCENARIO 2 (Deeper Correction): The 61.8% Weekly Fib Level
A break of the 50% level would mean that there wasn't enough liquidity and a deeper correction is needed. The next logical target would be the 61.8% level.
SCENARIO 3 (Final Defense): The 78.6% Weekly Fib Level
This is the last line of defense for the bullish structure. A reaction here would offer the most discounted entry to join the potential continuation of the bull run.
If the final retracement level is broken, the price will most likely attack the June 22nd low at 98200 . If the price finds acceptance below this level with daily/weekly candles, it would signal the end of the global bull cycle and the beginning of a bear market, but this is a distant and less probable perspective for now. I find it more probable that one of the three long scenarios will play out, and the price of Bitcoin will set a new, legitimate ATH.
Since the price is still inside the new large range—albeit near its lower boundary—reaching the first 50% global correction level may take some time and will likely happen next week. Whether this level can withstand the assault will determine if Bitcoin's fall continues, and just how deep Alice's rabbit hole truly is.
~~~~~~~~~~~~~~~~~~~~~~~~~~~~~~~~~~~~~~~~~~~~~~~~~~~~~~~~~~~~~~~~~
The principles and conditions for forming the manipulation zones I show in this trade idea are detailed in my educational publication, which was chosen by TradingView for the "Editor's Picks" category and received a huge amount of positive feedback from this insightful trading community. To better understand the logic I've used here and the general principles of price movement in most markets from the perspective of institutional capital, I highly recommend checking out this guide if you haven't already. 👇
P.S. This is not a prediction of the exact price direction. It is a description of high-probability setups that become valid only if specific conditions are met when the price reaches the marked POI. If the conditions are not met, the setups are invalid. No setup has a 100% success rate, so if you decide to use this trade idea, always apply a stop-loss and proper risk management. Trade smart.
~~~~~~~~~~~~~~~~~~~~~~~~~~~~~~~~~~~~~~~~~~~~~~~~~~~~~~~~~~~~~~~~~
If you found this analysis helpful, support it with a Boost! 🚀
Have a question or your own view on this idea? Share it in the comments. 💬
► Follow me on TradingView for timely updates on THIS idea (entry, targets & live trade management) and not to miss my next detailed breakdown.
~~~~~~~~~~~~~~~~~~~~~~~~~~~~~~~~~~~~~~~~~~~~~~~~~~~~~~~~~~~~~~~~~
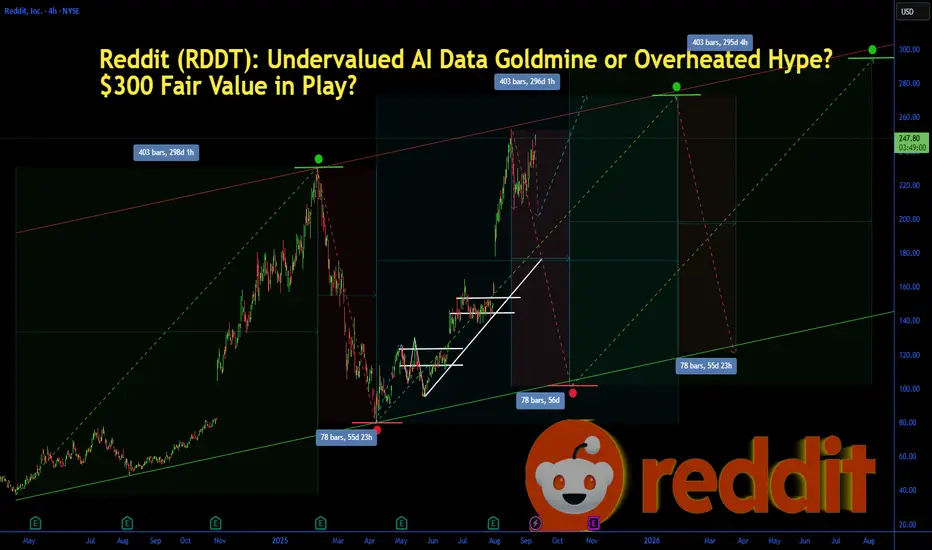
Reddit (RDDT): Undervalued AI Data Goldmine or Overheated Hype?Reddit (RDDT): Undervalued AI Data Goldmine or Overheated Hype? $300 Fair Value in Play?
Reddit (RDDT) shares surged 4.44% to close at $240.20 yesterday, with pre-market trading pushing it to $243.70 today amid optimism over its AI data licensing deals and a 78% YoY revenue jump in recent earnings. Year-to-date, the stock is up 46.97%, but analysts are split—some see it undervalued by 26% with a fair value of $302 based on free cash flow projections, while others flag overvaluation at current levels. With a lawsuit over alleged privacy issues making headlines and Q3 earnings looming on October 28, is RDDT the undervalued growth play in social media's AI era, or just riding short-term momentum? Let's break down the fundamentals, SWOT, technicals, and scenarios for September 10, 2025.
Fundamental Analysis
Reddit's core strength lies in its massive user-generated content, positioning it as a key AI training data source with deals like OpenAI's integration boosting revenue. Recent Q2 results showed $499.6 million in sales, up 78% YoY, surpassing estimates, driven by ad growth and user expansion to over 100 million daily actives.
Analysts expect EPS of $2.23 TTM, with forward P/E at 84.03, reflecting high growth premiums. However, a high PE of 107.71 and enterprise value/EBITDA of 291.25 suggest stretched valuations, compounded by a lawsuit alleging privacy violations.
- **Positive:**
- Surging revenue and user growth underscore AI data monetization potential; profit margin at 12.97% with $2.06B cash on hand.
- Institutional interest rising, with market cap at $44.96B and levered free cash flow of $290.61M signaling operational strength.
- **Negative:**
- High debt/equity at 1.05% and ongoing lawsuit risks could erode investor confidence if macro slowdowns hit ad spending.
- Sticky inflation and Fed rate uncertainty may pressure growth stocks like RDDT if AI hype cools.
SWOT Analysis
Strengths: Dominant in user-generated content for AI datasets; strong revenue growth (78% YoY) and cash reserves ($2.06B); loyal community driving organic traffic.
Weaknesses: Elevated valuations (PE 107.71) amid profitability challenges; history of operational issues like site outages; dependency on ad revenue vulnerable to economic dips.
Opportunities: Expanding AI partnerships (e.g., data licensing deals); global user base growth in emerging markets; potential for new features like premium subscriptions amid digital ad boom.
Threats: Intensifying competition from TikTok and Meta; regulatory scrutiny on data privacy (e.g., ongoing lawsuit); market volatility if Fed delays rate cuts.
Technical Analysis
On the daily chart, RDDT is in a rising trend channel after breaking out from $223 support, with volume spiking on earnings momentum but now consolidating near all-time highs.
This follows a 52-week range from $55.84 to $253.14, with the stock up over 300% from April lows. Current price: ~$243 (pre-market), pivoting around $240.
Key indicators:
RSI: At 68.60, bullish but nearing overbought—watch for pullback if it hits 70.
MACD: At 12.35 with positive histogram, signaling sustained upside momentum.
Moving Averages: Price above 21-day EMA (~$230) and 50-day SMA (~$220)—golden cross intact for bull bias.
Support/Resistance: Support at $223 (recent low), resistance at $253 (all-time high).
Patterns/Momentum: Rising channel targets $260 on breakout; higher highs confirm trend. 🟢 Bullish signals: Strong buy per technical summaries. 🔴 Bearish risks: Overbought RSI could trigger correction.
Scenarios and Risk Management
Bullish Scenario: Break above $253 on positive lawsuit resolution or AI deal news targets $260–$302; buy on pullbacks to $230 support.
Bearish Scenario: Drop below $223 eyes $220 (50-day SMA); watch for death cross if macro data disappoints.
Neutral/Goldilocks: Range-bound $223–$253 if earnings guidance is mixed.
Risk Tips: Use stops at $220 (2% below support). Risk 1-2% per trade. Diversify to avoid tech sector correlations—pair with stable assets like bonds.
Conclusion/Outlook
Overall, bullish bias if RDDT holds $240 and leverages AI tailwinds, affirming its undervalued potential with 25%+ upside to $302 fair value. But watch October earnings and privacy lawsuit for confirmation—this fits September's growth stock rotation amid Fed cut optimism.
What’s your take? Bullish on RDDT's AI edge or bearish on valuations? Share in the comments!
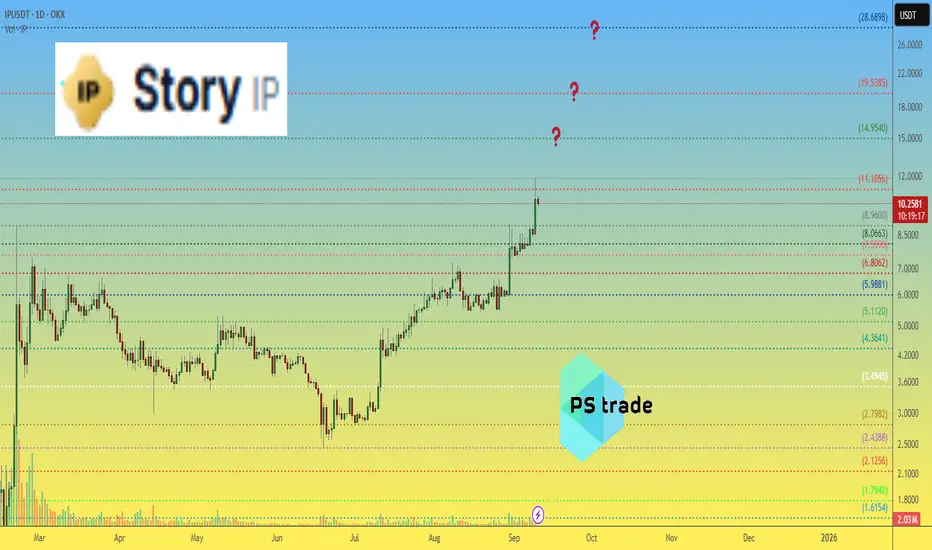
Story IP price analysisThe price action of #IP suggests there may be room for another upward leg 🚀
Key question for OKX:IPUSDT :
▪️ Is momentum strong enough to push toward $15, $20, or even $28?
Market context: at a current price slightly above $10, the Story project is already valued at $3.1B market cap.
❓ Where do you see the next realistic target for IP?
______________
◆ Follow us ❤️ for daily crypto insights & updates!
🚀 Don’t miss out on important market moves
🧠 DYOR | This is not financial advice, just thinking out loud.
ES Supply And demand Break-Out Buy SignalTrading News:
- PPI (Producer Price Manufacturing Index) came out -0.1% vs its 0.3% forecasted number, suggesting lower cost of manufacturing and inflation.
ES:
- Stocks caught a bid from this number as investors use this as a "lock" for FED rate cuts and a higher chance for a 2nd cut before the end of the year.
- Over the last 6 months, when the price is expected to open above yesterday's high, the price has a 74% chance of pulling back and hitting yesterday's high. This gives traders an idea for a possible open short OR wait for a pullback back into the previous ATH/Support level and wait for confirmation.
- Over the last 6 months, if the first 1hr of the NY session is "green" then 75% of the time price will close green for the day. The same is true for the first 1hr candle of the NY session is "red" then 75% chance of day being red.
- Over the last 6 months, Wednesdays have held the highest chance of a "green day", sitting at 69% chance.
- Overall, I remain bullish on this market and would not consider shorting this market at this point—aggressive RB break-out level around the 6540 level on the 5-minute TF. Traders can also wait for price to pullback to this level and wait for confirmation.

BTC : After retesting the 2024 peak, the price is showing signs BTC :
After retesting the 2024 peak, the price is showing signs of opening a strong bullish trend.

BTC's situation+next targets and expected movementsThe price seems to have completed the corrective wave, and from now on, it's time for a price increase, which will continue up to around $150k .
_ _ _ _ __ _ _ _ _ _ _ _ _ _ _ _ _ _ _ _ _ _ _ _ _ _ _ _ _ _ _ _
✅Thank you, and for more ideas, hit ❤️Like❤️ and 🌟Follow🌟!
⚠️Things can change...
The markets are always changing and even with all these signals, the market changes tend to be strong and fast!!

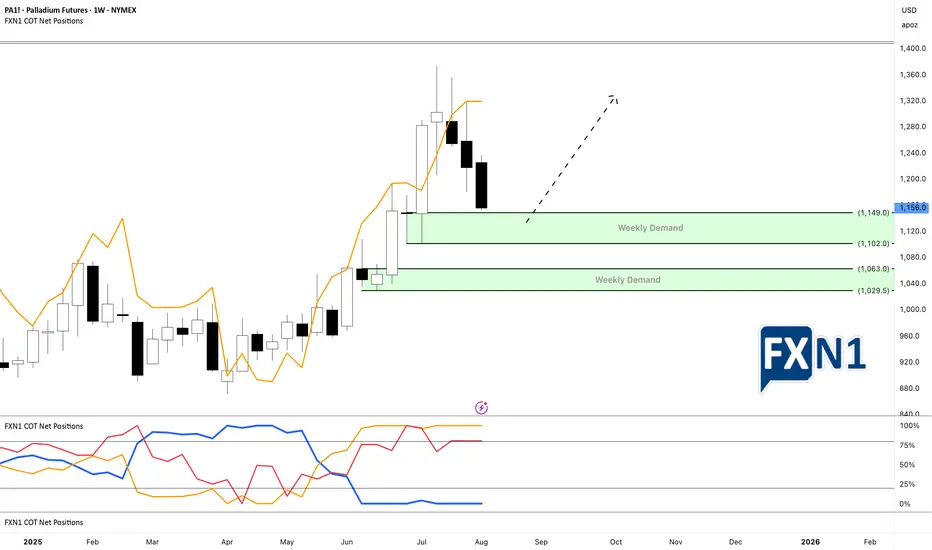
Palladium’s Bullish Outlook Amidst a Market FakeoutPalladium has emerged as the second strongest precious metal this year, demonstrating notable resilience. Over the past three weeks, however, its price has experienced a retracement, revealing two potential weekly demand zones on the chart. An analysis of the Commitment of Traders (COT) report indicates that this pullback is not driven by non-commercial traders, who are actually increasing their positions. This discrepancy suggests that the recent decline may be a false move by the market. Consequently, I am considering placing limit orders within the two identified demand areas to capitalize on a potential rebound.
✅ Please share your thoughts about PA1! in the comments section below and HIT LIKE if you appreciate my analysis. Don't forget to FOLLOW ME; you will help us a lot with this small contribution.
BITCOIN (BTCUSD): Bullish Wave is Coming?!
Quick update for Bitcoin.
Earlier, I already warned about a potential bullish accumulation
after a test of a demand zone.
The price is now testing an important supply cluster and we may
see a breakout of that today.
In case of a daily candle close above 113600, a bullish reversal
will be confirmed, and we will expect a growth at least to 116800.
❤️Please, support my work with like, thank you!❤️
I am part of Trade Nation's Influencer program and receive a monthly fee for using their TradingView charts in my analysis.

NZDUSD: Important Breakout & Bullish Outlook 🇳🇿🇺🇸
I spotted a confirmed breakout of a resistance line of a falling
parallel channel on NZDUSD on a daily time frame.
The next strong resistance is 0.597.
With a high probability, it is going to be reached soon.
❤️Please, support my work with like, thank you!❤️
I am part of Trade Nation's Influencer program and receive a monthly fee for using their TradingView charts in my analysis.

POL - BULLISH WAVE AWAITEDASX:POL - similar view; I think that a new wave upward is gonna start with this configuration!
Key demand zone to be maintained: 0.2450$

EURNZD - BEARISH MOVE!Hello Traders!
The EURNZD price broke the support level (1.97834 - 1.98166).
This key level becomes new resistance!
So, I expect a bearish move📉
_____________
TARGET: 1.96810🎯

EURNZD Expected Growth! BUY!
My dear subscribers,
EURNZD looks like it will make a good move, and here are the details:
The market is trading on 1.9695 pivot level.
Bias - Bullish
Technical Indicators: Both Super Trend & Pivot HL indicate a highly probable (Bullish continuation.
Target - 1.9782
About Used Indicators:
The average true range (ATR) plays an important role in 'Supertrend' as the indicator uses ATR to calculate its value. The ATR indicator signals the degree of price volatility.
Disclosure: I am part of Trade Nation's Influencer program and receive a monthly fee for using their TradingView charts in my analysis.
———————————
WISH YOU ALL LUCK

EURUSD On The Rise! BUY!
My dear friends,
EURUSD looks like it will make a good move, and here are the details:
The market is trading on 1.1704 pivot level
Bias - Bullish
Technical Indicators: Supper Trend generates a clear long signal while Pivot Point HL is currently determining the overall Bullish trend of the market.
Goal - 1.1730
Recommended Stop Loss - 1.1690
About Used Indicators:
Pivot points are a great way to identify areas of support and resistance, but they work best when combined with other kinds of technical analysis
Disclosure: I am part of Trade Nation's Influencer program and receive a monthly fee for using their TradingView charts in my analysis.
———————————
WISH YOU ALL LUCK

GBP/AUD - Triangle Breakout (08.09.2025)The GBP/AUD Pair on the M30 timeframe presents a Potential Selling Opportunity due to a recent Formation of a Triangle Breakout Pattern. This suggests a shift in momentum towards the downside in the coming hours.
Possible Short Trade:
Entry: Consider Entering A Short Position around Trendline Of The Pattern.
Target Levels:
1st Support – 2.0493
2nd Support – 2.0457
🎁 Please hit the like button and
🎁 Leave a comment to support for My Post !
Your likes and comments are incredibly motivating and will encourage me to share more analysis with you.
Best Regards, KABHI_TA_TRADING
Thank you.
Disclosure: I am part of Trade Nation's Influencer program and receive a monthly fee for using their TradingView charts in my analysis.

GOLD (XAUUSD) Wave analysis W1 - Update 10/9/2025 (Scenario 3)GOLD (XAUUSD) Wave analysis W1 - Update 10/9/2025 (Scenario 3)
PLEASE SEE TH CHART

GOLD (XAUUSD) Wave analysis W1 - Update 10/9/2025 (Scenario 2)GOLD (XAUUSD) Wave analysis W1 - Update 10/9/2025 (Scenario 1)
PLEASE SEE THE CHART

GOLD (XAUUSD) Wave analysis W1 - Update 10/9/2025 (Scenario 1)GOLD (XAUUSD) Wave analysis W1 - Update 10/9/2025 (Scenario 1)
PLEASE SEE THE CHART

THE KOG REPORT - UpdateEnd of day update from us here at KOG:
With gold continuing it's mission to all time highs again we did manage to get a 200pip rejection from the red box only to the support, get a trade upside and the RIP the from near enough the final target given this morning for the move. Worked out pretty well in our opinion!
Now, interesting move here on gold and many will think the retracement has started however, there are a few hurdles here to then confirm the move. First stage is the 3655 resistance which needs to hold us down, while the 3630 support level needs to break. Due to news tomorrow, we would expect this to start a range now between the two levels. For us, we'll stick with the plan in place as that level above 3668 gave us a nice RIP downside.
As always, trade safe.
KOG

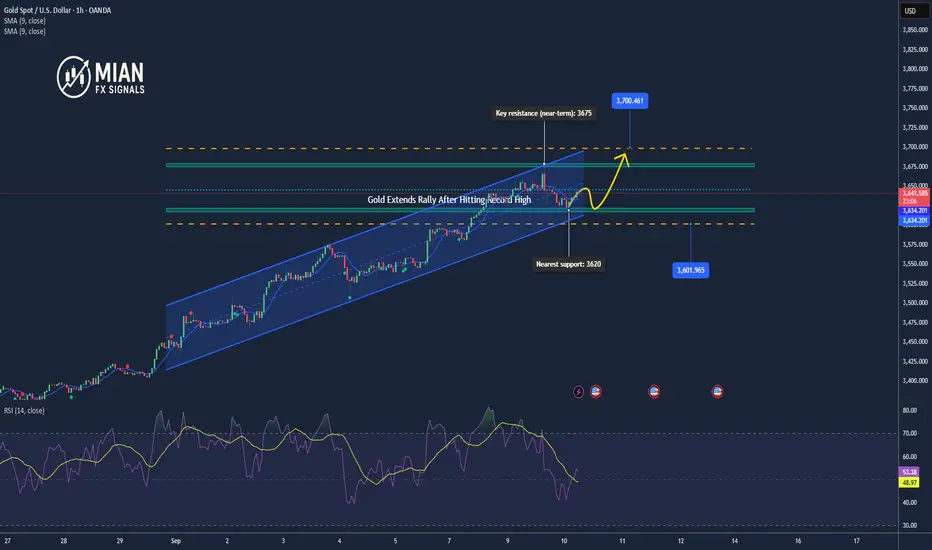
Gold testing highs, possible pullback below $3,675📊 Market Overview:
Gold surged to an all-time high at $3,673.95/oz on September 9, 2025, driven by Fed rate-cut expectations, USD weakness, and strong central bank demand.
On September 10, gold is consolidating around $3,635/oz, with markets awaiting key US inflation data.
📉 Technical Analysis:
• Key Resistance: $3,675 – $3,700
• Nearest Support: $3,600 – $3,620
• EMA: Price remains above EMA 09 → bullish momentum intact.
• Candlestick / Volume / Momentum: Technicals still show Strong Buy signals, but overbought conditions suggest short-term pullback risk.
📌 Outlook:
Gold may pull back in the short term if sellers defend the $3,675–$3,700 zone, but a breakout above this level could trigger another rally toward $3,720–$3,750.
💡 Trading Strategy Suggestion:
🔻 SELL XAU/USD: 3697 – 3700
🎯 TP: 40 / 80 / 200 pips
🛑 SL: 3703
🔺 BUY XAU/USD: 3617 – 3620
🎯 TP: 40 / 80 / 200 pips
🛑 SL: 3614
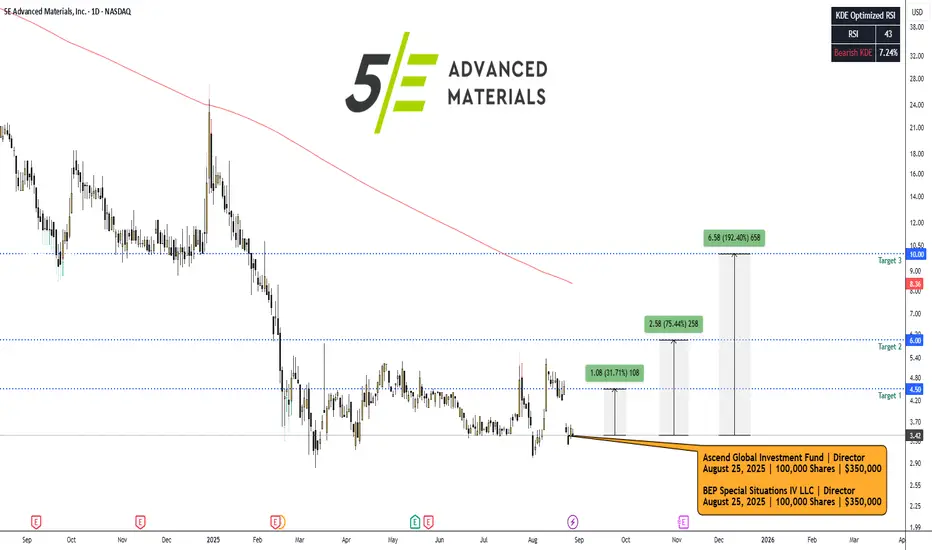
FEAM — 5E ADVANCED MATERIALS. August 27, 2025.NASDAQ:FEAM #FEAM — 5E ADVANCED MATERIALS (NASDAQ:FEAM) Insider Purchase Analysis | Basic Materials | Specialty Chemicals | USA | NASDAQ | August 27, 2025.
Overview: This report examines the recent insider purchases of FEAM shares on August 25, 2025, in the context of the company's operational focus on boron and lithium production. FEAM, a critical minerals developer with assets in California, has faced significant share price depreciation amid market challenges in the lithium sector. The insider activity, coupled with a concurrent public offering, signals potential confidence in near-term catalysts. We provide a comprehensive analysis for institutional consideration.
1. Insider Trading Context
Buyers and Transaction Details: On August 25, 2025, BEP Special Situations IV LLC (a director-affiliated entity) purchased 100,000 shares at $3.50 per share, increasing its holdings to 7,597,349 shares.
Similarly, Ascend Global Investment Fund SPC - Strategic Segregated Portfolio (potentially related) acquired 100,000 shares at the same price, bringing combined indirect beneficial ownership to 7,830,646 shares.
Additionally, CEO Paul Weibel III bought 1,628 shares, and CFO Joshua Malm purchased 1,425 shares, both at $3.50. These transactions coincide with the closing of an $8.31 million public offering of common stock at $3.50 per share, raising capital for operational advancements.
Size and Significance: The director/fund purchases represent the bulk of the activity, totaling ~$350,000 per entity, while executive buys are smaller (~$5,000–$6,000 each). Insider ownership stands at 79.00%, with recent transactions boosting it by 1.16%. Top holders include Bluescape Energy Partners LLC (37.45% of outstanding shares).
Bullish Signal Interpretation: Insider buys at depressed prices, especially amid a capital raise, often indicate confidence in undervaluation or upcoming catalysts. This aligns with FEAM's focus on boron (stable pricing at ~$757/MT in the U.S.) and lithium (recovering demand from EVs).
The stock rose 7.82% on August 26, 2025, post-announcement, suggesting market recognition of this vote of confidence. High insider ownership (79%) reduces agency risks and aligns interests with shareholders.
Charts:
• (1D)
• (5D)
• (1H)
Insider Trades:
FEAM Ownership:
SEC From 4:
www.sec.gov
www.sec.gov
2. Technical Analysis
Chart Overview (1-Year View): FEAM has been in a prolonged downtrend since September 2024, declining from ~$24 to $4.20 by August 2025, reflecting sector pressures.
A sharp drop in December 2024 (from $20 to $10) marked a breakdown below key support, followed by consolidation around $4–$6. The descending trendline (purple) connects highs from October 2024 onward, acting as resistance. Moving averages show bearish alignment: SMA20 ($3.57), SMA50 ($3.92), SMA200 ($6.34). Volume trends indicate spikes during sell-offs (e.g., December 2024, March 2025), with recent August 2025 volume elevated on the offering news.
Chart Overview (1-Month View): Short-term volatility is evident, with a bounce from $3.50 lows in late June to $5.00 highs in mid-August, followed by a pullback to $3.42. Candlestick patterns include a bullish engulfing on August 7–11 (green candles with volume spike), but recent red candles suggest profit-taking. RSI (14) at 38.40 indicates approaching oversold territory, potentially signaling a reversal if buying momentum builds.
Key Levels and Indicators:
• Support: $3.00 (psychological floor, recent lows), $2.82 (52-week low).
• Resistance: $4.00 (near-term), $5.00 (mid-August high), $6.00 (SMA200 convergence).
• Trendlines: Bearish descending channel intact; a break above $4.00 could invalidate.
• RSI/MACD: RSI neutral-to-oversold (38.40); MACD not shown but implied convergence on pullback suggests potential bullish crossover if volume supports.
• Volume and Patterns: Average volume 35K; recent spikes (e.g., 131K on August 27) correlate with news. No clear reversal patterns yet, but insider buys at $3.50 may establish a base.
➖➖➖
3. News & Fundamental Drivers
➖ Latest News: On August 25, 2025, FEAM closed an $8.31 million public offering to fund project development, including its Fort Cady boron-lithium project. An updated technical report was released on August 12, 2025, highlighting resource estimates. The company presented at the Sidoti Micro-Cap Conference on May 22, 2025.
➖ Earnings Reports: Fiscal Q3 2025 (ended March 31, 2025, reported May 15, 2025) showed EPS of -$1.68, missing estimates of -$1.31 by $0.37. TTM EPS stands at -$16.11, with no sales reported (pre-commercial stage). ROA -44.56%, ROE -82.77%, reflecting development-phase losses. Next earnings expected September 8, 2025.
➖ Sector Outlook: The boron market is projected to grow from $3.63B in 2025 at >4% CAGR, driven by glass, ceramics, and agriculture demand. Lithium supply currently outpaces demand, stabilizing prices in 2025, but EV battery growth forecasts >400 GWh demand by year-end, with potential shortages ahead.
Catalysts include U.S. tariffs on imports, FEAM's domestic production advantages, and project milestones (e.g., commercial boron output).
➖➖➖
4. Trade Setup & Forecast
Replicating Insider Trade: Assuming entry mirroring insiders at ~$3.50 (current price $3.42 offers a slight discount).
Entry Price: $3.42–$3.50.
Price Targets:
➡️ Short-term (1–3 months): $4.50 (break above resistance, +31.6%).
➡️ Mid-term (3–6 months): $6.00 (SMA200 test, +75.4%).
➡️ Long-term (6–12 months): $10.00 (channel breakout, +192.4%).
We recommend a Strong Buy with 25–35% potential upside over the next 6 months, targeting $4.50–$4.75 on project milestones.
Disclaimer: This report is for informational purposes only and does not constitute investment advice. Past performance is not indicative of future results.