Near can act as rochet 24$ gain toward 2.81$ is on the table Hi the support and resistances on the chart are based on the previous data and weekly candlesticks if BINANCE:NEARUSDT holds this last support the potential of 24% gain is logical toward 2.81$
Contains image

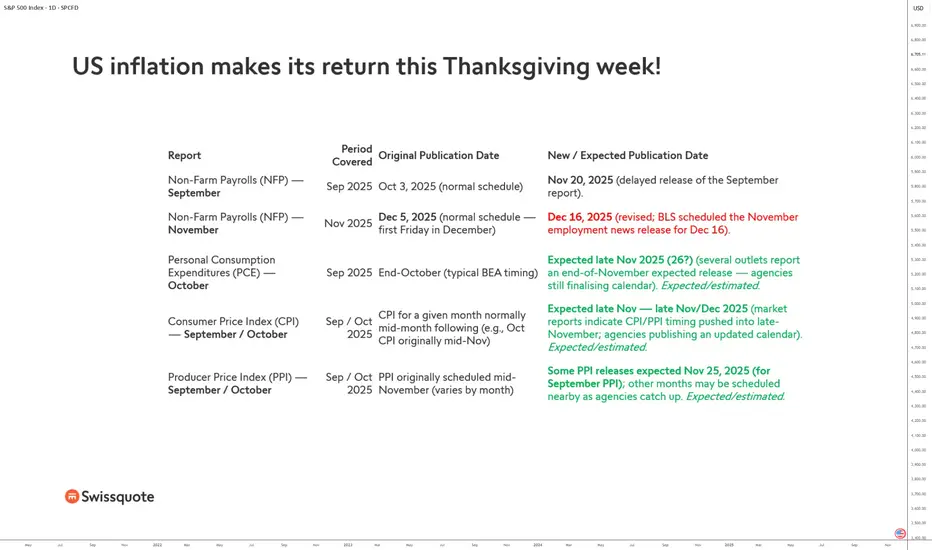
US inflation makes its return this Thanksgiving week!For several weeks, financial markets have been operating with reduced visibility. The reason: the latest U.S. shutdown, which paralyzed part of the federal administration and caused an exceptional delay in the publication of numerous major macroeconomic statistics. Yet these figures, usually released according to a precise schedule, form the analytical backbone for investors and for the Federal Reserve (Fed). The situation should finally normalize during this Thanksgiving week, with a long-awaited catch-up, particularly regarding PCE inflation, the Fed’s preferred inflation indicator.
One of the most notable delays concerns the Non-Farm Payrolls (NFP) series. The September report, originally scheduled for October 3, was only released last Thursday. The November report, normally published in early December, will not appear until December 16—after the Fed’s December 10 meeting. These delays are due to the need for U.S. statistical agencies to rebuild their data and validation processes after several weeks of forced shutdown.
But the central focus of market attention remains the PCE (Personal Consumption Expenditures) index for October, a key figure for anticipating the Fed’s monetary stance at its December 10 meeting. This report was expected at the end of October under the standard Bureau of Economic Analysis (BEA) timeline. Now, several converging sources indicate a release expected this week, likely on November 25 and 26, as agencies finalize their revised calendar. It is therefore during Thanksgiving week that investors will finally receive these crucial numbers.
The uncertainty does not end there. Consumer Price Index (CPI) and Producer Price Index (PPI) reports for September and October have also been delayed. Markets now anticipate publication “late November to early December,” giving agencies time to fully adjust their distribution processes.
Some components of the PPI, particularly for September, may be released as soon as November 25, with remaining figures following shortly after.
This major catch-up comes at a decisive moment. With the Fed set to decide on December 10 about a potential adjustment to its monetary policy, every inflation data point carries considerable weight. The PCE numbers, in particular, will provide a clearer snapshot of price dynamics during the autumn, and therefore of the central bank’s room for maneuver should it consider a 0.25% rate cut.
DISCLAIMER:
This content is intended for individuals who are familiar with financial markets and instruments and is for information purposes only. The presented idea (including market commentary, market data and observations) is not a work product of any research department of Swissquote or its affiliates. This material is intended to highlight market action and does not constitute investment, legal or tax advice. If you are a retail investor or lack experience in trading complex financial products, it is advisable to seek professional advice from licensed advisor before making any financial decisions.
This content is not intended to manipulate the market or encourage any specific financial behavior.
Swissquote makes no representation or warranty as to the quality, completeness, accuracy, comprehensiveness or non-infringement of such content. The views expressed are those of the consultant and are provided for educational purposes only. Any information provided relating to a product or market should not be construed as recommending an investment strategy or transaction. Past performance is not a guarantee of future results.
Swissquote and its employees and representatives shall in no event be held liable for any damages or losses arising directly or indirectly from decisions made on the basis of this content.
The use of any third-party brands or trademarks is for information only and does not imply endorsement by Swissquote, or that the trademark owner has authorised Swissquote to promote its products or services.
Swissquote is the marketing brand for the activities of Swissquote Bank Ltd (Switzerland) regulated by FINMA, Swissquote Capital Markets Limited regulated by CySEC (Cyprus), Swissquote Bank Europe SA (Luxembourg) regulated by the CSSF, Swissquote Ltd (UK) regulated by the FCA, Swissquote Financial Services (Malta) Ltd regulated by the Malta Financial Services Authority, Swissquote MEA Ltd. (UAE) regulated by the Dubai Financial Services Authority, Swissquote Pte Ltd (Singapore) regulated by the Monetary Authority of Singapore, Swissquote Asia Limited (Hong Kong) licensed by the Hong Kong Securities and Futures Commission (SFC) and Swissquote South Africa (Pty) Ltd supervised by the FSCA.
Products and services of Swissquote are only intended for those permitted to receive them under local law.
All investments carry a degree of risk. The risk of loss in trading or holding financial instruments can be substantial. The value of financial instruments, including but not limited to stocks, bonds, cryptocurrencies, and other assets, can fluctuate both upwards and downwards. There is a significant risk of financial loss when buying, selling, holding, staking, or investing in these instruments. SQBE makes no recommendations regarding any specific investment, transaction, or the use of any particular investment strategy.
CFDs are complex instruments and come with a high risk of losing money rapidly due to leverage. The vast majority of retail client accounts suffer capital losses when trading in CFDs. You should consider whether you understand how CFDs work and whether you can afford to take the high risk of losing your money.
Digital Assets are unregulated in most countries and consumer protection rules may not apply. As highly volatile speculative investments, Digital Assets are not suitable for investors without a high-risk tolerance. Make sure you understand each Digital Asset before you trade.
Cryptocurrencies are not considered legal tender in some jurisdictions and are subject to regulatory uncertainties.
The use of Internet-based systems can involve high risks, including, but not limited to, fraud, cyber-attacks, network and communication failures, as well as identity theft and phishing attacks related to crypto-assets.
Hellena | GOLD (4H): LONG to resistance area of 4382(Wave 3).In the past forecast, many have rightly pointed out that wave “4” went behind the high of wave “2” and yet we are not dealing with a diagonal.
This means that the waves have stretched and have a larger range of motion and now the correction in wave “2” is ending.
Essentially the upward movement is still prioritized and I expect two scenarios:
1) Continuation of the upward movement to the resistance area of 4382 (market entry)
2) Reaching the support area 3994.4, after which the correction can be considered complete and only then the movement to the area 4382 will start.
Manage your capital correctly and competently! Only enter trades based on reliable patterns!

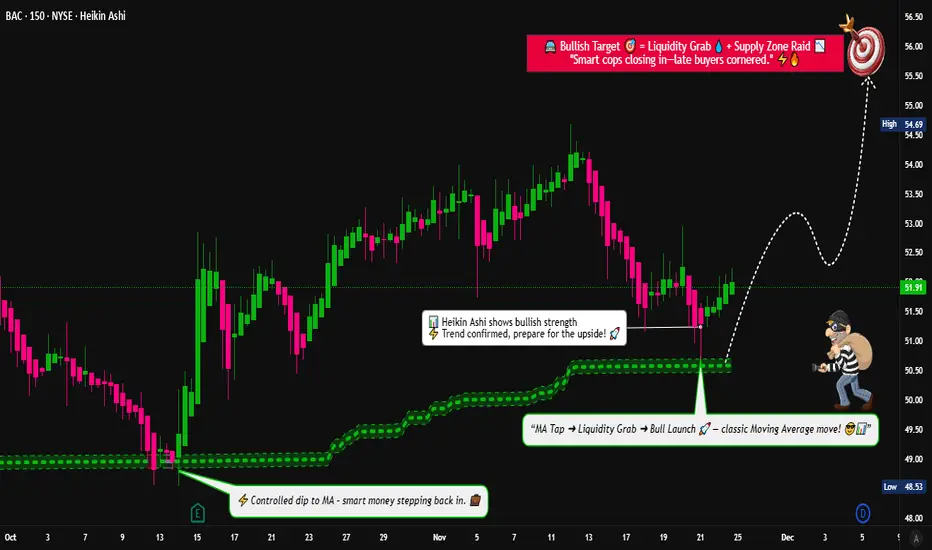
BAC Pullback Into MA — Is This the Next Swing Continuation Move?🔥📈 BAC — Bullish Pullback Playbook Into MA | Thief-Style Layer Entry 📊💼
Hey Traders! 😎
Here’s my Bullish Pullback Into Moving Average playbook on BAC — Bank of America Corp (NYSE).
Clean setup, thief-friendly layering, and a classy escape plan 😅🕶️💸
📘 Asset
BAC — Bank of America Corporation (NYSE)
Swing-trade style breakdown with a professional twist and a few laughs for the OG Thief Family 😄💼
🎯 Plan: Bullish Pullback Into the Moving Average
Price is dipping beautifully back toward key Moving Averages — classic bullish continuation behavior.
I’m monitoring for strength after the pullback along the MA zone. ✔️
🟦 Entry Plan (Thief Layering Strategy)
Thief strategy = multiple limit orders placed at different value zones.
This helps average in during the pullback without chasing. 👇💰
🔥 Layered Buy Limit Zones:
50.50
51.00
51.50
52.00
(Feel free to extend the layers if your own plan requires it.)
This is NOT a buy signal — only an example of a layering method for educational purposes.
🛑 Stop Loss (Thief Style)
Thief SL zone: 49.00
This is merely an illustrative SL point in my personal playbook style.
Note: Dear Ladies & Gentlemen (Thief OG’s), I am not recommending that you use my SL.
You make your own decisions and manage risk according to your plan.
🎯 Target Zone
We have strong resistance overhead + extended levels + potential liquidity traps.
So the smart thief knows when to take the bag and vanish 🏃💨💰
My take-profit zone: 56.00
Note: Dear Ladies & Gentlemen (Thief OG’s), I am not recommending that you use my TP.
You make your own choices — take money when you want, at your own risk.
🧠 Market Notes & Why the Setup Works
Price respecting MA structure
Clear bullish momentum on higher timeframes
Liquidity resting above recent swing levels
Healthy pullback with momentum probability toward continuation
Good behavior around institutional zones
🔗 Related Pairs to Watch (Correlation Insight)
BAC has measurable correlation with U.S. financial-sector instruments. Watching them helps confirm sentiment 🧩📊
AMEX:XLF — Financial Select Sector ETF
When XLF is strong, BAC often follows the broader sentiment.
NYSE:JPM — JPMorgan Chase
Sector correlation; bullish flow here can support BAC continuation.
$C — Citigroup
Similar pullback and continuation behavior; keep an eye on banking flow.
AMEX:SPY — S&P 500
Strong indices = supportive environment for major banks.
📘 Quick Correlation Summary
Banking stocks move together due to macro factors like rates, liquidity, and earnings expectations.
Strong AMEX:XLF + bullish AMEX:SPY generally improves probability for bullish pullbacks in BAC.
If all “sister pairs” show weakness, expect slower continuation.
✨ “If you find value in my analysis, a 👍 and 🚀 boost is much appreciated — it helps me share more setups with the community!”
⚠️ Disclaimer
This is a thief-style trading strategy created for educational and fun purposes only.
Not financial advice, not signals, and not a recommendation to buy or sell any asset.
Nasdaq 100, USD Index: Thanksgiving PerformanceToday I’m digging into my Excel data to see how the Nasdaq and the US Dollar Index performed across the three trading days either side of Thanksgiving.
Matt Simpson, Market Analyst at City Index.

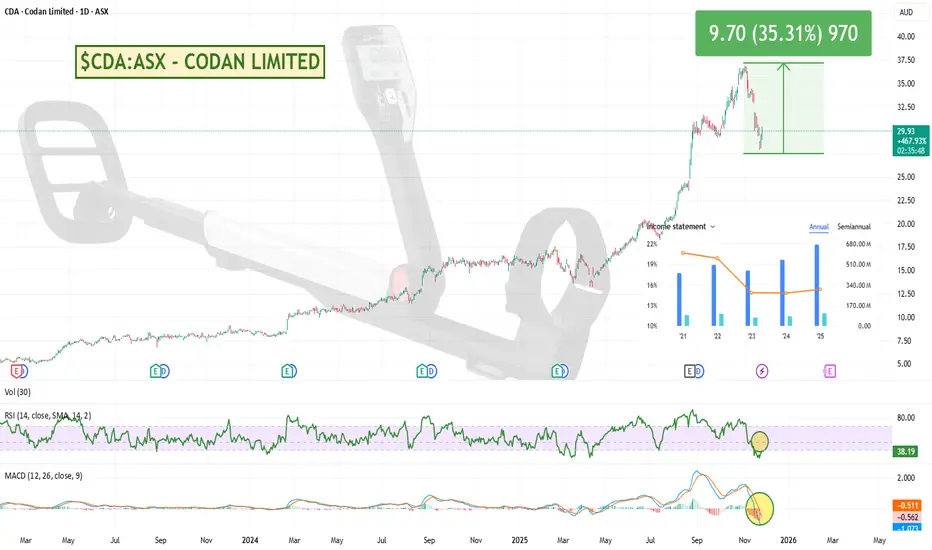
Momentum Surge Meets PullbackCodan (Australian stock) has had a great 450%+ run over the last couple of years and finally had a decent 25% pullback into a better value area.
Might be worth a watch to see if it can regain its previous momentum and run again.
GOLD VERY CLOSE TO BREAKING OUT VERSUS THE STOCK MARKET.Gold very close to breaking out vs stock market.
Lots of room left to outperform.

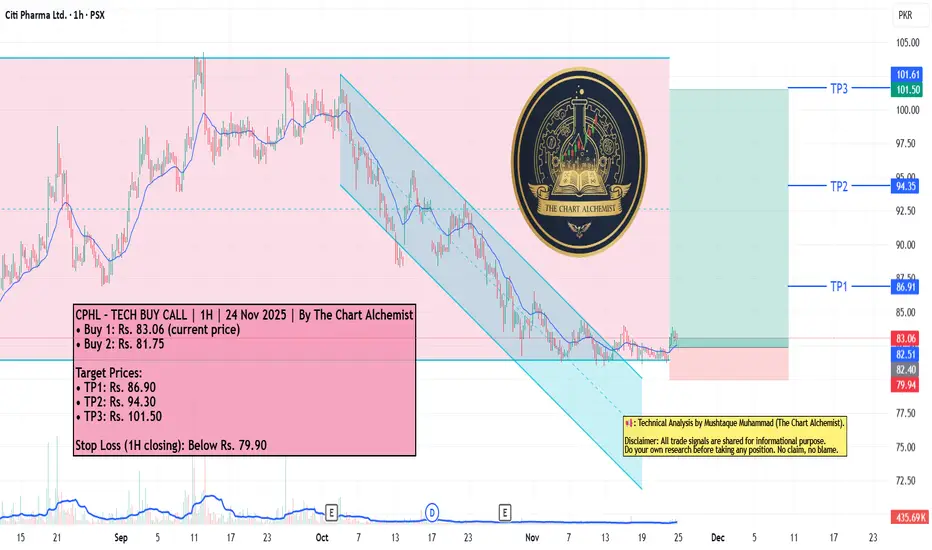
CPHL – TECH BUY CALL | 1H | 24 Nov 2025 | By The Chart AlchemistCPHL – TECH BUY CALL | 1H | 24 Nov 2025 | By The Chart Alchemist
CPHL has been moving within a long-standing trading range between Rs. 79 and Rs. 104, highlighted by a light-pink channel. After completing its bearish leg, the stock broke out of the blue bearish channel and is now offering a third-entry long setup, signaling renewed bullish potential toward higher targets.
📢 Technical Analysis by Mushtaque Muhammad (The Chart Alchemist).
SPL – TECH BUY CALL | 2H | 24 Nov 2025 | By The Chart Alchemist SPL – TECH BUY CALL | 2H | 24 Nov 2025 | By The Chart Alchemist
SPL recently completed a reaccumulation phase forming a diverging triangle. After breaking out, the stock successfully achieved its initial targets and is now positioned for continuation toward higher bullish objectives.
📢 Technical Analysis by Mushtaque Muhammad (The Chart Alchemist).

LPGL – TECH BUY CALL | 1D | 24 Nov 2025 | By The Chart AlchemistLPGL – TECH BUY CALL | 1D | 24 Nov 2025 | By The Chart Alchemist
LPGL has been trading within a defined trading range, marked by a light-pink channel. After touching the lower boundary of this range, the stock produced a strong bullish reversal and is now positioned for continuation toward multiple upside targets.
📢 Technical Analysis by Mushtaque Muhammad (The Chart Alchemist).

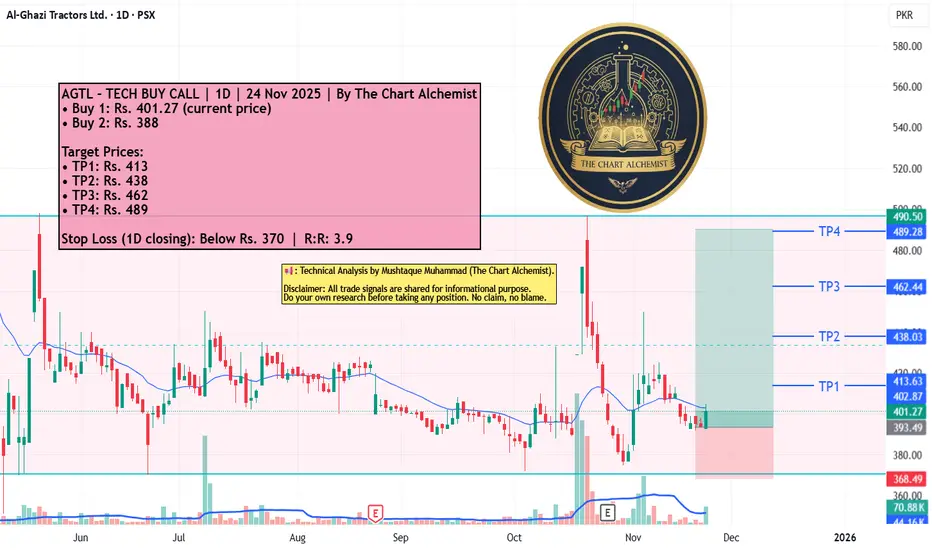
AGTL – TECH BUY CALL | 1D | 24 Nov 2025 | By The Chart AlchemistAGTL – TECH BUY CALL | 1D | 24 Nov 2025 | By The Chart Alchemist
After declining from Rs. 725 to Rs. 350, AGTL entered a wide lateral range between Rs. 350 and Rs. 500. After touching the lower boundary, the stock formed a bullish flag breakout, confirming reversal momentum and positioning price for a continued move toward higher upside targets.
📢 Technical Analysis by Mushtaque Muhammad (The Chart Alchemist).
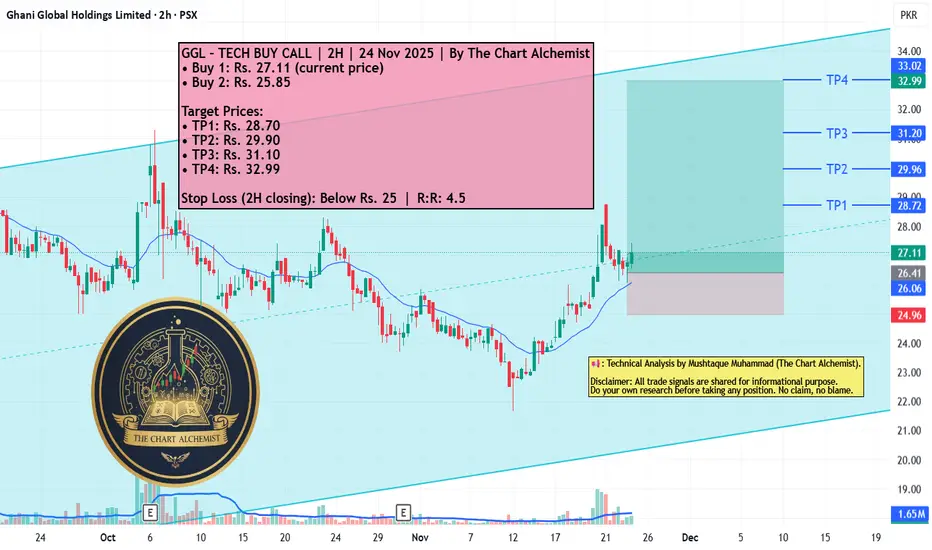
GGL – TECH BUY CALL | 2H | 24 Nov 2025 | By The Chart Alchemist GGL – TECH BUY CALL | 2H | 24 Nov 2025 | By The Chart Alchemist
GGL has been moving within a bullish channel and recently completed its bearish leg at Rs. 21.70. The stock has shown a strong reversal with multiple bullish structures forming, indicating renewed upward momentum toward higher targets.
📢 Technical Analysis by Mushtaque Muhammad (The Chart Alchemist).
FFC – TECH BUY CALL | 1H | 25 Nov 2025 | By The Chart Alchemist FFC – TECH BUY CALL | 1H | 24 Nov 2025 | By The Chart Alchemist
FFC is trading inside a higher-timeframe bullish channel. After touching the bottom boundary, the stock formed an expanding triangle and is showing strong signs of reversal. With structure aligned for upside continuation, FFC is expected to move toward the top of the channel.
📢 Technical Analysis by Mushtaque Muhammad (The Chart Alchemist).

MOMENTUM STOCK: Penta-Ocean Construction (Japan exchange)Penta-Ocean is traded on the Tokyo Exchange and focuses on marine and land-based construction projects.
Its stock price is showing incredible momentum, with a remarkable 156% gain over the past year and a consistent pattern of higher highs across all timeframes, indicating a strong, sustained uptrend.
This stock exemplifies the kind of price strength momentum traders seek. However, the current technical setup suggests the stock is quite extended. Its RSI at 70+ indicates it's currently overbought , and there's no sign of a recent pullback, making it a high-caution entry for immediate positions.
While the stock is clearly trending above its 50-day and 200-day EMAs, patience for a healthy pullback could offer a better risk/reward entry.
Fundamentals are generally supportive with strong revenue growth and a healthy market cap, although earnings momentum is mixed.
Could be worth a watch after a pullback, but good to see a stock that has largely ignored the recent market turmoil.

FER | Highway and Freeway Construction will Rise | LONGFerrovial SE provides infrastructure construction and transportation services. It offers all kinds of services related to urban and interurban transport infrastructure, either by land, sea or air. The company was founded by Rafael del Pino y Moreno on December 18, 1952 and is headquartered Amsterdam, the Netherlands.

Latest Gold Update Today!Hey traders,
As we kick off this new week, XAUUSD is holding steady, hovering around the 4,050-dollar level with barely any noticeable volatility.
This calm price action comes as the market keeps a close eye on what the Federal Reserve plans to do next. More and more participants are expecting the Fed to shift toward a more dovish stance and potentially move closer to a rate cut by the end of the year. With bond yields slipping, the dollar gradually losing strength, and safe-haven demand picking back up, gold is getting a solid foundation for a possible short-term push higher.
From a technical standpoint, XAUUSD is tightening inside a triangle pattern — a classic setup that usually signals accumulation before a stronger impulsive move. If price manages to break above the upper boundary, the next target could stretch toward the 4,500-dollar region, supported by the strength of the previous bullish leg.
From my perspective, market sentiment is slowly leaning toward the buyers, especially if upcoming U.S. data continues to ease pressure on gold.
What about you? How do you see things playing out? Are you expecting more upside, or do you think a correction is coming?
Wishing you a smooth, confident, and profitable trading week ahead.

Weekly and Monthly Forecast
Hello, fellow traders!
Follow us to get the latest information quickly.
Have a great day!
-------------------------------------
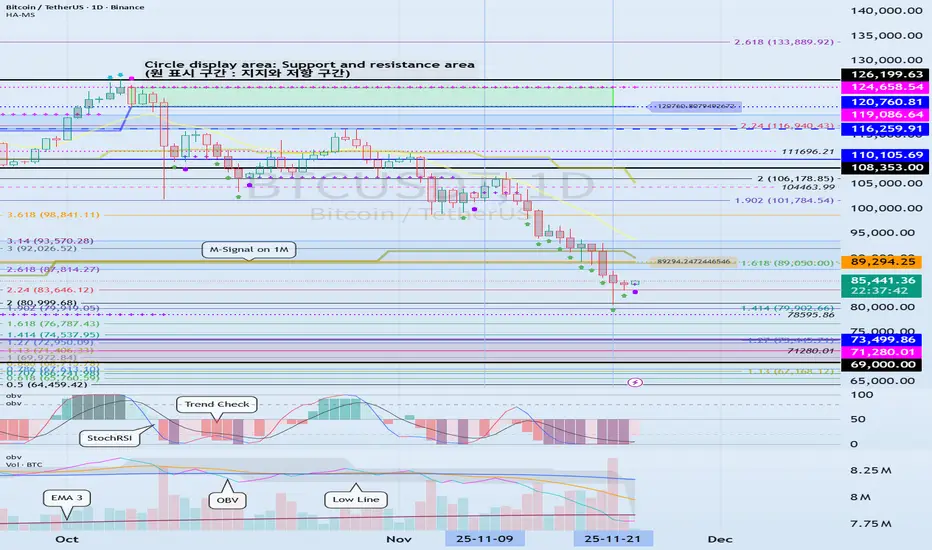
(BTCUSDT 1D chart)
The volatility period has ended.
The key is whether it can rise above 89294.25.
If not, we need to check for support near 69000-73499.86.
(1W chart)
The following are important areas as the price falls below the third range:
- 116259.91-119086.64
- 87814.27-93570.28
- 69000-73499.86
A decline below the 69000-73499.86 range can be considered a long-term downtrend, so this is a very important area for now.
Therefore, as the price approaches the 69000-73499.86 range, we need to check for increased trading volume or the emergence of a new HA-Low indicator on the 1W chart.
If the HA-Low indicator is formed, it's important to determine whether there's support near it.
The basic trading strategy is to buy in the DOM(-60) ~ HA-Low range and sell in the HA-High ~ DOM(60) range.
If the price rises near the HA-Low indicator and moves toward the HA-High indicator, the wave should be considered closed (reset).
Conversely, if the price falls near the HA-High indicator and moves toward the HA-Low indicator, the wave should also be considered closed (reset).
A closed (reset) wave means that the trend has been reestablished.
Therefore, as mentioned earlier, the basic trading strategy is created.
However, if the price rises in the HA-High ~ DOM(60) range, a stepwise uptrend is likely, while if the price falls in the DOM(-60) ~ HA-Low range, a stepwise downtrend is likely.
The end of a stepwise uptrend is a decline, and the end of a stepwise downtrend is a rise.
Therefore, a decline after encountering the HA-Low indicator is different from a decline after encountering the HA-High indicator.
Therefore, a stepwise downtrend indicates a period of truncation buying, while a stepwise uptrend indicates a period of truncation selling.
During a stepwise downtrend, even if the price declines, there's an expectation that a price increase will occur soon, so you can increase the number of coins (tokens) representing profit.
This method involves trading at each purchase price and selling the same amount of coins (tokens) when the price rises, thereby increasing the number of coins (tokens) representing profit.
The coins (tokens) representing profit are those with a purchase price of 0, which can lead to significant profits later.
-
A bullish trend can be considered when the price rises above the M-Signal indicator on the 1M chart and holds.
However, the point where you should actually buy is when the price rises above 108353.0.
Based on the current trend, the next volatility period is expected around December 23rd.
Therefore, you should check to see if the price holds above 89294.25 during the next volatility period.
Therefore, it appears likely that the price will move sideways to reverse the trend.
Based on the price movement, the start of a major bear market is expected to begin after the first quarter of next year.
However, if the price falls below 69000-73499.86, you should consider this a bear market and consider a response plan.
-
Thank you for reading to the end.
I wish you successful trading.
--------------------------------------------------
- Here's an explanation of the big picture.
(3-year bull market, 1-year bear market pattern)
I'll explain more in detail when the bear market begins.
------------------------------------------------------
$NDX - Grab my strong handSame thing as SP:SPX
Buyers looking to close >24,700
Sellers looking to contain below <24,700
OUTLOOK = Mixed, buy dips // sell rips
**** Weekly view below

NVDA Katy AI Analysis – Neutral, Monitor for BreakoutNVDA QuantSignals Katy 1M Prediction – 2025-11-24
Current Price: $179.09
Final Prediction: $179.64 (+0.30%)
30-min Target: $179.46 (+0.20%)
Trend: NEUTRAL
Confidence: 55%
Volatility: 13.3%
⚠️ Trade Signal:
No trade generated – insufficient confidence and move size
🧠 Analysis Summary:
Katy AI shows minor upside but not enough for actionable entry
Low expected movement implies limited risk/reward opportunity
Traders may monitor for upcoming catalysts or volatility spikes

QuantSignals V3: VIX Bear Put Alert – Big Volatility Play Ahead!VIX (QuantSignals Katy 1M | 2025-11-24)
Direction: BUY CALL
Confidence: 75%
Current Price: $21.27
Entry: $21.27
Target: $23.14 (+8.8% from entry)
Stop Loss: $20.95 (–1.5% from entry)
Expected Move: +11.01%
30min Target: $22.07 (+3.77%)
Trend: BULLISH
Volatility: 130.8%
📈 Technical Overview
Strong bullish momentum observed by Katy AI
Short-term (30 min) upside target: $22.07
Medium-term 1-month target: $23.61
High volatility environment → larger option premiums expected
⚡ Trade Setup Notes
Consider small position size due to high volatility
Use tight risk management with stop at $20.95
Entry at current level $21.27 captures immediate bullish trend
📰 Summary
1 trade signal generated from 1 analyzed symbol
High confidence (75%) supports bullish call setup
VIX likely to increase over next 1 month, providing upside opportunity

XAUUSD – Developing (C) Wave Structure Inside Channel
Gold is currently forming a clean Elliott Wave structure inside an ascending channel, and the internal price action suggests we may still be inside a developing Wave (C) before a much larger bearish reversal.
Current Elliott Wave Outlook
The move from the 3,998 low has unfolded as:
Wave (A) – impulsive leg up into the top channel boundary
Wave (B) – corrective decline back to channel support
Wave (C) – still under development, with internal subwaves forming
Inside Wave (C), the chart shows:
(1) completed impulsive wave
(2) corrective pullback into the 0.786 retracement
(3) projected extension toward the upper channel boundary (1.272–1.618 confluence zone)
(4) expected pullback
(5) final push into the top resistance zone of the pattern
This aligns perfectly with the Fibonacci cluster around:
1.13 → 4,112
1.272 → 4,130
1.414 → 4,150
1.618 → 4,154
Bigger Picture
The entire structure appears to be forming a rising wedge / diagonal-like pattern, suggesting that once Wave (5) of (C) completes, a sharp and aggressive bearish reversal is expected. The large red arrow on the chart reflects this expectation.
What to Watch
✔ Price reaching the 4,130–4,155 area (strong fib resistance)
✔ Reaction at the top channel boundary
✔ Momentum divergence on RSI as Wave (5) forms
✔ Breakdown below the lower channel for confirmation of the larger drop
A clean 5-wave completion inside this wedge typically leads to a fast and deep correction.

XAUUSD – Descending Diagonal as Wave (1) of COn the 15m chart, the drop from the recent high is unfolding as a descending leading diagonal, which I am labelling as wave (1) of a larger C wave. Price is respecting the contracting channel with clear 5 overlapping swings, typical of a wave 1 diagonal rather than a clean impulse.
From here I expect a corrective wave (2) to the upside before a stronger sell-off in wave (3) of C:
Potential retracement area for wave (2): 0.5–0.618 of wave (1), roughly the 4,080–4,100 zone.
As long as price stays below the origin of wave (1) (~4,135), the diagonal scenario remains valid. A break above that level invalidates this count.
If the structure plays out, the projected targets for wave (3) of C sit near the 1.272 and 1.618 extensions of wave (1), around 3,990 and 3,950.
Trading plan idea: look for signs of exhaustion / reversal in the 4,080–4,100 area to position short for a potential wave (3) of C, with invalidation above 4,135 and partial profits around the Fibonacci extension levels.
This is an Elliott Wave scenario, not financial advice – manage your own risk and invalidate the count quickly if price action proves it wrong.

QuantSignals V3: PLTR Weekly Put Play – Strong Bearish Momentum!PLTR Weekly (QuantSignals V3 | 2025-11-24)
Direction: BUY PUTS
Confidence: 60%
Expiry: 2025-11-28 (4 days)
Strike Focus: $148.00
Entry Range: $0.52 – $0.55 (mid: $0.54)
Target 1: $0.85 (≈63% gain)
Target 2: $1.10 (≈100% gain)
Stop Loss: $0.35 (≈35% loss)
Position Size: 2% of portfolio (moderate conviction)
Weekly Momentum: BEARISH (–1.07% 1W)
Put/Call Ratio: 1.01 (Neutral flow bias)
Flow Intel: Neutral, unusual activity at $132 put
Current Price: $162.41
Risk Level: ⚠️ Moderate – elevated VIX (23.43)
📈 Technical Overview
Weekly momentum: BEARISH (–1.07%)
Support: $147.56 (weekly low)
Resistance: $174.57
RSI oversold at 24.0 → continuation possible
MACD histogram confirms downward momentum
Price below session open $170.75 → intraday weakness
Chart Tips:
Draw support at $147.56 and resistance at $174.57
Highlight entry band $0.52–$0.55
Mark targets $0.85 / $1.10 and stop $0.35
Monitor for news that could reverse bearish setup
📰 Fundamental / Sentiment Notes
Mixed news, partnerships announced but selling pressure continues
Institutional positioning suggested by unusual options activity
Katy AI predicts downward target $157.27 → confirms bearish momentum
⚠️ Risk Notes
Katy AI NEUTRAL classification (50% confidence) → conservative sizing
High volatility (VIX 23.43) → premium cost elevated, opportunity exists
4-day expiry → monitor Thursday exit or roll if needed
