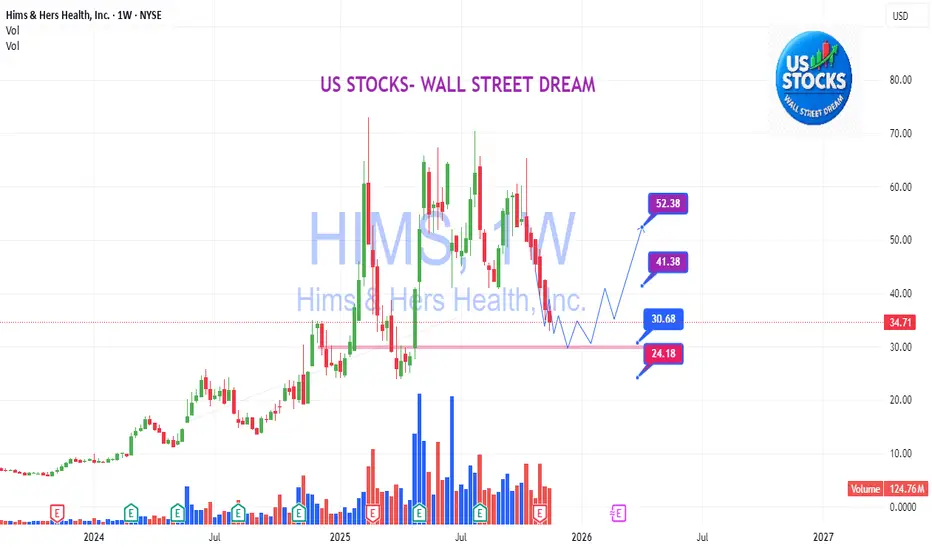
HIMS: timing to buy the dip!HIMS:
Timing to buy the dip!
Wait for more drop, for an optimal plan.
US STOCKS- WALL STREET DREAM- LET'S THE MARKET SPEAK!
Contains image
RBLX- LONG VIEWRBLX- LONG VIEW
.
Backtest and hope for drop at the solid key level at demand zone, and fibo retracement at golden zone 0.618.
.
US STOCKS- WALL STREET DREAM- LET'S THE MARKET SPEAK!

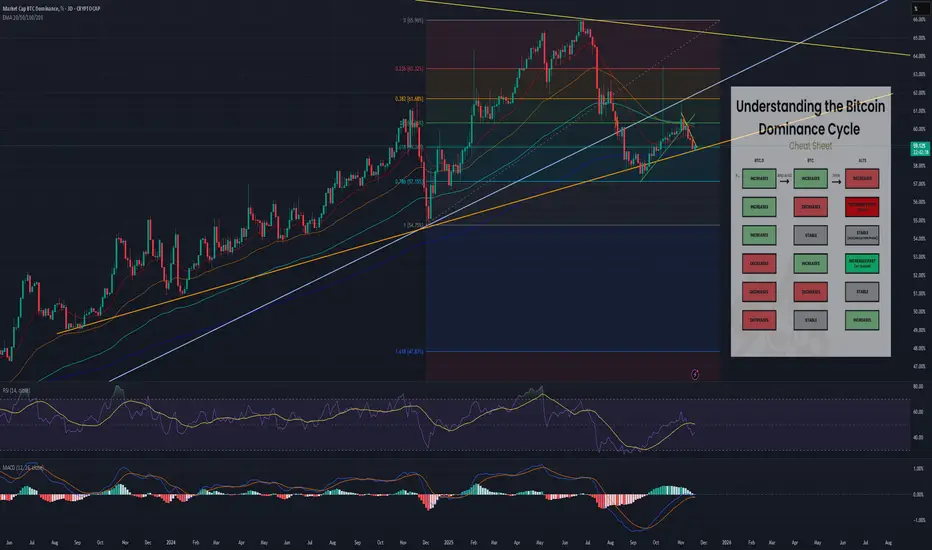
BTC.D Compression at Support — Preparing for Next LegBitcoin Dominance is sitting on one of the most important macro support levels of the last 2–3 years. The orange trendline on this chart has been touched 5+ times since 2023 and has acted as a major structural support throughout the entire bull cycle.
Now, BTC.D is testing this line again — and the next move will determine whether we get another leg of BTC dominance or the start of a real altcoin season.
🔶 1. BTC.D at Macro Support
Dominance is currently resting right on the long-term ascending trendline.
This line has held through every major market rotation so far — making this a critical decision point.
A clean break below it would flip the whole structure.
📉 2. Momentum Is Weakening
Several indicators point to pressure on dominance:
RSI rolling over from mid-high levels
MACD losing momentum on the 3D
Lower highs forming since the 65.9% top
This suggests the market is shifting away from a BTC-only move.
💡 3. BTC Relief Rally Will Decide Everything
Bitcoin looks due for a relief rally, but how BTC moves is crucial:
If BTC pumps violently → dominance spikes → alts bleed
(typical liquidity vacuum)
If BTC rallies steadily and cleanly → dominance breaks → alts gain strength
This is the setup for a classic alt rotation.
If BTC goes sideways afterward → dominance collapses → full alt season triggers
This is the most bullish scenario for altcoins.
🚀 4. What Happens If the Orange Trendline Breaks?
A confirmed breakdown below 58.8%–59% on the 3D/weekly would likely spark:
ETH outperformance
SOL and high-beta L1s exploding
L2 ecosystems taking off (BASE / OP / ARB)
Microcaps accelerating aggressively
This would be a true altcoin season, not the small rotations we’ve seen recently.
📈 5. Probability Outlook
BTC relief rally: 80%
BTC.D breakdown: ~60%
Full alt cycle: 50%
Major alt season (2021-style): ~30%
Dominance is weakening, but confirmation requires a clean close under support.
🎯 Summary
BTC.D is at a decisive macro level.
A breakdown of the orange trendline would open the door to a broad altcoin rally, while a bounce keeps Bitcoin in control.
This is the moment to watch for rotation signals.
MSFT: backtest demand, and chance for shortMSFT:
.
Backtest demand, and chance for short.
Smart money confirmed with high weekly candle and volume.
.
US STOCKS- WALL STREET DREAM- LET'S THE MARKET SPEAK!

HYPE Breakdown – No Floor Until 26.8 5REntry: $29.70-30.20
x5-10 lev
SL: $31.0
TP1: $27.40
TP2: $26.80–$26.20
There's absolutely no support below in the next major node is 26 and 27 so this is really giving us a clear short hi RR and almost zero bullish interference.
scalp target higher lev and risk? 29.60, 29.30

EUR-JPY Free Signal! Buy!
Hello,Traders!
EURJPY dipped into the horizontal demand, running sell-side liquidity before showing initial bullish displacement. If demand holds, price may seek buy-side liquidity toward the marked take-profit zone.
--------------------
Stop Loss: 179.723
Take Profit: 180.478
Entry: 180.024
Time Frame: 2H
--------------------
Buy!
Comment and subscribe to help us grow!
Check out other forecasts below too!
Disclosure: I am part of Trade Nation's Influencer program and receive a monthly fee for using their TradingView charts in my analysis.

FireHoseReel | Engulfing Candlestick Pattern (Crypto Version)🔥 Welcome FireHoseReel !
Let’s dive into the Engulfing Candlestick Pattern.
✔️ Bearish Engulfing – Basics
The Bearish Engulfing is a two-candlestick reversal pattern.
The first candle is bullish, and the second is a larger bearish candle that fully engulfs the first candle’s body and closes below its low.
Since crypto rarely has gaps, the key condition is that the second body completely covers the first body.
Shadows are not significant.
This pattern is most reliable after a weakening uptrend.
🎯 Bearish Engulfing – Psychology
This pattern shows a strong bearish shift.
Buyers push price upward at first, but the second candle proves sellers have taken full control, dragging price down and even breaking the previous candle’s low.
It signals momentum shifting from bulls to bears.
🧮 Bearish Engulfing – Setup & Levels
• Trigger: Break below the low of the second candle.
• Confirmation: A close below the trigger.
• Stoploss: Above the high of the second candle or whole structure.
• Buy-stop entry: Only if the main trend remains strongly bullish (rare in crypto).
✔️ Bullish Engulfing – Basics
The Bullish Engulfing is a two-candlestick reversal.
The first candle is bearish, and the second is a larger bullish candle that fully engulfs the first body and closes above its high.
In crypto, the key factor is that the second bullish body fully covers the first bearish body.
It works best after a downtrend or capitulation phase.
🎯 Bullish Engulfing – Psychology
This pattern indicates a strong bullish reversal.
Sellers control the first candle, but buyers return aggressively on the second candle, overpowering them and closing above the previous high.
It signals momentum shifting from bears to bulls.
🧮 Bullish Engulfing – Setup & Levels
• Trigger: Break above the high of the second candle.
• Confirmation: A close above the trigger.
• Stoploss: Below the low of the second candle or structure.
• Sell-stop entry: Only in strong downtrends and rarely recommended.
🛞 Risk Management & Disclaimer
Please remember to always use proper risk management and position sizing. Nothing in this analysis is financial advice. The market can change quickly, so always trade based on your own strategy, research, and risk tolerance. You are fully responsible for your own trades.

GBPUSD MOVE DOWN AHEAD|SHORT|
✅GBPUSD is retracing into 2H supply after a clean sell-side sweep. A rejection here would confirm bearish displacement, opening the way for price to seek sell-side liquidity at the marked target zone.Time Frame 2H.
LONG🚀
✅Like and subscribe to never miss a new idea!✅

SHIBUSDT the massive pump is ahead SHIBUSDT is currently testing a critical weekly support level. A strong defense of this zone could potentially catalyze a technical rebound. The subsequent price trajectory would depend on consecutive breakouts above two significant descending trendlines that have contained previous rallies. Each confirmed breakout would represent a key technical milestone, potentially unlocking further upward targets as market structure progressively strengthens.
DISCLAIMER: ((trade based on your own decision))
<<press like👍 if you enjoy💚

GBPAUD FREE SIGNAL|SHORT|
✅GBPAUD ran buy-side into 4H supply and delivered a sharp rejection, confirming bearish displacement. With order flow shifting lower, price is expected to seek sell-side liquidity at the marked target.
—————————
Entry: 2.0307
Stop Loss: 2.0351
Take Profit: 2.0240
Time Frame: 4H
—————————
SHORT🔥
✅Like and subscribe to never miss a new idea!✅

SLPUSDT take a look at this chart soon massive pump SLPUSDT presents a compelling technical setup with significant potential. After an extended bearish period spanning multiple years, the token is now approaching a critical technical juncture. The daily chart shows the asset consolidating near the upper boundary of its long-term trading channel.
A decisive breakout above this channel resistance, particularly when accompanied by substantial volume confirmation, could signal the completion of the accumulation phase and mark the beginning of a new bullish cycle. Based on the depth and duration of the preceding basing pattern, technical projections suggest a potential appreciation target of 300% or more upon successful channel breakout validation.
DISCLAIMER: ((trade based on your own decision))
<<press like👍 if you enjoy💚

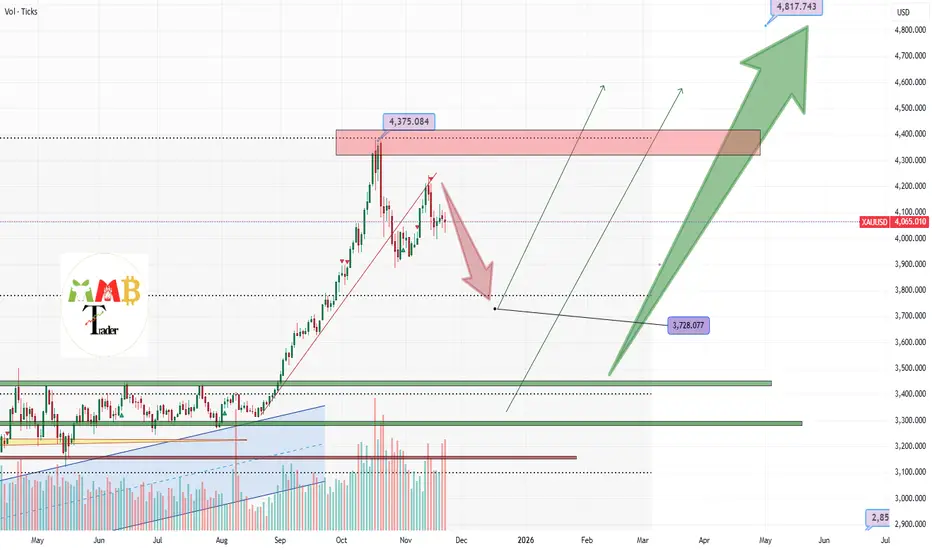
GOLD dump is just started Gold has decisively broken below its key bullish trendline on the daily timeframe and has now completed a retest of this level as new resistance. This technical development suggests a potential shift in momentum, indicating that a corrective phase may be underway. Should this bearish structure hold, we could see a downward move toward initial technical targets around the $3,700 level, which represents the next significant support zone.
DISCLAIMER: ((trade based on your own decision))
<<press like👍 if you enjoy💚
AUD-NZD Bearish Bias! Sell!
Hello,Traders!
AUDNZD reacted to the horizontal supply after sweeping buy-side liquidity, showing bearish displacement. If rejection holds, price is likely to move lower toward the sell-side liquidity at the marked target level.Time Frame 2H.
Sell!
Comment and subscribe to help us grow!
Check out other forecasts below too!
Disclosure: I am part of Trade Nation's Influencer program and receive a monthly fee for using their TradingView charts in my analysis.

GBPCHF SUPPLY AREA AHEAD|SHORT|
✅GBPCHF is approaching the 4H supply where buy-side liquidity sits. A rejection from this zone could trigger bearish displacement, sending price lower toward the sell-side liquidity resting at the marked target level. Time Frame 4H.
LONG🚀
✅Like and subscribe to never miss a new idea!✅

CRUDE OIL Will Fall! Sell!
Hello,Traders!
USOIL is reacting inside the horizontal supply after a liquidity sweep, showing early bearish displacement. If rejection holds, price may continue lower toward the sell-side liquidity at the marked target zone.Time Frame 2H.
Sell!
Comment and subscribe to help us grow!
Check out other forecasts below too!
Disclosure: I am part of Trade Nation's Influencer program and receive a monthly fee for using their TradingView charts in my analysis.

Mirrored Trades, EU HnL + GU SH+PLOverall DXY Bias is Bullish, EU trade 1:1 activated first, then one hour later DXY confirmation (SL+PL) and GU (SH+PL) are both activated at the same time, so I entered second trade on GU, scenario worked fine

SH+PL GUGU taping resistance line for second time during LDN, trade aligns with my short-only strategy. absence of DXY confirmation is alarming, but DXY overall bias is bullish so I hope DXY reacts accordingly

EU SL+PL Hedging an ongoing GU sell trade as DXY started to show reversal signs against WH resistance

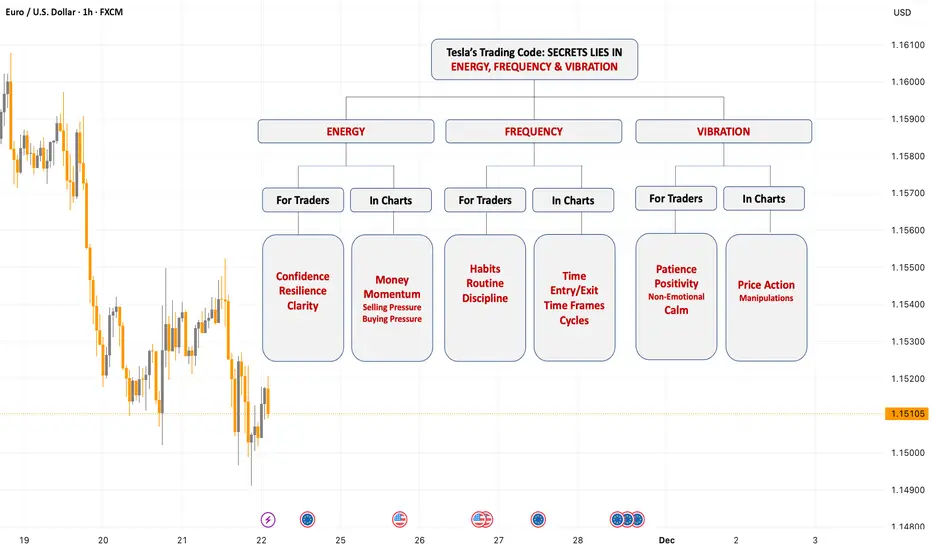
Decoding Trading Charts and Psychology in NIKOLA TESLA'S way! Hey, how are you all! Let's dive deep into a powerful concept inspired by Nikola Tesla’s famous quote: “If you wish to find the secrets of the universe, think in terms of ENERGY, FREQUENCY, and VIBRATION.” This idea, though from the realm of physics, it beautifully translates into the world of trading—both in developing the individual’s right trading mindset and understanding price charts.
Disclaimer:
This post is dedicated solely to educational content and community-driven insights. All information shared here—including strategies, trade setups, and opinions—are for informational purposes only and should not be considered as financial, investment, or trading advice.
Viewers are solely responsible for their own investment decisions.
Trading and investing in financial markets involve risk, and the channel will not be held responsible for any losses or damages incurred as a result of actions taken based on the content presented.
Please consult with a qualified financial advisor before making any investment decisions.
Let’s break down each component and see how you can apply it practically to your trading journey.
At first, let’s talk about the Energy: The Driving Force in Mindset of an individual and Money in Markets.
Energy —Tesla described it as the fundamental driving force behind everything. In trading mindset, energy is your mental and emotional vitality. It’s the passion that fuels your motivation to study markets daily, the focus that keeps you glued to charts during sessions, and the resilience that helps you bounce back from losses without losing confidence.
Imagine two traders: One wakes up excited, ready to analyse and follow their strategy, maintaining positivity even after a tough day. The other wakes up tired and doubtful, easily frustrated by every small loss. The difference? Their energy levels. High, consistent energy levels mean a trader can handle stress better, maintain discipline, and stick to a well-thought plan rather than acting impulsively.
On the market side, think of it as the driving force in the universe of trading. In trading, energy directly corresponds to Money. Money represents the real driving power or driving force behind price movement. It is the buying or selling pressure that injects momentum into the market.
When big chunks of money flow into a stock, like institutional buying, it fuels powerful upward moves. Conversely, large sell-offs drain energy, pushing prices down. Understanding where money is concentrated and how much “Energy” in the form of “Money” is behind the moves lets you anticipate strong trends or reversals.
Secondly, It’s time to discuss about Frequency: The Discipline of an individual and the Time factor in Trading.
Frequency, which for Tesla referred to the rate at which something vibrates or repeats. In trading mindset, frequency is the rhythm of your actions—your habits, your routine, and your discipline. Are you consistently reviewing charts at time intervals? Do you stick to your risk management and trading plan day after day? That regularity creates a frequency that stabilise your results.
Consider a trader who trades instantly, jumping into random setups at different hours without a plan. Their frequency is erratic, and their results are often inconsistent. Contrast that with a trader who enters the market with a fixed routine, analysing and executing trades in well-defined sessions. This disciplined frequency builds confidence and clarity, reducing emotional reactions like fear and greed.
For market charts, the context is in which price move happen in market hours, trading sessions, days, weeks, or months. Frequency is about the rhythm or cycle of these movements. The time of entry and exit of a trade needs understanding of the time factor to achieve better results. For example, price Accumulation and Distribution within an area represent the range of price movements in the near future.
It relates to the timing of price moves. This includes how often prices spend in a particular area without sweeping their highs and lows. The more time spent on it can potentially be how directional the price can behave.
At last, it is Vibration we must look into: It is the Emotional State of an individual and Price Action in charts.
Vibration: On a psychological level, vibration reflects your emotional states—the subtle feelings influencing how you react to market moves. Positive vibrations like calmness, confidence, and patience help you stay grounded, while negative ones like fear, frustration, and impatience can cause poor decisions.
For example, a trader who can stay calm during a price pullback might hold their position with confidence, trusting their analysis. Another who feels anxious might exit too early or overtrade to compensate, resulting in losses.
On the chart side, vibration is best understood as the actual Price Action on the charts—the patterns, candlesticks, and trends that represent how the market feels and behaves at any moment.
Just as vibration represents waves or oscillations in physics, price action is the ever-changing market vibration, reflecting trader sentiment, supply and demand shifts, and market psychology.
For example, a strong bullish trend or bearish trend are vibrations signalling increasing pressure. Sideways or choppy price action indicates indecision and low vibration energy. Learning to read these vibrations means interpreting the real-time mood and momentum of the market.
vibration is the actual price action—the patterns, trends, and candlestick formations that “vibrate” with market sentiment. Sharp price spikes, steady trends, or choppy sideways movement all represent different vibrations of the market. Learning to “read” these vibrations lets you align your trades with what the market is truly expressing.
Bringing It All Together>>>>>>>>>>>
So, how do we use these three—energy, frequency, and vibration—in practical trading mastery?
- First, cultivate your energy by maintaining a positive mindset, managing stress, and staying passionate about learning how, where and when the money is being exchanged.
- Next, build your frequency by developing and sticking to disciplined routines and timing your trades in harmony with market rhythms.
- Lastly, heighten your awareness of vibration by controlling your emotions and learning to interpret price action signals accurately.
Mastering these interconnected elements doesn’t just help you with strategy—it transforms your entire trading psychology, turning you into a more consistent and confident trader.
If this perspective adds value and if you have any inputs to this understanding about trading, Share your experiences or questions in the comments below—I love hearing the application of this thought into charts. Until next time, focus on your energy, maintain your frequency, and tune into the vibrations. Trade smart, and stay disciplined!
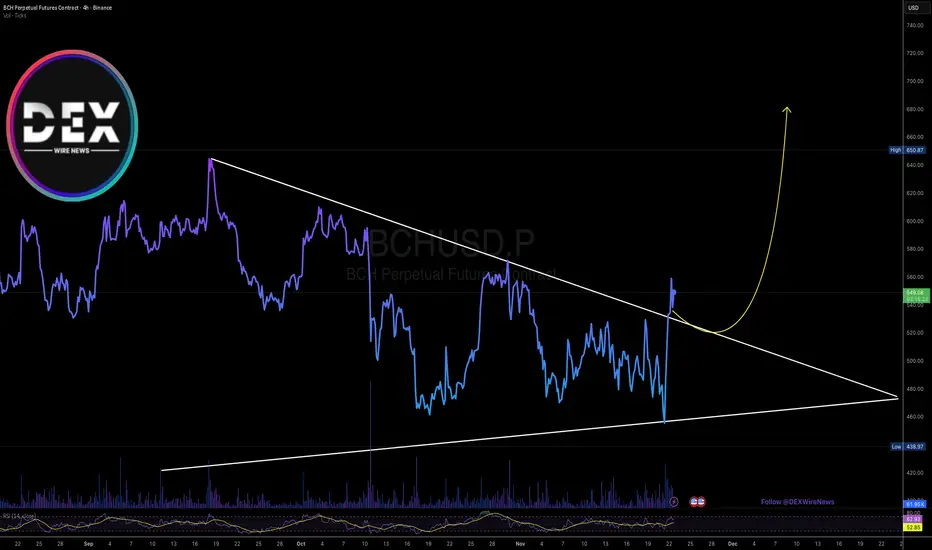
Bitcoin Cash ($BCH) is Up 12% Today, Albeit Market Dip The price of Bitcoin Cash ( CRYPTOCAP:BCH ) saw a notewhorthy uptick of 12% albeit market turmoil. the altcoin is oscillating within a tight symmetrical triangle pattern gearing for a bullish continuoution pattern.
As of the time of writing, CRYPTOCAP:BCH is up 2.58% gearing for a bullish spike. With the RSI at 62, CRYPTOCAP:BCH is more than able to make a mov to the $700 resistance point.
What Is Bitcoin Cash (BCH)?
Bitcoin Cash (BCH) is a peer-to-peer electronic cash system that aims to become sound global money with fast payments, micro fees, privacy and larger block size. As a permissionless, decentralized cryptocurrency, Bitcoin Cash requires no trusted third parties.
Bitcoin Cash Price Data
The Bitcoin Cash price today is $545.45 USD with a 24-hour trading volume of $1,049,904,696 USD. Bitcoin Cash is up 11.57% in the last 24 hours. The current CoinMarketCap ranking is #11, with a market cap of $10,885,408,966 USD. It has a circulating supply of 19,956,897 BCH coins and a max. supply of 21,000,000 BCH coins.
USOIL The Target Is UP! BUY!
My dear friends,
USOIL looks like it will make a good move, and here are the details:
The market is trading on 57.97 pivot level.
Bias - Bullish
Technical Indicators: Supper Trend generates a clear long signal while Pivot Point HL is currently determining the overall Bullish trend of the market.
Goal - 58.98
About Used Indicators:
Pivot points are a great way to identify areas of support and resistance, but they work best when combined with other kinds of technical analysis
Disclosure: I am part of Trade Nation's Influencer program and receive a monthly fee for using their TradingView charts in my analysis.
———————————
WISH YOU ALL LUCK

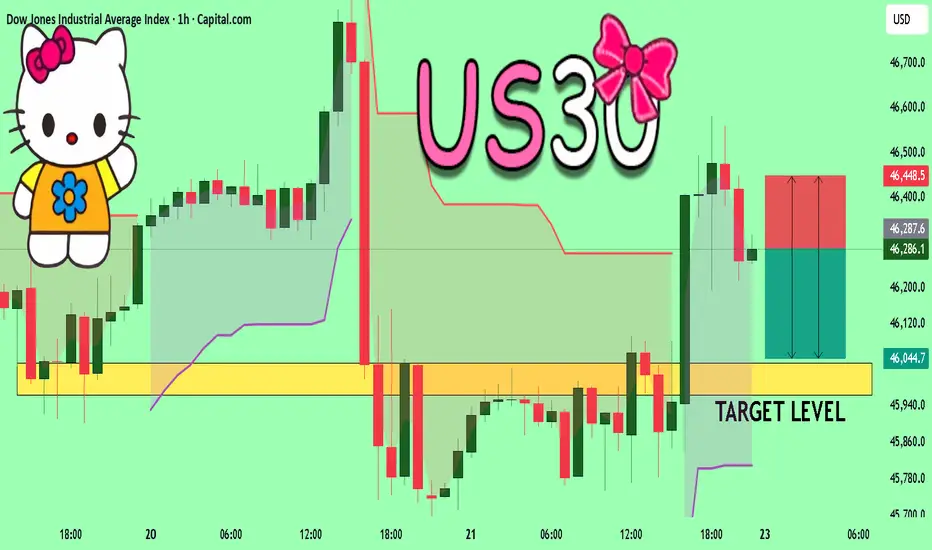
US30 Will Collapse! SELL!
My dear subscribers,
US30 looks like it will make a good move, and here are the details:
The market is trading on 46286 pivot level.
Bias - Bearish
My Stop Loss - 46448
Technical Indicators: Both Super Trend & Pivot HL indicate a highly probable Bearish continuation.
Target - 46034
About Used Indicators:
The average true range (ATR) plays an important role in 'Supertrend' as the indicator uses ATR to calculate its value. The ATR indicator signals the degree of price volatility.
Disclosure: I am part of Trade Nation's Influencer program and receive a monthly fee for using their TradingView charts in my analysis.
———————————
WISH YOU ALL LUCK
Lingrid | GOLD Possible Long Opportunity At Channel FloorOANDA:XAUUSD perfectly played out in my previous idea. Price is pulling back toward the key 4,000 support zone after failing to hold above the mid-range level near 4,130, where sellers re-entered the market. The structure still respects the ascending trendline, forming a sequence of higher lows that keeps the broader bullish outlook intact. If buyers defend the 4,000–4,025 zone again, a rebound toward 4,145 becomes the primary scenario as demand builds at trendline support. The broader momentum continues to favor upside continuation as long as the higher-low structure remains unbroken.
⚠️ Risks:
A decisive break below 4,000 may trigger deeper downside toward 3,892.
Strong USD momentum could suppress bullish attempts and delay any rebound.
Failure to form a clean rejection candle at support may signal ongoing consolidation instead of a renewed rally.
If this idea resonates with you or you have your own opinion, traders, hit the comments. I’m excited to read your thoughts!
