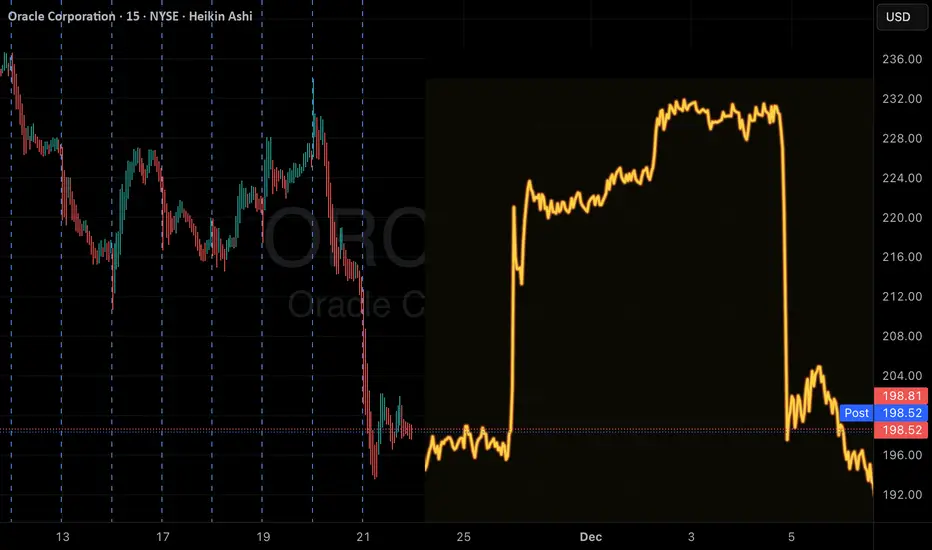
ORCL Momentum Play: Go Long with QuantSignals V3!ORCL — QuantSignals Katy (1M Prediction | 2025-11-21)
Current Price: $198.11
Predicted Close: $200.82 (+1.37%)
30-min Target: $197.64 (-0.23%)
Trend: Bullish
Confidence: 69.1%
Volatility: 113.3%
Trade Signal
• Direction: Long
• Entry: $198.11
• Target: $200.28
• Stop Loss: $195.14
• Expected Move: +1.37%
Contains image
The Bear Market. Officially Here.
Well, congrats to everyone on the start of the bear market. If anyone still hasn’t realized it yet — this is it.
CRYPTOCAP:TOTAL has broadly followed the roadmap from my previous overview , and now we finally have confirmation: five waves up, an ending diagonal, the main volume pool sitting at the highs, and the 50-week moving average broken with a close below. Classic stuff.
From here I’d expect a technical bounce in the near term and then a more prolonged decline into the ~2T area.

One Last Push Before It’s Over?Total Market Cap CRYPTOCAP:TOTAL CRYPTOCAP:TOTALES
From a price action perspective, the structure looks very constructive:
• In May 2021, a swing high was formed, which later became a key resistance level.
• In November 2021, we saw a fakeout, confirming the significance of the level.
• Between March and June 2024, there was a clear rejection from this resistance.
• Eventually, price broke through the level and completed a clean retest from above — textbook move.
The bullish structure remains intact and has been reaffirmed once again. With that in mind, a new ATH on Total Market Cap feels like just a matter of time. The 3.73T+ level is likely to be taken out soon.
From a volume distribution perspective, the market is currently trading near the upper VWAP band — between +1σ and +2σ, yet shows no signs of overheating. Historically, the extreme zone is marked by +3σ, which currently sits around $4.6 trillion.
Wave Structure
The impulsive wave that began in 2022 appears to be nearing its completion. Given the price action and internal structure, it is highly likely that the final fifth wave is forming as an ending diagonal.
The $4.6–5 trillion zone stands out as a potential market top.
Volume behavior is key here:
We’re seeing notable vertical volume spikes in the current phase.
Horizontal volume (volume profile) reveals a strong cluster and point of control (POC) — a clear sign of distribution.
This pattern often signals the final stage of a bull cycle and precedes a reversal. The question is when, not if.
That said, the trend remains bullish for now. Notably, we don't yet observe strong RSI divergences on major timeframes, which supports the case for a continued push higher in the short term.

$LCID Gains as it Opens Gravity Touring Orders in CanadaLucid Group (NASDAQ: NASDAQ:LCID ) is trading at $12.20, up 4.14%, after announcing that Canadian customers can now order the Lucid Gravity Touring, its newest luxury electric SUV. Starting at $113,500 CAD, the Gravity Touring strengthens Lucid’s presence in the premium EV SUV space. Deliveries begin early next year, and buyers can configure the model in English or French through Lucid’s “Design Yours” platform.
Interim CEO Marc Winterhoff noted that the Gravity Touring expands Lucid’s reach into a critical market segment. Built on Lucid’s proprietary EV architecture, the model blends full-size SUV practicality with mid-size dimensions and seating for up to seven people. Its 89 kWh battery delivers an NRCan-estimated 542 km of range, supported by access to Tesla Superchargers, Electrify Canada, and 1000V DC fast-charging at up to 300 kW.
Lucid’s proprietary rear-motor boost enables 220 kW charging speeds on Tesla’s network—another competitive advantage as charging infrastructure becomes a key factor in EV adoption. Performance remains a highlight: dual-motor AWD with 560 hp, 0-100 km/h in 4.2 seconds, standard air suspension, and an optional Dynamic Handling Package.
The cabin supports flexible five- and seven-seat configurations, up to 3,400 L of cargo capacity, and multiple styling choices, including a Stealth or Platinum exterior appearance. These features position the Gravity Touring as a direct challenger to Tesla, Rivian, and premium European EV SUVs.
Technical Outlook (NASDAQ: NASDAQ:LCID )
LCID remains in a bearish structure after falling from its $35 February high. Price has broken the critical $20 support and is now approaching the $10 zone, which acts as the next demand area. A bullish reversal requires reclaiming $15, while deeper weakness opens the path toward $8.

TRON (CRYPTO: $TRX) Shift After Ending USDJ Strengthens Its CoreTRON (CRYPTO: CRYPTOCAP:TRX ) has entered a new phase after officially retiring USDJ, its algorithmic stablecoin that has existed for over five years. Holders can now redeem at a fixed rate of 1 USDJ = 1.5532 TRX, closing the chapter cleanly and without market disruption. The shutdown signals TRON’s transition toward fully collateral-backed stablecoins like USDD and the massive USDT supply already dominating the chain. Globally, regulatory pressure continues moving the industry away from algorithmic models, making TRON’s timing strategic and aligned with long-term stability.
The shift also clears legacy risks and simplifies the ecosystem, helping new users and institutions navigate TRON more easily. Analysts view this move as a maturity milestone that prepares TRON for its next wave of products and infrastructure upgrades.
TRON’s dominance in the stablecoin sector remains unmatched. The network now hosts over 60% of the entire USDT supply, exceeding $78.5 billion, and continues to lead global settlement volume. In October, TRON processed $775.2 billion in monthly transactions, supported 76.4 million transfers, and maintained near-zero fees with sub-second finality. These metrics highlight why TRC-20 USDT is the preferred digital dollar across emerging markets, remittance corridors, and high-frequency commercial systems.
This dominance directly reinforces TRX utility. Higher settlement flows create more demand for bandwidth and energy, increasing long-term token usage. TRON’s infrastructure remains reliable, with protocols like JustLend, SunSwap, WINkLink, and JustStables anchoring billions in TVL. Tether’s consistent preference for TRON further accelerates liquidity growth.
Technicals
TRX rebounded strongly from the $0.28 demand cluster, forming a narrowing wedge with higher lows. Holding above $0.280–$0.285 keeps bullish momentum intact. Breaking $0.31 opens the path to $0.34, with a stretch target at $0.37. Losing support risks another retest of lower levels.

Solana (CRYPTO: $SOL) ETFs Surge as Price Tests Major SupportSolana (CRYPTO: CRYPTOCAP:SOL ) trades at $127.45 after a sharp 31% decline over the past month, but institutional activity is telling a different story. While retail sentiment weakens, capital continues flowing into newly launched Solana ETFs—creating one of the clearest divergences in the crypto market heading into late 2025.
Six U.S. spot Solana ETFs are now live, with issuers including 21Shares, Fidelity, VanEck, Canary Capital, Bitwise, and Grayscale. Fidelity’s FSOL on NYSE Arca quickly captured attention thanks to its staking component, making it the largest traditional asset manager offering staked SOL exposure. 21Shares also added competitive pressure by launching its ETF with a 0.21% fee after securing Cboe approval.
Combined ETF holdings now exceed $2 billion, and the inflows haven’t slowed—Solana ETFs recorded $26.2 million in net inflows on November 18, marking the 15th consecutive positive day. Remarkably, these inflows outpaced those of Bitcoin and Ethereum for the week. When institutions accumulate during market selloffs, it often reflects long-term conviction in underlying fundamentals such as Solana’s high throughput, low transaction costs, and increasingly mature ecosystem.
Technicals
Despite the correction, SOL is testing a major ascending-trendline support that has been respected several times. Price recently dipped into liquidity near $127, a level that has previously marked swing turns.
If support holds, the bullish continuation scenario comes into focus. The first target stands at $253, followed by $295. A breakout above both levels would strongly support new all-time highs heading into 2026.
If support fails decisively, the next demand zone lies between $110 and $100. A breakdown of that zone increases the probability of a deeper move toward $80. For now, buyers continue defending trend support, keeping the broader structure intact.

Stables coins idea Part 2Posted my stables chart with 3 harmonics on there, all 3 hit on the nose eventually, the last one today, now it looks like Stables wants more upside, so here is what I have in mind.
As always NFA, please do your own TA....

GOLD Bullish Breakout! Buy!
Hello,Traders!
GOLD broke out of the bullish flag, confirming bullish momentum after absorbing sell-side liquidity. With structure shifting upward, price may extend toward the buy-side liquidity resting at the marked target level.Time Frame 5H.
Sell!
Comment and subscribe to help us grow!
Check out other forecasts below too!
Disclosure: I am part of Trade Nation's Influencer program and receive a monthly fee for using their TradingView charts in my analysis.

Stable coins ideaAs you can see from the chart, we already hit the yellow harmonic, I had my eye on the blue and decided to look it over again, now also have the white one of the chart. My personal opinion is that we hit the blue and then drop, I had both the yellow and blue on there for quite some time, so the white one could be tapped sometime in the future.....
NFA, just for your attention

AUDNZD FREE SIGNAL|SHORT|
✅AUDNZD rejected the 2H supply after taking buy-side liquidity, showing bearish displacement. With order flow shifting lower, price is likely to target the sell-side liquidity resting at the marked demand zone.
———————————
Entry: 1.1510
Stop Loss: 1.1524
Take Profit: 1.1490
Time Frame: 2H
———————————
SHORT🔥
✅Like and subscribe to never miss a new idea!✅

GBP-CHF Free Signal! Sell!
Hello,Traders!
GBP-CHF is reacting inside the horizontal supply after collecting buy-side liquidity. Bearish displacement suggests sellers may take control, targeting the sell-side liquidity resting at the TP zone.Time Frame 3H.
--------------------
Stop Loss: 1.0626
Take Profit: 1.0555
Entry: 1.0598
Time Frame: 4H
--------------------
Sell!
Comment and subscribe to help us grow!
Check out other forecasts below too!
Disclosure: I am part of Trade Nation's Influencer program and receive a monthly fee for using their TradingView charts in my analysis.

EURJPY WILL GROW|LONG|
✅EURJPY tapped the 2H demand, sweeping sell-side liquidity and showing early bullish displacement. If demand holds, price may retrace upward toward the buy-side liquidity resting at the marked target zone. Time Frame 2H.
LONG🚀
✅Like and subscribe to never miss a new idea!✅

SOLI do not think we will go lower then this, the support is huge and the setup is too clean. This is one of the best accumulation zones you will ever get.

EUR-USD Local Long! Buy!
Hello,Traders!
EURUSD tapped the horizontal demand, sweeping sell-side liquidity and showing early bullish displacement. If demand holds, price may retrace upward toward the buy-side liquidity resting at the marked target level. Time Frame 3H.
Sell!
Comment and subscribe to help us grow!
Check out other forecasts below too!
Disclosure: I am part of Trade Nation's Influencer program and receive a monthly fee for using their TradingView charts in my analysis.

THE KOG REPORT - UpdateEnd of day update from us here at KOG:
After a very clean week so far, today wasn't really worth getting involved in. A lot of choppy price action and accumulation, no clear direction even though our hot spots were all hit.
We have a lower high which is concerning but there is a strong level of support here at the 4050-55 level. Tomorrow's key level of resistance stands at 4075 which needs to break, as well as the red box defence in which the price has played for most of this week. It looks like the breakout will come in the sessions ahead. For that reason, we'll wait for the break either side otherwise we'll just call it a successful week here.
Levels to watch, 4040 support on the undercut low, while 4070-75 for the spikes needs force to break open.
As always, trade safe.
KOG

Iluniam: Stablecoins 2.0 — 8–15 % APY with Zero Volatility RiskWhile the broader crypto market is going through one of its sharpest corrections of the entire cycle — Bitcoin down 17 %, Ethereum down 22 %, and most major altcoins bleeding 30–45 % in just two weeks — there exists an asset class that not only refuses to drop, but is currently paying the highest real, predictable yield we have seen in the past 26 months.
We are talking about the new generation of stablecoins and proven classics (USDT, USDC, DAI, USAT, USDY, USDe, USDM) that in November 2025 are delivering 8–15 % annualised returns completely insulated from price volatility.
This is not marketing hype.
This is cold, hard, on-chain verifiable income that is being paid out daily and weekly to millions of wallets right now — while the rest of the market is red.
The reason is simple:
The November correction has driven massive capital flight into safety → lending protocol volumes surged +38 % in the last 14 days alone.
U.S. Treasury yields remain elevated (3-month T-bills ≈ 4.9–5.1 %), and every protocol backed by treasuries or repo agreements is mechanically passing that yield straight to users.
Centralised exchanges and DeFi platforms are in a fierce liquidity war — they are temporarily boosting rates to historic highs to attract stablecoin deposits before year-end.
In short: right now stablecoins are the highest-yielding truly risk-free asset class in the entire crypto and traditional finance space.
Top 7 Stablecoin Yield Opportunities Right Now (Iluniam data, 18 November 2025)
USAT (Ampleforth Treasury) — 14.7–15.3 % APY
Backing: 100 % short-term treasuries + repo
Platforms: Pendle (USAT pool), Morpho Blue
Risk level: minimal (1:1 overcollateralized)
USDY (Ondo Finance) — 13.1–14.4 % APY
Backing: treasuries + BlackRock BUIDL integration
Platforms: Ondo direct, Pendle, Sky (ex-Maker)
Bonus: Coinbase listing confirmed for December
USDe (Ethena) + sUSDe staking — 11.8–13.2 % APY
Strategy: delta-neutral (spot + perpetual short)
Platforms: Ethena, Symbiotic
Risk: medium, but covered by a $400 m insurance fund
USDC on Coinbase Advanced — 11.2 % APY
Simple deposit, no lock-up, instant withdrawal
FDIC insurance up to $250 k on fiat portion
USDT on Bybit Earn — 10.5–11.8 % (flexible + 30-day locked)
Up to 15 % bonus for new deposits until 30 November
USDM (Mountain Protocol) — 10.1–10.9 % APY
Backing: 100 % treasuries, fully regulated (Bermuda)
Platforms: Mountain + Curve
DAI in Sky (ex-Maker) + Spark — 8.4–9.8 % APY
The most decentralised option, DSR + Spark lending
Risk vs Reward Comparison (Iluniam Risk Score 1–10)
StablecoinAPYRisk (1–10)LiquidityBacking / InsuranceUSAT14.7–15.3 %2High100 % treasuries + repoUSDY13.1–14.4 %2HighBlackRock BUIDL + treasuriesUSDe11.8–13.2 %5High$400 m insurance fundUSDC (Coinbase)11.2 %1InstantFDIC + Circle reservesUSDT (Bybit)10.5–11.8 %4HighTether reserves
Iluniam Recommendation for November–December 2025
Conservative capital (70–100 %):
USAT + USDY + USDC → average 12.8–14.1 % APY at near-zero risk
Aggressive slice (20–40 %):
USDe + Pendle PT-USAT (fixed 16–18 % until March 2026)
Why this beats simply holding BTC/ETH right now
Yield is guaranteed and compounds daily/weekly
Zero exposure to downside volatility (you earn while the market bleeds)
Full liquidity — exit anytime and buy assets 10–20 % cheaper when the dip ends
Final Word from Iluniam
November 2025 is not a time to panic over red charts.
It is the best moment in the past two years to park part of your capital in Stablecoins 2.0 and collect 8–15 % real yield while waiting for the next leg up.
We have already allocated 68 % of our clients’ free cash into these exact protocols — and they are earning every single day.
Want the same result without wasting time searching?
The complete “Stablecoins 2.0 — Where and How to Earn 15 % in November” guide is already available in the private Iluniam channel.

NZDUSD LongBroader Market Structure
The pair has been in a downtrend, making a sequence of lower highs and lower lows. The most recent significant structural event is the CHoCH at 0.56327, where price broke the previous swing high. This aggressive break signals the first potential shift from bearish to bullish structure, suggesting that the downtrend may be losing momentum and that buyers are beginning to challenge seller control. Before that CHoCH, a BOS to the downside at 0.55777 confirmed bearish continuation, but price immediately failed to follow through, which strengthens the significance of the CHoCH.
Supply & Demand Zones
The upper supply zone near 0.5630–0.5640 is a strong zone because price previously dropped sharply from it, showing that sellers were active with force. However, the demand zone around 0.5590–0.5600 shows strong reaction as well—buyers stepped in decisively and created a clean impulsive leg upward, which gave us the CHoCH. This makes the demand zone more reliable on the retest, as it caused a structural shift rather than just a bounce.
Price Action in the Marked Region
Price is currently pulling back toward the new bullish demand zone at 0.5590–0.5600, and the reaction so far shows buyers defending higher lows. Price rejected below 0.5600 with strong wicks, indicating absorption of selling pressure. If the pullback continues slightly deeper into the green zone, we expect buyers to step in again and push price back toward the supply zone above.
The marked projection on your chart aligns well with current behavior: a dip into demand followed by a continuation into the 0.5630–0.5640 supply zone.
Trade Bias, Expected Direction & Invalidation
Your current trade bias should be bullish due to the CHoCH and momentum shifting upward.
Expected Direction: Pullback into demand → bullish continuation toward 0.5630–0.5640
Invalidation Level: A clean break and close below 0.5577 invalidates the bullish scenario, as it would erase the CHoCH and return price to bearish continuation.
Momentum & Candle Behavior
Momentum is currently favoring buyers, with stronger impulses upward and weaker corrective moves downward. The wicks rejecting below 0.5600 show buying absorption, and the bullish impulse that created the CHoCH confirms buyer strength.
No major engulfing patterns are present right now, but the structure and wick behavior strongly support continued upside.

GreenBayChart 7 Crypto Assets That Will Deliver by the End 2025We just completed the deepest on-chain analysis of November 2025.
Over the last 14 days we processed 4.7 million wallets, 38 billion transactions, and 184 metrics from Glassnode, Nansen, Santiment, and our own full nodes.
The result: 7 assets that are currently seeing the most aggressive whale accumulation, minimal seller pressure, and confirmed catalysts for 2026.
Top 7 by GreenBayChart (ranked by expected return to 31 Dec 2026)
Sui (SUI) — expected ×8–×12
Current price: $2.84
2026 targets: $24–34
On-chain picture:
Whales (>100 k $) +41 % accumulation in 60 days (Nansen)
Active addresses +390 % YTD
TVL +410 % in 2025 → 3rd place among L1s
Catalysts: Mysticeti consensus (Q1 2026), SuiPlay handheld (Q2), Google Cloud partnership already confirmed.
Sei (SEI) — ×7–×10
Current price: $0.68
2026 targets: $5.20–7.80
#1 GitHub dev growth in 2025 (+680 %)
10 k–100 k SEI wallets +68 % accumulation in Oct–Nov
Parallel EVM v2 already in testnet → 30 000 real TPS in Q1 2026
Hyperliquid (HYPE) — ×6–×9
Current price: $28.40
2026 targets: $180–260
#1 perpetual DEX by volume in November (surpassed GMX and dYdX)
Own Cosmos SDK L1 already live
Whales +54 % token accumulation in 45 days (Santiment)
TVL $2.4 bn and growing +19 % weekly
Ondo Finance (ONDO) — ×5–×8
Current price: $1.42
2026 targets: $7.80–11.50
2025 RWA leader: tokenized treasuries + BlackRock BUIDL integration
$680 m inflows into Ondo products in Oct–Nov
Coinbase & Kraken listings in December 2025
Render (RNDR) — ×4–×7
Current price: $9.10
2026 targets: $42–68
Explosive GPU demand after Grok-2 and Apple Intelligence launches
Burn mechanism already burned 4.8 % of supply in 90 days
Whales +38 % accumulation in last 60 days
Chainlink (LINK) — ×4–×6
Current price: $18.80
2026 targets: $78–110
CCIP live on 12 chains, Swift & DTCC in production
Institutional wallets (>1 m LINK) +31 % this quarter
Lowest seller pressure among top-20 infrastructure tokens
Solana (SOL) — ×3–×5 (the “safest” ×3+ in the list)
Current price: $182
2026 targets: $620–920
Firedancer mainnet December 2025 → 65 000+ TPS
TVL +310 % YTD, ecosystem inflows +$2.1 bn in 60 days
Whales >100 k SOL net bought +420 k SOL in November
Exact Entry Levels Right Now (GreenBayChart, 18 Nov 2025)
AssetAccumulation ZoneStop-LossFirst Target (2025)Final Target (2026)SUI$2.70–2.92$2.48$5.80$24–34SEI$0.64–0.71$0.59$1.80$5.20–7.80HYPE$26–29$24$58$180–260ONDO$1.35–1.48$1.28$2.80$7.80–11.50RNDR$8.80–9.40$8.20$16$42–68LINK$18.20–19.50$17.20$34$78–110SOL$178–188$168$280$620–920
Why exactly these 7 (and not hundreds of others)
Whale accumulation >30 % in 60 days (all 7 in the top 15 by this metric)
Minimal seller pressure (MVRV Z-Score <1.8 across the board)
TVL & active addresses growing at least +180 % YTD
Confirmed 2026 catalysts (upgrades, listings, partnerships)
No major unlocks until end of 2026 (except SOL – already priced in)
Final Word from GreenBayChart
The November correction is the last major accumulation point before the final phase of the 2025–2026 cycle.
Anyone who calmly builds positions in these 7 assets at current prices will capture the highest returns of the entire cycle.
The full report with charts, live on-chain dashboards, and exact entry levels is already available in the GreenBayChart Pro private channel.

USDJPY LongMarket Structure
On the 15-minute timeframe, USDJPY is in a clear short-term downtrend. The strong impulsive break below the prior swing low around 156.95 created a decisive CHoCH, shifting structure from bullish to bearish. After that, price continued making lower highs and lower lows, confirming a bearish continuation. The most recent BOS occurred when price broke below the 156.40 low, showing sellers still in control and suggesting continuation toward lower demand.
Supply & Demand Zones
The most relevant supply zone sits around 156.80–157.00, where price previously reacted aggressively—price dropped sharply from this area, showing strong selling pressure and weak presence of buyers. The nearest demand is the shaded green region around 155.90–156.10, where buyers stepped in with strength earlier, causing a clean upward reaction, making this a structurally strong area for potential accumulation.
Price Action in the Marked Region
Price is currently hovering just above local demand and showing hesitation, but momentum is still leaning bearish in the immediate short term. The reaction from demand hasn’t fully developed yet, so a sweep lower into the 156.00–155.90 zone before a move upward is the most likely scenario. The arrow you drew aligns with a liquidity grab under the lows, followed by a short-term retracement back into supply at 156.80.
Expected Scenario
Bias: Short-term bullish retracement inside a broader bearish structure.
Expected move: Dip into demand → bounce → retrace upward toward 156.70–156.85 supply.
Key invalidation level: A clean break and 15m close below 155.85 would invalidate the bullish retracement idea and signal further downside into the deeper green demand zone.
Momentum & Candle Behavior
Sellers still have slightly stronger momentum, but the long wicks on the downside show absorption and early signs of buyers defending the area. A bullish engulfing or strong displacement candle from the demand zone would confirm the start of the expected retracement.

GOLD DAILY CHART ROUTE MAPHey everyone,
Here’s the Daily Chart idea we’ve been tracking. The swing move into 4145 has now produced a candle body close above that level, which keeps the long term gap open toward 4325. We also saw a rejection with a candle body close below 4145, leaving 3165 open beneath. However, note that this rejection touched the channel half line, which based on our uniquely drawn goldturn channel typically provides strong support.
We’re seeing that support play out now with a bounce off the half-line.
At the moment, our key levels are:
Primary support: Channel half-line
Secondary support: 3961
Primary resistance: 4145
Long range gap target: 4325, which becomes more significant if we see the EMA5 cross and hold above 4145.
We’ll keep everyone updated as the week progresses.
Mr Gold
GoldViewFX

Gelaxy IG 2025: Crypto Visa Card + One-Click TokenizationNovember 2025 has proven that cryptocurrency is no longer just “digital gold” for HODLers.
While Bitcoin was dropping below $96,000, stablecoins USDT and USDC grew 11 % in issuance volume in just 30 days, and tokenized real-world assets (RWA) attracted a record $640 million in October–November alone.
This is not a coincidence. It’s a signal: crypto is finally becoming real working capital.
Gelaxy IG is launching the solution that makes your crypto truly alive:
Spend BTC, ETH, USDT and 1,300+ other coins anywhere in the world with a regular Visa/Mastercard
Tokenize any investment position (Forex, stocks, bonds, ETFs) into an ERC-20 token and get instant liquidity without closing the underlying trade
What is Gelaxy IG and why we launched right now
Gelaxy IG is a next-generation fintech platform that connects three worlds:
Crypto wallet with direct Visa/Mastercard integration (130+ countries, 40+ million acceptance points)
Tokenization of any investment position into ERC-20
Instant liquidity without selling the base asset
Key figures as of 18 November 2025:
1,300+ supported assets for payments
User-tokenized position volume already at $180 million
Average time from “I need cash” to “money on card” — 42 seconds
Partnerships with 8 major card issuers and 4 blockchains (Ethereum, Polygon, Solana, Arbitrum)
How it works — two real November 2025 scenarios
Scenario 1. Paying for coffee in Paris with BTC — without selling
You have 0.42 BTC in your Gel − wallet.
Go to a café → tap your Gelaxy Visa card → pay €18.
The system automatically issues a collateralized loan against your BTC at 65 % LTV → money is debited → your BTC stays with you and keeps growing.
Scenario 2. Tokenization and instant liquidity on a Forex position
You have a $250,000 EUR/USD long with ×10 leverage, currently +$18,400 in profit.
Instead of closing, you hit “Tokenize” → the position becomes token gEURUSD-2511 → you sell 40 % of the tokens on the built-in DEX → receive $7,360 in USDT in 18 seconds, without closing the trade or triggering a tax event.
Why this became possible only in 2025
Regulators gave the green light (OCC USA, MiCA EU, Singapore, UAE) — stablecoins and tokenized assets are now treated as regular money
Institutions are already here: BlackRock BUIDL $640 m, Ondo $1.1 bn TVL
Retail is simply following
Gelaxy IG advantages
Spend crypto everywhere Visa/Mastercard is accepted — no sale, no tax event
Tokenize any position and get cash in seconds
Earn up to +15 % extra: staking rewards + 1–3 % cashback on every card purchase
Full compatibility with MetaMask, Ledger, Trust Wallet
0 % conversion fee inside the platform until 31 December 2025
Roadmap 2026
Q1 — tokenization of real stocks (Apple, Tesla, Nvidia)
Q2 — Apple Pay & Google Pay integration
Q3 — own gUSD stablecoin with 6–9 % APY
Get started now
Conclusion — why Gelaxy IG changes the game
2025 has finally erased the line between “crypto” and “real money”.
Gelaxy IG is not just another card and not just another wallet.
It’s a tool that turns your investment capital into real, spendable money — right here, right now — without selling, without waiting, without compromise.
While others wait for the “next bull run”, Gelaxy IG users are already living it:
paying with crypto for dinner
pulling profit from a Forex trade without closing it
earning cashback and staking rewards every single day
Gelaxy IG democratizes investing: anyone with $500 in crypto now has access to advantages that just a year ago were reserved for hedge funds and family offices.
Your crypto no longer has to sit idle.
It has to work — 24 hours a day, 7 days a week.
Gelaxy IG — your capital works while you live.
Roxtengraphs 2025: Crypto, Forex & Stocks — All on One PlatformNovember 2025 has been a real stress test for millions of traders and investors.
In just two weeks Bitcoin dropped from $109,200 to $96,400, Ethereum lost 22 %, Solana 31 %, and tech stocks (Nvidia, Tesla, Apple) fell 14–28 %. At the same time gold broke above $3,250, the DXY rolled back below 105.80, and EUR/USD is testing 1.1600 — a classic “risk-off” picture where some assets crash while others offer a chance to profit on the opposite move.
Most people right now have 5–7 different apps open:
Binance for crypto, MetaTrader for currencies, Interactive Brokers or TradingView for stocks, a separate terminal for options, and another wallet for staking.
The result: wasted time, extra swap fees, conversion spreads, and constant stress from switching between screens.
At Roxtengraphs we solved this problem once and for all.
We built a true multi-asset platform where everything — from BTC and SOL to EUR/USD, Nasdaq-100 CFDs, and Tesla stock — is traded from a single balance, in a single window, with a single AI engine that automatically adjusts risk to the current market phase.
Why a multi-asset approach is critical right now
The crypto correction has created the best entry points in six months
BTC $96,400, ETH $3,610, SOL $182 — exactly the May–June 2025 levels that launched ×2–×5 moves.
Forex provides stability and negative correlation
While crypto is red, pairs like EUR/USD, GBP/JPY, AUD/USD, and USD/JPY deliver 150–400 pips of weekly volatility — perfect for hedging and extra income.
Tech stocks are on sale again
Nvidia −26 %, Tesla −19 %, Super Micro −34 % from October highs — historically, drawdowns like these were followed by 40–120 % gains over the next 6–9 months.
One balance = zero conversion losses
Hold USDT → trade BTC → instantly switch to EUR/USD → buy Apple stock — no swaps, no exchange spreads, no taxable events on every conversion.
What’s already live on Roxtengraphs (as of 18 November 2025)
520+ instruments: spot crypto, perps, Forex (38 pairs), US/EU stocks, indices, commodities
Unified balance in USDT/USDC or fiat
Average execution 11 ms (own matching engine + 14 liquidity providers)
RGX token presale has already raised $42 million (target $60 million by year-end)
Forecast: 28 million active users and $2.1 billion TVL by 2030
Real trading examples from November
14 November — one day:
08:15 — AI short signal on BTC perp ×5 → entry $98,200 → exit $93,800 → +224 % on the position
11:45 — part of profit into long EUR/USD 1.1580 → 1.1640 → +62 pips
15:30 — remainder into Nvidia on the dip $132 → $148 by close → another +12 %
Total for the day: +41 % on starting capital without changing platforms.
Passive income: hold USDT → earn 8–14 % APY automatically in RGX staking rewards.
Roxtengraphs advantages right now
One login — the entire world of markets
AI Risk Engine reduces max drawdown by 38–44 % (2023–2025 backtests)
0 % commission on spot crypto and stocks until 31 December 2025 (promo for the first 50,000 users)
Instant withdrawal to USDT, EUR, or USD to card (14 fiat corridors)
First 7 days — 0 % fees + $50 RGX
November 2025 is not a crisis.
It’s the moment when smart traders stop jumping between apps and start trading the whole world from one screen.
Roxtengraphs — one balance, one platform, one profit.
Time to begin — right now.

Platinum’s Nuclear Breakout Is Loading | The Chart Doesn’t LiePlatinum (XPTUSD) — Long-Term Structural Analysis Integrating Elliott Framework, Institutional Order Flow, and Macro Cycles
Platinum’s multi-decade price behavior continues to display a well-ordered impulsive structure consistent with classical Elliott Wave theory, supported by recurring institutional accumulation patterns and strict adherence to Fibonacci geometry. The asset has progressed through a full secular cycle, characterized by deep corrective retracements into high-probability value zones and expansions that consistently terminate at key Fibonacci extension thresholds—behavior typical of markets driven by institutional liquidity flows rather than retail speculation.
Elliott Structure & Fibonacci Alignment
The historical impulse demonstrates strong proportionality across waves.
The initial secular Wave 1 advanced precisely into the 1.618 extension , confirming a minimum impulse threshold.
Wave 2 retraced cleanly to the 0.618 retracement , an area frequently associated with long-horizon institutional repositioning.
The subsequent Wave 3 extended toward the 2.618 level , consistent with the most statistically probable long-cycle expansion target.
Wave 4 repeated the symmetrical 0.618 retracement , reflecting renewed accumulation in a structurally discounted region .
The current multi-year breakout sequence is consistent with an emerging Wave 5 , with a macro-projection aligning toward the 3.618 extension , a historically validated termination zone for commodities in late-cycle impulsive phases.
Macro Market Structure
Platinum has spent an extended period in re-accumulation following a prolonged distribution phase that began after the prior secular peak. Internal structure has now transitioned from compression to early expansion, evidenced by successive breaks of multi-year structural highs and sustained acceptance above formerly capped liquidity zones. This structural shift suggests the market is transitioning from long-term value consolidation into a new secular markup phase.
Institutional Order Flow & Smart Money Dynamics (ICT/SMC Framework)
Price behavior across multiple cycles reveals consistent liquidity targeting:
Corrective waves repeatedly returned to deep discount regions within the 0.618–0.786 “golden pocket,” an area historically associated with institutional accumulation and mitigation of long-horizon order blocks.
Liquidity sweeps above major multi-year highs followed by sustained displacement signal a structural shift in institutional intent.
Current price action demonstrates displacement from an extended accumulation base, confirming that the dominant flow is now upward, with liquidity pools above the historical consolidation range serving as primary targets.
Price Action Context
The market has decisively exited its multi-year equilibrium, printing higher-high/higher-low structures consistent with early-stage impulsive behavior. Breaks of internal liquidity layers reinforce the expectation of continued expansion toward higher-order liquidity pools, aligning with the projected Wave 5 trajectory.
Fundamental Alignment
Underlying fundamentals - including tight supply dynamics, structural deficits within the PGM basket, and tailwinds tied to hydrogen economy applications - reinforce the technical outlook. The confluence of cyclical tightening, inventory compression, and strategic industrial demand supports a durable long-term appreciation phase.
What do YOU think happens next?
Breakout or fake-out? Drop your prediction below!
👇 We are replying to every comment - let’s talk charts .
Smash the 👍 if this helped, hit 🔔 to catch the next setup,
and FOLLOW for more high-probability wave + SMC plays.
⚠️ Disclaimer
This content is for educational and informational purposes only and does not constitute financial, investment, or trading advice. All analyses reflect personal opinions based on publicly available data and chart structures. Markets involve risk, and you should always perform your own research or consult a licensed financial professional before making any trading decisions. Past performance does not guarantee future results.
#Platinum #XPTUSD #CommodityTrading #Breakout #Wave5 #ElliottWave #SmartMoney #SMC #ICT #PriceAction #ParabolicMove #BullishSetup #MarketCycle #Fibonacci #Metals #Macro #TechnicalAnalysis #ChartAnalysis #TradingSignals #TraderCommunity #Investing
