NZDUSD → The hunt for liquidity. Bearish trend...FX:NZDUSD is forming a correction towards consolidation after updating its global minimum. Bears may play aggressively against the backdrop of a strong dollar.
The dollar is quite strong after Thursday's news. After retesting resistance, the index is not falling, but is gathering strength and may continue to grow.
The global trend is downward. After a long consolidation, the currency pair is breaking support and updating its low. The market sentiment is bearish. Against this backdrop, NZDUSD may continue to decline after retesting resistance at 0.560 and a false breakout...
Resistance levels: 0.5606, 0.5635
Support levels: 0.555, 0.55
A false breakout, lack of bullish momentum, and price consolidation below 0.56 could trigger a further decline in price within the current trend.
Best regards, R. Linda!
Contains image

$JPIRYY -Japan CPI (October/2025)ECONOMICS:JPIRYY 3%
October/2025 (+0.1%)
source: Ministry of Internal Affairs & Communications
-Japan’s annual inflation rate edged up to 3.0% in October 2025 from 2.9% in September,
marking the highest reading since July.
Electricity cost rose the most in four months following the expiry of government subsidies (3.5% vs 3.2% in September),
even as gas prices slowed (0.7% vs 1.6%).
Price growth also persisted for housing (0.9% vs 1.0%), clothing (2.5% vs 2.5%), transport (3.6% vs 3.0%), household items (1.8% vs 1.0%), healthcare (0.8% vs 1.2%), recreation (2.6% vs 2.0%), communications (7.5% vs 6.7%), and miscellaneous goods (0.7% vs 0.7%), while education costs fell further (-5.6% vs -5.6%).
On the food side, prices rose 6.4% yoy, marking the softest gain since December 2024, largely due to the smallest rise in rice prices in 14 months (40.2%) amid Tokyo’s continued efforts to curb staple food costs.
Core inflation also came in at 3.0%, matching forecasts and pointing to the highest in three months.
Monthly, the CPI rose 0.4%, recording the highest level since January.

to 65K soon BTC/USD – Historical Cycle Analysis & Mid-Term Outlook (1W)
Exchange: Coinbase
Timeframe: Weekly (1W)
Key Observations:
Long-Term Trendline Resistance
The black ascending trendline has historically acted as a major resistance zone since 2017.
Every touch of this line in the past has been followed by a significant correction.
Bearish Divergences (DIV / HDIV)
Red arrows indicate historical bearish divergences on RSI/MACD.
Each divergence marked a local or macro top before a sharp retracement.
Major Historical Resistance – $64,899
Derived from 0.5 Fibonacci retracement of the primary cycle.
Served as a key ceiling during previous cycles before new all-time highs.
Bitcoin Cycle Behavior
BTC historically forms parabolic tops followed by deep corrections.
The current cycle (2024–2025) mirrors 2017 and 2021 structures, suggesting we may be approaching a macro inflection point.
Mid-Term Scenario
Price near the trendline (~$120K) implies high risk of volatility and correction.
Primary support zone: ~$65K (historical + Fibonacci confluence).
Likely scenario: range-bound movement between $65K–$120K before any sustainable breakout or new parabolic leg.

Lingrid | AUDUSD Relief Rally Then Downtrend ContinuationFX:AUDUSD perfectly played out my previous trading idea . Price is pulling back toward the mid-range zone after rejecting the descending trendline, confirming that sellers still control the broader structure. The market continues to form lower highs and lower lows inside the downward channel, with the recent compression breakdown reinforcing bearish momentum. If price retests 0.64750 and fails to break above it, continuation toward the 0.64150 support becomes the most likely scenario as the trend resumes. Broader context shows a consistent bearish flow, with corrective rallies repeatedly turning into continuation moves.
⚠️ Risks:
A clean breakout above 0.64750 may invalidate the bearish setup and trigger a deeper correction.
USD weakness or unexpected macro data could disrupt downside continuation.
Failure to maintain momentum along the trendline may lead to sideways consolidation instead of a clean drop.
If this idea resonates with you or you have your own opinion, traders, hit the comments. I’m excited to read your thoughts!

AUDUSD FRGNT Daily Forecast -Q4 | W47| D21 | Y25 |📅 Q4 | W47| D21 | Y25 |
📊 AUDUSD FRGNT Daily Forecast
🔍 Analysis Approach:
I’m applying Smart Money Concepts, focusing on:
Identifying Points of Interest on the Higher Time Frames (HTFs) 🕰️
Using those POIs to define a clear trading range 📐
Refining those zones on Lower Time Frames (LTFs) 🔎
Waiting for a Break of Structure (BoS) for confirmation ✅
This method allows me to stay precise, disciplined, and aligned with the market narrative, rather than chasing price.
💡 My Motto:
"Capital management, discipline, and consistency in your trading edge."
A positive risk-to-reward ratio, paired with a high win rate, is the backbone of any solid trading plan 📈🔐
⚠️ Losses?
They’re part of the mathematical game of trading 🎲
They don’t define you — they’re necessary, they happen, and we move forward 📊➡️
🙏 I appreciate you taking the time to review my Daily Forecast.
Stay sharp, stay consistent, and protect your capital
— FRNGT 🚀
OANDA:AUDUSD

DXY FRGNT Daily Forecast -Q4 | W47| D21 | Y25 |📅 Q4 | W47| D21 | Y25 |
📊 DXY FRGNT Daily Forecast
🔍 Analysis Approach:
I’m applying Smart Money Concepts, focusing on:
Identifying Points of Interest on the Higher Time Frames (HTFs) 🕰️
Using those POIs to define a clear trading range 📐
Refining those zones on Lower Time Frames (LTFs) 🔎
Waiting for a Break of Structure (BoS) for confirmation ✅
This method allows me to stay precise, disciplined, and aligned with the market narrative, rather than chasing price.
💡 My Motto:
"Capital management, discipline, and consistency in your trading edge."
A positive risk-to-reward ratio, paired with a high win rate, is the backbone of any solid trading plan 📈🔐
⚠️ Losses?
They’re part of the mathematical game of trading 🎲
They don’t define you — they’re necessary, they happen, and we move forward 📊➡️
🙏 I appreciate you taking the time to review my Daily Forecast.
Stay sharp, stay consistent, and protect your capital
— FRNGT 🚀
TVC:DXY

ETH: major key levels!ETH:
.
Major key levels!
Wait for signals with low supply volumes at the bottom and reversal signals.
.
US STOCKS- WALL STREET DREAM- LET'S THE MARKET SPEAK!

Bitcoin M1Bitcoin at a price of $86,000 is definitely considered one of the best investment options. Even though this price drop has been quite sharp, overall it should be viewed as a market correction, and the range above $100,000 will be reached again by Bitcoin.
Sasha Charkhchian

GOLD → Waiting for NFP... High importance level!FX:XAUUSD is stagnating ahead of the news. The market is in a phase of uncertainty, with long shadows and short candlestick bodies. The key factor will be the US employment data for September.
We have not seen unemployment data for more than seven weeks, which makes this data highly significant. Complete uncertainty. Significant deviations from forecasts could significantly change expectations for Fed rates. The probability of a Fed rate cut in December fell to 33% after the publication of the minutes, in which the regulator expressed concerns about inflation.
The market expects 50K jobs to be created in September, compared to 22K in August.
The unemployment rate is forecast at 4.3%, with wage growth at 3.7% year-on-year.
The further dynamics of gold depend on the NFP data. Weaker indicators may reinforce expectations of Fed policy easing and support price growth, while strong data will put pressure on the metal
Resistance levels: 4082 - 4111
Support levels: 4040, 4006
In the current circumstances, having only one scenario means narrowing your view of the situation as much as possible. The market can be aggressive on news. Weak data could lock the price within the current range (trading between graces). However, a breakout of resistance at 4082 - 4111 and a close above this level could trigger growth. Otherwise, a breakdown and consolidation below 4040 could break the current bullish trend and trigger a sell-off to 3930 (especially against the backdrop of the Fed's weak but hawkish stance).
Best regards, R. Linda!

EURUSD: Key Liquidity Levels in Focus – Big Move LoadingEURUSD Analysis – Friday, November 21
Welcome traders! 👋
I’m glad to have you here — we’re all learning and growing together in this amazing trading journey.
Let’s dive into today’s analysis on EURUSD 👇
The previous day's analysis played out exactly as expected.
Higher-Timeframe Overview
On the weekly timeframe, EURUSD remains in a clear bearish trend, and the higher-timeframe narrative continues to point downward.
However, on the daily and 4H timeframes, price has been forming higher lows, indicating a bullish corrective phase inside the overall weekly downtrend.
This means buyers are still active within the retracement until premium POIs are reached.the price tapped to OBS zone now
Today’s Scenarios
Scenario 1 (Primary Expectation)
Price first moves downward to collect sell-side liquidity below current lows.
After sweeping liquidity of Asia session low and tapping into the discount POI, we anticipate a bullish reaction and continuation toward premium targets.
⚠️ Important Notes
The market is never 100% certain — always wait for confirmation before entering.
Manage your risk carefully at all times.
Today’s high-impact USD news may influence volatility and invalidate setups, so stay aware and updated.
Share your insights in the comments below.
📘 Educational Note
This analysis is for educational and illustrative purposes only.
Always follow your own trading plan, confirm with your strategy, and manage your risk with discipline.
Consistency comes from patience, clarity, and following your rules.
Empowering traders through clarity, confidence & clean charts.
Follow 👉 parisa_tl for more SMC setups and weekly insights 💙
#EURUSD #ForexAnalysis #SMC #OrderBlock #Liquidity #POI #MarketStructure
#SmartMoneyConcepts #DayTrading #4HAnalysis #DailyAnalysis #ForexSetups
#RiskManagement #PriceActionTrading #parisa_tl

CRUDE OIL (WTI): Bullish Move After Trap
There is a high chance that Crude Oil will pull back
from the underlined daily key level.
I see a confirmed bear trap followed by a bullish imbalance
candle on an hourly.
I expect a rise at least to 58.51 level.
❤️Please, support my work with like, thank you!❤️
I am part of Trade Nation's Influencer program and receive a monthly fee for using their TradingView charts in my analysis.

SH EUMarket is one pip short of activating recent Resistance line, but DXY confirmation is available, betting on DXY bullish movement to recover the GAP earlier today

AUDUSD FRGNT FUN COUPON FRIDAY Forecast - Q4 | W47| D21 | Y25 |📅 Q4 | W47| D21 | Y25 |
📊 AUDUSD FRGNT Daily Forecast
🔍 Analysis Approach:
I’m applying Smart Money Concepts, focusing on:
Identifying Points of Interest on the Higher Time Frames (HTFs) 🕰️
Using those POIs to define a clear trading range 📐
Refining those zones on Lower Time Frames (LTFs) 🔎
Waiting for a Break of Structure (BoS) for confirmation ✅
This method allows me to stay precise, disciplined, and aligned with the market narrative, rather than chasing price.
💡 My Motto:
"Capital management, discipline, and consistency in your trading edge."
A positive risk-to-reward ratio, paired with a high win rate, is the backbone of any solid trading plan 📈🔐
⚠️ Losses?
They’re part of the mathematical game of trading 🎲
They don’t define you — they’re necessary, they happen, and we move forward 📊➡️
🙏 I appreciate you taking the time to review my Daily Forecast.
Stay sharp, stay consistent, and protect your capital
— FRNGT 🚀
OANDA:AUDUSD

Hellena | SPX500 (4H): LONG to resistance area of 6775.Dear colleagues, according to the last forecast the price is at the support level, but as it turned out, the correction in wave “4” is a bit more complicated than I thought.
Wave “4” consists of three waves “ABC” and should be over soon. The upward movement is still in priority, but I will target the not so distant resistance area of 6775.
Once it is reached, we will think about how to reach higher levels.
Manage your capital correctly and competently! Only enter trades based on reliable patterns!

ESG & Green Energy Investments1. What ESG Actually Means
ESG refers to a set of standards for evaluating how responsibly and sustainably a company operates. These three dimensions—Environmental, Social, and Governance—serve as a framework to understand non-financial risks that can influence long-term performance.
Environmental (E)
Focuses on how a company interacts with the natural world. Key considerations include:
Carbon emissions and net-zero commitments
Renewable energy usage
Waste management and circular economy practices
Water conservation
Pollution control
Biodiversity impact
Companies that manage environmental risks well are better positioned for regulatory changes, resource scarcity, and the transition to a low-carbon economy.
Social (S)
Covers how a company manages relationships with employees, suppliers, customers, and communities. Factors include:
Labor standards and worker welfare
Diversity and inclusion
Human rights compliance
Customer safety
Community development
Data privacy and cyber security
Strong social practices improve productivity, reduce legal risks, and enhance brand value.
Governance (G)
Refers to corporate leadership and internal controls. Key governance metrics include:
Board independence and diversity
Executive compensation
Anti-corruption policies
Shareholder rights
Ethical conduct
Transparency and accountability
Good governance reduces fraud, mismanagement, and regulatory penalties—factors that directly influence shareholder returns.
2. Why ESG Matters for Investors
There are several reasons why ESG has become integral to investment decision-making:
a. Risk Mitigation
Companies with strong ESG profiles tend to face fewer controversies, regulatory penalties, or reputational setbacks. Climate-related risks—such as extreme weather, carbon taxes, and energy transition timelines—now directly influence asset prices.
b. Superior Financial Performance
Numerous studies show that companies with strong ESG adherence have:
Lower capital costs
Higher operational efficiency
Better long-term profitability
More stable cash flows
Investors increasingly see ESG not as a cost but as a value-creation strategy.
c. Growing Global Regulations
Governments worldwide are mandating sustainability reporting and emissions reduction, pushing ESG integration into standard business practice. For example, the EU’s Corporate Sustainability Reporting Directive (CSRD) and India’s BRSR framework compel listed companies to disclose ESG metrics.
d. Institutional Investor Influence
Pension funds, sovereign wealth funds, insurance companies, and large asset managers now screen investments using ESG criteria. Their portfolios are shifting toward green sectors, influencing global capital flows.
e. Consumer and Market Sentiment
Consumers prefer companies aligned with sustainability. Firms with strong ESG profiles often benefit from brand loyalty and long-term demand stability.
3. Green Energy Investments: The Core of the ESG Transition
Green energy investments refer to capital allocated to renewable and sustainable energy sources such as:
Solar
Wind
Hydro
Geothermal
Biomass
Green hydrogen
Energy storage solutions
Carbon capture and renewable fuels
The energy transition is accelerating as the world moves away from fossil fuels. Several forces drive this shift:
a. Climate Change Imperatives
Global warming concerns and carbon reduction targets under the Paris Agreement have pushed governments to accelerate renewable energy adoption.
b. Declining Renewable Costs
Technology advancements and economies of scale have drastically reduced the cost per unit of solar and wind power, making them competitive with coal and natural gas.
c. Technological Breakthroughs
Innovations in battery storage, smart grids, electric mobility, and green hydrogen are reshaping the energy sector and creating massive investment opportunities.
d. Corporate Clean Energy Demand
Tech giants, manufacturing companies, and industrial firms are increasingly committing to 100% renewable energy to meet ESG goals.
4. Key Green Energy Investment Themes
1. Solar Energy
Solar remains the fastest-growing renewable sector due to falling panel prices and rising adoption across households, industries, and grid-scale plants. Rooftop solar, floating solar, and utility-scale installations represent major avenues for investors.
2. Wind Energy
Both onshore and offshore wind offer strong long-term growth, with offshore wind emerging as a trillion-dollar market driven by advanced turbine designs and coastal infrastructure investment.
3. Green Hydrogen
Seen as the "fuel of the future," green hydrogen can decarbonize heavy industries like steel, chemicals, and shipping. Massive government subsidies globally are accelerating the sector.
4. Electric Vehicles & Charging Infrastructure
EV adoption is surging, supported by clean energy policies and consumer demand. Charging networks, battery manufacturing, and EV components represent high-potential themes.
5. Energy Storage
As renewable usage increases, storage becomes essential to stabilize grids. Lithium-ion batteries, solid-state batteries, and flow batteries are attracting significant investment.
6. Carbon Capture & Utilization
Companies are developing carbon removal technologies to meet net-zero mandates. This includes direct air capture, storage, and carbon-to-fuels technologies.
5. ESG Investing Strategies
Investors approach ESG in several structured ways:
a. Negative Screening
Excluding harmful sectors such as:
Tobacco
Weapons
Coal
Oil & gas
Gambling
Alcohol
b. Positive Screening
Selecting companies with strong ESG scores or leadership in sustainability practices.
c. ESG Integration
Embedding ESG factors into fundamental financial analysis to improve risk-adjusted return potential.
d. Thematic Investing
Focusing on themes such as renewable energy, clean technology, water conservation, electric vehicles, or circular economy.
e. Impact Investing
Investing specifically to achieve measurable social or environmental outcomes alongside financial returns.
f. Best-in-Class Approach
Investing in industry leaders with the highest ESG performance within their sector.
6. Benefits of ESG & Green Energy Investing
Lower long-term risks
Increased portfolio resilience
Exposure to fast-growing sectors
Regulatory advantages
Improved brand value and stakeholder trust
Alignment with global sustainability goals
Potential for long-term outperformance
7. Challenges and Concerns
While ESG investing is powerful, it is not without challenges:
1. Greenwashing
Some companies exaggerate ESG claims without genuine action. Investors must verify data authenticity.
2. Lack of Standardization
Different ESG rating agencies use different methodologies, creating inconsistencies.
3. Short-Term Costs
Sustainability investments often require high upfront capital.
4. Policy Uncertainties
Changes in government regulations can influence renewable project viability.
8. The Future of ESG & Green Energy Investments
The future is characterized by:
Stricter sustainability regulations
Growth of carbon markets
Increased corporate and investor accountability
Scaling of green hydrogen and storage technologies
AI-driven ESG analytics
Trillions of dollars flowing into the global energy transition
ESG and green energy investments are expected to dominate global markets for decades as climate change, technological innovation, and policy support reshape the global financial landscape.

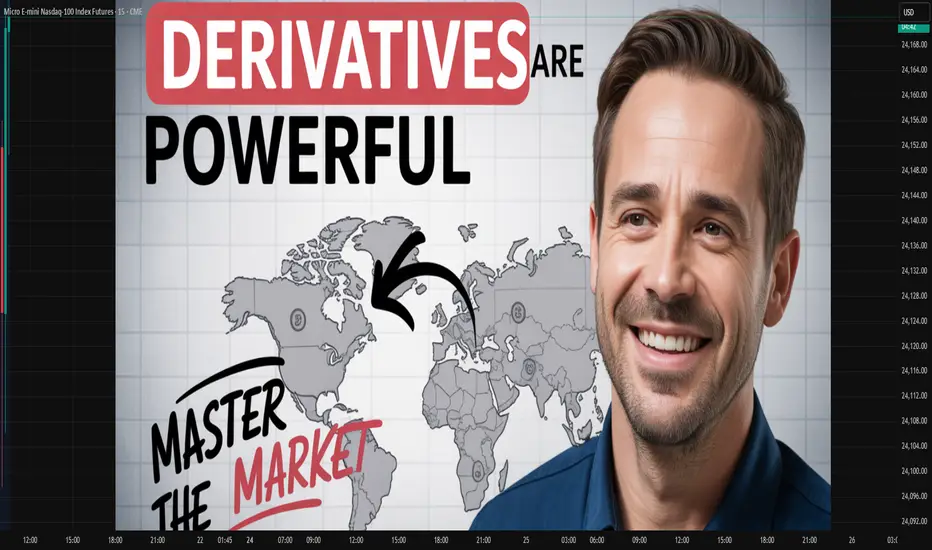
Derivatives & Options Trading Trends1. Rising Retail Participation and Democratization of Derivatives
One of the most significant trends is the rapid increase in retail participation, especially in markets like India, the U.S., and parts of Asia. Platforms such as Robinhood, Zerodha, Upstox, and Interactive Brokers have made derivatives trading more accessible by offering low-cost or zero-brokerage models, simplified interfaces, and educational tools.
In India, index options volumes on NSE have surged to record highs, driven by weekly and even daily options expiries. Retail traders now actively participate in directional and non-directional strategies including spreads, straddles, strangles, and intraday scalping. Because of lower margin requirements and high leverage, derivatives have become an attractive entry point for younger traders.
This democratization comes with both opportunities and risks. While broader participation enhances market depth and liquidity, it also increases systemic concerns around over-leverage, herd behaviour, and inadequate understanding of derivatives mechanics.
2. Explosive Growth of Weekly and Short-Dated Options
Short-tenor options—weekly, daily, and even zero-day options (0DTE)—have become a global phenomenon. The U.S. S&P 500 Index (SPX) now sees major volumes in 0DTE options, favoured by traders for intraday speculation, gamma exposure, and event-driven strategies.
Similarly, in India, weekly Bank Nifty and Nifty expiries have turned into some of the most traded options worldwide. Traders prefer these contracts for:
Lower premiums
Quick payoff realization
High volatility leading to strong intraday movements
Flexibility to align with macro events (Fed decisions, CPI data, RBI policy, earnings, etc.)
Short-dated options have reshaped intraday volatility patterns, with large swings near expiry due to gamma effects and dealer hedging flows.
3. The Era of Algorithmic and Quantitative Trading in Derivatives
Quantitative models and algorithmic trading systems now dominate global derivatives markets. Hedge funds, proprietary desks, and even retail quants increasingly use:
Market-neutral strategies
Volatility arbitrage
High-frequency scalping
Options-based hedging
Gamma and vega-weighted portfolios
Machine-learning-driven directional trades
In India, algo penetration in derivatives has increased dramatically after regulatory approvals for API-based trading. Low-latency systems allow quants to execute thousands of trades per second, exploiting micro-imbalances, liquidity pockets, and implied-volatility mispricings.
Algo trading is particularly influential in options markets, where pricing inefficiencies emerge frequently due to time decay and volatility shifts.
4. Surge in Volatility Trading and Volatility Derivatives
A major global trend is the rise of volatility as an asset class. Traders now actively trade volatility, not just price direction, through:
VIX futures and options
Implied volatility strategies (IV crush, IV expansion)
Calendar spreads
Vega-neutral portfolios
Volatility arbitrage between indices and individual stocks
During major macro events—geopolitical shocks, central bank decisions, inflation releases—volatility spikes create large opportunities for professional traders.
The global appetite for volatility exposure reflects increasing macro uncertainty in markets shaped by inflation cycles, geopolitical risks, and policy unpredictability.
5. Growing Popularity of Exotic Options and Structured Derivatives
Beyond standard call and put options, demand is rising for exotic derivatives, especially among institutions. These include:
Barrier options
Asian options
Binary options
Lookback options
Range accrual derivatives
Digital payoff structures
Structured product desks in banks use these derivatives to offer tailored risk-return solutions to corporate treasuries, high-net-worth individuals, and offshore investors.
In equity derivatives, structured notes like autocallables are gaining traction globally, especially in European and East Asian markets.
6. Commodities and Currency Derivatives: A Renewed Focus
Commodity and currency derivatives have seen renewed interest due to global supply chain disruptions, geopolitical instability, and inflation pressures.
Key Drivers:
Oil price volatility due to Middle East conflicts
Agricultural supply shocks
Currency fluctuations driven by monetary policy divergence
Rising importance of hedging for import- and export-dependent industries
In India, the launch of new currency derivatives and increased retail interest in crude oil and natural gas options have broadened the market.
7. Interest Rate Derivatives and the Post-Rate-Hike World
As central banks oscillate between tightening and easing cycles, interest rate derivatives (IRDs) such as swaps, futures, and swaptions have gained remarkable importance.
Key themes include:
Hedging long-term debt exposure
Speculation on rate paths
Positioning around government bond yield movements
Managing duration risk for institutional investors
The pricing of interest rate options is now heavily influenced by inflation expectations, forward guidance, and global economic conditions.
8. Regulation, Risk Control & Margining Reforms
Global regulators have tightened rules around derivative trading to ensure transparency and reduce systemic risk. Major reforms include:
Mandatory margining for futures and options
Upfront collection of SPAN + Exposure margin
Position limits for retail participants
Greater disclosures for brokers and exchanges
Risk-based levies on high-frequency trading
Banning of certain high-risk derivatives for retail in some regions
In India, peak margin rules and tightened risk controls have significantly changed intraday derivatives strategies, reducing excessive leverage.
9. Rise of Data-Driven Decision Making
Modern derivatives traders rely heavily on:
Real-time order book analytics
Option Greeks monitoring systems
Volatility surface modelling
Big-data sentiment indicators
AI-driven predictive models
Access to sophisticated analytics platforms—Sensibull, Opstra, TradingView, Bloomberg, Reuters, and broker-provided tools—helps even retail traders adopt institution-grade analysis.
10. Shift Toward Multi-Asset Derivative Strategies
Markets are becoming increasingly interconnected. Traders now prefer multi-asset strategies that combine:
Equity + Currency
Equity + Commodity
Interest Rate + Currency
Options + Futures
Cross-country derivatives
These hybrid strategies help hedge correlated risks and exploit arbitrage opportunities across markets.
Conclusion
Derivatives and options trading are undergoing a profound transformation driven by retail participation, technological advancement, algorithmic dominance, volatility-focused strategies, and regulatory shifts. Markets are faster, more interconnected, and more complex than ever before. Whether used for hedging, speculation, arbitrage, or portfolio diversification, derivatives remain a cornerstone of modern financial markets.
As the global environment becomes more uncertain, derivatives will continue to play a crucial role in risk management and trading innovation—shaping the next era of financial markets.
Global Banking & Financial Stability1. Introduction to Global Banking
Global banking refers to financial institutions that operate across multiple countries and offer a wide range of services—including commercial banking, investment banking, wealth management, and cross-border payment systems. These banks connect global markets by facilitating international trade finance, foreign exchange operations, capital flows, and investment activities.
The world’s large banks—such as JPMorgan Chase, HSBC, BNP Paribas, Mitsubishi UFJ, and Citigroup—are systemically important. They hold trillions in assets and operate in dozens of countries. Their global integration enhances economic connectivity, but it also means that shocks can spread quickly across jurisdictions.
2. Importance of Global Banking in the World Economy
Global banking plays a vital role in:
a) Capital Allocation
Banks direct funds to productive sectors by offering loans, underwriting securities, and supporting business expansions. Efficient allocation helps economies grow.
b) Payment and Settlement Systems
Banking infrastructure enables fast and secure cross-border payments. Systems like SWIFT, CHIPS, Fedwire, and TARGET2 ensure the smooth functioning of global financial markets.
c) Risk Diversification
Banks diversify risk by operating across multiple geographies and asset classes. This lowers the impact of localized economic downturns.
d) Foreign Exchange & Global Trade
Banks facilitate forex trading, hedging, and trade finance instruments (LCs, guarantees). Without them, global trade would slow dramatically.
e) Financial Inclusion and Technology
Through digital banking, fintech collaborations, and mobile payments, global banks accelerate financial inclusion.
3. What Is Financial Stability?
Financial stability means the financial system—banks, markets, institutions, and infrastructure—functions smoothly without widespread disruptions. A stable financial environment:
protects savings and investments
maintains confidence in banking systems
supports credit availability
prevents economic recessions caused by financial crises
When financial stability weakens, it manifest in:
bank failures
liquidity shortages
credit crunch
currency crises
stock market crashes
sovereign debt problems
Ensuring stability is therefore a top priority for central banks and regulators around the world.
4. Key Pillars of Global Financial Stability
a) Strong Banking Regulation
Regulatory frameworks such as Basel I, II, and III set global standards for capital adequacy, risk management, leverage ratios, and liquidity.
Basel III introduced:
Higher capital buffers (CET1 requirements)
Liquidity Coverage Ratio (LCR)
Net Stable Funding Ratio (NSFR)
Countercyclical capital buffers
These measures were strengthened after the 2008 financial crisis to protect banks from insolvency.
b) Effective Central Banking
Central banks maintain financial stability through:
monetary policy (interest rate decisions)
lender-of-last-resort facilities
regulation and supervision
market interventions (bond purchases, liquidity infusion)
Institutions like the Federal Reserve, ECB, Bank of England, and Bank of Japan play critical roles in global stability.
c) Deposit Insurance & Resolution Frameworks
Deposit insurance protects small depositors and prevents bank runs. Resolution frameworks allow failing banks to be wound down without taxpayer bailouts.
d) Global Cooperation
Bodies such as:
IMF
World Bank
Financial Stability Board (FSB)
BIS
Coordinate policies, share information, and manage crisis responses.
5. Major Threats to Global Financial Stability
1. Interest Rate Volatility
Rapid changes in interest rates can affect:
bond markets
bank balance sheets
borrowing costs
debt sustainability
Sharp rate hikes, like those in 2022–2024, exposed vulnerabilities in banks holding long-dated government securities.
2. High Global Debt
Global debt—household, corporate, and sovereign—has reached unprecedented levels. Excessive debt reduces economic resilience and raises default risks.
3. Bank Runs and Liquidity Crises
Digital banking has made withdrawals instantaneous. The collapse of Silicon Valley Bank (SVB) in 2023 showed how quickly liquidity crises can unfold in the modern era.
4. Geopolitical Risks
Events like:
US–China tensions
Russia–Ukraine war
Middle East conflicts
lead to currency volatility, commodity price shocks, sanctions, and capital flight.
5. Cybersecurity Threats
Banks face risks from cyberattacks, ransomware, and data breaches. As banking becomes more digital, systemic cyber risks increase.
6. Shadow Banking System
Non-bank financial institutions (NBFCs), hedge funds, P2P lenders, and money market funds can create risks outside traditional banking regulation.
7. Climate and ESG-Related Risks
Physical climate risks, energy transitions, and carbon pricing affect asset valuations, insurance exposures, and lending portfolios.
6. Lessons from Past Financial Crises
a) 2008 Global Financial Crisis
Triggered by:
excessive leverage
subprime mortgage lending
securitization
lack of oversight
It caused the collapse of major institutions (Lehman Brothers), global recession, and massive bailouts. Stronger regulations were introduced afterward.
b) Eurozone Debt Crisis (2010–2012)
Greece, Portugal, Spain, and Italy faced sovereign debt issues. It highlighted the vulnerability of economies tied by a common currency but not by unified fiscal policy.
c) COVID-19 Crisis (2020)
A global economic shutdown triggered liquidity shortages, but coordinated policy actions (rate cuts, QE, stimulus) helped stabilize markets.
d) US Regional Bank Crisis (2023)
Banks with concentrated deposit bases and interest-rate mismatches faced collapse. It reaffirmed the importance of asset-liability management.
7. Strengthening Financial Stability in the Future
1. Advanced Risk Management
Banks are deploying AI, big data, and machine learning to improve credit scoring, fraud detection, and asset quality monitoring.
2. Technology Regulation
Regulating fintechs, digital banks, crypto exchanges, and stablecoins is essential to prevent new systemic risks.
3. Climate-resilient Banking
Stress testing for climate risk and sustainable finance strategies will be vital.
4. Cross-Border Supervisory Cooperation
As banks operate globally, regulators must share real-time data and jointly manage crises.
5. Modernized Payment Infrastructure
Central bank digital currencies (CBDCs) and faster cross-border payments may improve stability by reducing settlement risks.
Conclusion
Global banking is the lifeline of the world economy, facilitating trade, capital flows, and economic development. Financial stability, on the other hand, ensures that the system can absorb shocks, support growth, and maintain public confidence.
While global banking has become more resilient since the 2008 crisis, new challenges—cyber risks, geopolitical tensions, climate risks, leveraged debt, and technological disruptions—continue to test its strength. Ensuring financial stability requires coordinated global regulation, robust central bank policies, technological safeguards, and disciplined risk management.
In an interconnected world, the stability of one nation’s financial system directly affects others. Therefore, maintaining global banking stability is not just an economic necessity—it is essential for global peace, growth, and long-term prosperity.

Bond Yield Movements (US 10-Year, German Bunds)1. What Bond Yields Represent
A bond’s yield is essentially the return an investor earns for holding that bond. Yields move inversely to prices:
Bond prices rise → yields fall
Bond prices fall → yields rise
This inverse relationship reflects investor demand. When investors seek safety, they buy more bonds, pushing prices up and yields down. When they expect strong growth or higher interest rates, they sell bonds, pushing yields up.
Why the US 10-Year and German Bunds matter
The US 10-year Treasury yield is the world’s primary risk-free benchmark. It influences global bond markets, the US mortgage market, corporate borrowing costs, and equity valuations.
The German 10-year Bund yield is the benchmark for the Eurozone, influencing borrowing costs across Europe, including in countries like France, Italy, and Spain.
These yields act as barometers of economic health and market expectations.
2. Key Drivers of Yield Movements
a. Inflation Expectations
Inflation erodes the real return on bonds. Thus:
Higher expected inflation → higher yields, due to anticipated central bank tightening.
Lower expected inflation → lower yields, reflecting stable prices and easier policy.
Recent years have seen yields swing significantly due to rapid changes in inflation, especially after global supply-chain disruptions and energy shocks.
b. Central Bank Policies
The US Federal Reserve and the European Central Bank (ECB) play a central role.
When central banks raise interest rates, bond yields tend to rise as investors demand higher returns.
When they cut rates or conduct quantitative easing (QE)—buying bonds to inject liquidity—yields decline.
Forward guidance is equally important; even statements about future policy can move yields dramatically.
c. Economic Growth Indicators
Stronger economic data—GDP growth, employment figures, retail sales—pushes yields higher because markets expect tighter monetary policy ahead. Weak data tends to pull yields down due to expectations of lower growth and potential rate cuts.
d. Risk Sentiment and Safe-Haven Flows
During geopolitical tensions, financial instability, or market panics, investors flee to safe assets:
US Treasuries and German Bunds are premium safe-haven assets.
In risk-off environments, demand for these bonds rises → yields fall.
In risk-on environments, capital shifts to equities and risk assets → yields rise.
e. Fiscal Policy and Supply of Bonds
Large government deficits require increased bond issuance, sometimes pushing yields higher if supply outpaces demand. Conversely, fiscal consolidation reduces supply pressure.
3. US 10-Year Treasury Yield: Global Leader
The US 10-year yield is the world’s most influential interest rate. Its movements ripple across global markets.
a. Impact on Global Finance
Dollar strength: Higher yields attract capital into USD assets.
Emerging markets: Rising US yields often pressure EM currencies and stocks.
Equity valuations: Growth stocks, especially tech, are sensitive to yield changes as long-term cash flows are discounted at higher rates.
b. What Drives the US 10-Year Most
Federal Reserve policy
Rate hikes push yields up; dovish policies pull yields down.
Inflation trends
CPI, PCE inflation data strongly influence expectations.
Labor market strength
Strong job numbers raise expectations of Fed tightening.
Fiscal deficits and debt issuance
US Treasury supply can push yields higher if demand weakens.
Global demand
Foreign investors—Japan, China, and global funds—play a huge role in buying Treasuries.
c. Role in US Economy
Mortgage rates closely follow the 10-year.
Rising yields → higher borrowing costs → slowdown in housing.
Corporate debt becomes costlier as yields rise.
Treasury yields serve as a baseline for risk premiums across asset classes.
Thus, the US 10-year yield shapes both domestic and global liquidity conditions.
4. German 10-Year Bund: Europe’s Anchor
The German Bund serves a similar role for the Eurozone.
a. Why Bunds Matter Globally
Seen as the ultimate safe-haven within Europe.
Forms the basis for pricing all European government bonds.
ECB policy heavily influences Bund yields, often more directly than Fed policies affect Treasuries.
b. Drivers of Bund Yields
ECB policy stance
Tightening pushes yields higher; easing pushes them lower.
Eurozone inflation dynamics
Energy prices have historically been key drivers.
Growth divergence within Europe
Bund yields often fall when southern European debt markets show stress.
Global risk sentiment
Bunds act as safe assets during global or European crises.
c. Spread Analysis: The Bund vs. Other European Bonds
A critical aspect of European markets is the spread between the German Bund and other sovereign bonds, such as:
Italian BTPs
Spanish Bonos
French OATs
Wider spreads indicate market stress; narrower spreads imply confidence in the Eurozone’s stability.
5. Correlation Between US and German Yields
While each region has unique fundamentals, the two yields exhibit strong co-movement due to global capital mobility.
a. When US Yields Drive Bund Yields
Often seen when:
US inflation surprises the market.
The Fed adopts an aggressively hawkish stance.
Global investors move capital into or out of bonds collectively.
Because of arbitrage opportunities, global bond yields cannot diverge too much for too long.
b. When Bunds Diverge from Treasuries
This happens when:
European economic weakness contrasts with strong US growth.
ECB policy lags behind the Fed.
Eurozone debt concerns create local safe-haven demand.
Thus, co-movement is strong but not absolute.
6. Macro Implications of Yield Movements
a. For Currency Markets
Rising US yields → stronger USD.
Rising Bund yields → stronger EUR, if driven by growth rather than crisis.
b. For Equities
Higher yields pressure high-valuation sectors.
Lower yields support risk assets, especially tech and growth stocks.
c. For Commodities
Higher yields often coincide with weaker commodity demand, unless inflation is the driver.
Gold tends to fall when yields rise, as bonds offer higher real returns.
d. For Corporate and Government Borrowing
All debt becomes more expensive as benchmark yields rise.
Governments with higher debt burdens face fiscal pressure.
7. Conclusion
Movements in the US 10-year Treasury and German 10-year Bund yields hold immense significance for global markets. They encapsulate expectations about inflation, growth, central bank policy, and risk appetite. As benchmarks for global financing conditions, shifts in these yields determine everything from currency valuations and equity performance to housing markets and government budgets. Understanding their dynamics allows investors, policymakers, and traders to interpret the broader economic landscape and anticipate market trends.

Global Supply Chain Shifts1. The End of Hyper-Globalization and Its Supply Chain Impact
For nearly three decades, globalization thrived on the free movement of capital, labor, and goods. Companies built sprawling cross-border supply chains to minimize costs, often producing components in multiple countries before assembling the final product elsewhere. This system worked well when trade tensions were low and transportation was cheap.
However, recent years have seen disruptions that challenged this model:
US-China trade tensions
Brexit
Rising tariffs and protectionism
Deglobalization trends
Reassessment of political and economic dependencies
This shift has forced businesses to rethink concentrated supply chains and the risks associated with reliance on single geographic hubs.
2. The Pandemic Shock: A Structural Turning Point
COVID-19 acted as a catalyst rather than the root cause of supply chain shifts. Lockdowns disrupted manufacturing hubs, cargo backlogs overwhelmed ports, and shortages hit critical sectors like semiconductors, pharmaceuticals, and electronics. Companies realized that even temporary disruptions could cause global ripple effects.
This led to a strategic pivot toward:
Supply chain resilience over lowest cost
Diversification of suppliers
Multi-sourcing instead of sole sourcing
Inventory buffers over JIT systems
The pandemic introduced a permanent mindset shift: flexibility and resilience now drive supply chain strategy.
3. Geopolitical Realignments and Strategic Decoupling
The sharp escalation of geopolitical competition—particularly between the US and China—has dramatically reshaped supply chain strategies.
Key trends include:
a. China-plus-One Strategy
Companies are reducing dependence on China by adding manufacturing bases in countries like:
India
Vietnam
Thailand
Mexico
Indonesia
China remains a major global producer, but its dominance is slowly declining as firms seek diversification.
b. Regionalization
Regional blocs like USMCA, EU, and ASEAN are gaining importance as companies locate production closer to end markets.
c. Friendshoring and Ally-shoring
Countries increasingly favor supply chain partnerships with political allies to reduce vulnerability to sanctions, trade restrictions, or diplomatic tensions.
4. Technology as a Supply Chain Disruptor
Rapid technological advancements are revolutionizing supply chains, improving transparency, efficiency, and automation.
a. Industry 4.0
Technologies such as:
Robotics
AI
IoT sensors
Digital twins
Autonomous warehousing
Predictive analytics
help reduce labor dependency, improve forecasting, and optimize real-time decision-making.
b. Blockchain
Blockchain enhances security and traceability, especially for high-value or compliance-heavy sectors like pharmaceuticals, food safety, and luxury goods.
c. 3D Printing (Additive Manufacturing)
Local, on-demand production reduces the need for long-distance shipping and large inventories. Sectors adopting 3D printing include aerospace, automotive, and medical devices.
d. E-commerce and last-mile innovation
The boom in e-commerce—accelerated during the pandemic—led companies to strengthen distribution networks, micro-fulfilment centers, and last-mile delivery infrastructure.
5. Sustainability and Green Supply Chain Transformation
Climate change and environmental regulation have become strategic imperatives.
Drivers include:
Rising carbon taxes and emissions regulations
Consumer preference for sustainable brands
Corporate ESG commitments
Climate-related disruptions (heatwaves, floods, storms)
Sustainable supply chain strategies involve:
Electrifying transportation fleets
Switching to renewable energy in factories
Circular economy practices (reuse, recycle, remanufacture)
Measuring and reducing Scope 3 emissions
Greener packaging and logistics
Eco-friendly supply chains are no longer optional—they are becoming a competitive necessity.
6. The Reshoring, Nearshoring, and Friendshoring Wave
In response to rising risks, many companies are relocating or reconfiguring production.
a. Reshoring
Bringing manufacturing back to the company’s home country to reduce geopolitical and transportation risks.
b. Nearshoring
Shifting production to nearby countries for faster delivery and lower logistics costs.
Examples:
US companies moving from China to Mexico
European firms shifting production from Asia to Eastern Europe
c. Friendshoring
Building supply chain networks with nations that share political and economic alignment.
The overall trend reflects a move from global fragmentation to regional integration.
7. Rising Costs and the New Economics of Supply Chains
Several macroeconomic factors have altered global cost structures:
Higher labor costs in China and other major manufacturing hubs
Increased shipping container and freight prices
Energy price volatility
Currency fluctuations
Higher interest rates making inventory and capital-intensive supply chains costlier
To manage these pressures, companies are:
Automating production
Renegotiating supplier contracts
Using digital tools for forecasting and efficiency
Exploring alternative logistics routes (e.g., Middle Corridor, Arctic routes)
8. Supply Chain Risk Management Takes Center Stage
Risk management has shifted from a reactive to a proactive approach.
Modern supply chain risk tools include:
AI-driven risk scoring
Geo-economic risk dashboards
Supplier risk audits
Scenario planning
Business continuity frameworks
Organizations now monitor:
Cyber risks
Natural disasters
Trade disruptions
Political instability
Supplier financial health
This investment aims to minimize disruptions and maintain operational continuity.
9. The Rise of India, Vietnam, and Emerging Manufacturing Hubs
Global supply chain shifts have benefited several emerging economies.
India
Strong government push (PLI schemes)
Expanding electronics, pharmaceuticals, and automotive manufacturing
Large labor force and growing logistics infrastructure
Vietnam
Low labor costs
Attractive for electronics and textiles
Key alternative to China
Mexico
Strategic nearshore hub for North America
Strong manufacturing base (auto, electronics)
Indonesia & Thailand
Growing role in chemicals, automotive, and consumer goods
These shifts represent a rebalancing of global manufacturing power.
10. The Future: What Global Supply Chains Will Look Like
The next decade will reshape supply chains around five strategic pillars:
1. Resilience
Multi-sourcing, regional hubs, and contingency planning.
2. Digitalization
Full integration of AI, automation, and real-time supply chain visibility.
3. Sustainability
Carbon-neutral logistics, green energy, circular manufacturing.
4. Localization
Shorter, regionally connected supply chains.
5. Geopolitical Adaptation
Flexible supply chain designs that can quickly reorient based on political realities.
Supply chains of the future will be shorter, smarter, greener, and more diversified.
Conclusion
Global supply chain shifts represent one of the most transformative changes in modern economic history. Moving away from hyper-globalized, cost-driven models, supply chains are becoming resilient, technologically advanced, and regionally diversified. Driven by geopolitics, technology, climate imperatives, and shifting economic fundamentals, the new supply chain landscape is dynamic, interconnected, and continuously evolving. Companies that adapt to these changes—embracing resilience, digital tools, and sustainability—will gain a strategic advantage in the global marketplace.

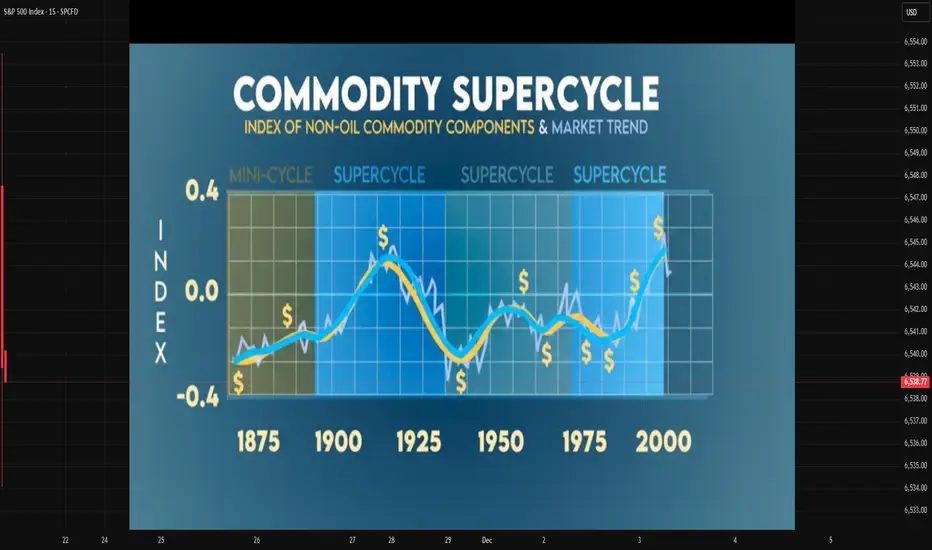
Commodity Supercycle Trends1. Understanding the Concept of Supercycles
Commodities traditionally move in cycles based on supply–demand fluctuations, but a supercycle is different in scale and duration. Price trends in supercycles tend to:
Last for 10–20 years
See sustained upward trajectories
Be driven by massive structural demand
Cause large-scale capital investments and supply expansions
Supercycles usually involve multiple commodities rising together, including crude oil, copper, aluminum, iron ore, wheat, corn, and rare earth metals.
2. Historical Commodity Supercycles
Economists identify four major commodity supercycles in the past 150 years:
a. Late 19th-Century Industrialization Supercycle (1890s–1910s)
This era coincided with the rapid industrial expansion in the US and Europe. Demand surged for coal, metals, and agricultural output to support railway construction, electricity expansion, and manufacturing.
b. Post-WWII Reconstruction Supercycle (1945–1970)
After World War II, Europe and Japan undertook large-scale rebuilding. This sharply increased the demand for energy, steel, and industrial metals. The global population was also rising rapidly, driving agricultural commodity consumption.
c. China-Led Supercycle (2000–2014)
Perhaps the most notable modern supercycle, driven by:
China’s industrialization and urbanization
Massive infrastructure investment
Globalization and trade expansion
Strong energy demand, especially crude oil
Metals like copper, iron ore, and aluminum saw exponential price growth during this period.
d. The “Green Transition” and Renewables Supercycle? (2020s–ongoing)
There is debate over whether the post-2020 environment constitutes a new supercycle. Still, strong demand for battery metals, rare earth elements, lithium, nickel, copper, and silver—essential for clean energy technologies—suggests a potential long-duration upward trend.
3. Drivers Behind Commodity Supercycles
Supercycles are created by mega-trends rather than short-term economic fluctuations. Key drivers include:
a. Industrialization and Urbanization
Emerging economies (e.g., China in the 2000s, India in the 2020s) undergo phases where construction, manufacturing, and infrastructure grow at a rapid pace. This increases demand for:
Steel and iron ore
Cement
Base metals
Energy fuels
b. Technological Shifts
New technologies can reconfigure commodity demand:
Electric vehicles → lithium, nickel, cobalt
Solar energy → silver, polysilicon
Semiconductor demand → rare earths
Technological revolutions often create entirely new commodity markets.
c. Population Growth and Changing Consumption Patterns
Growing populations increase demand for:
Food grains (wheat, rice, corn)
Protein (soybean, livestock feed)
Energy (oil, natural gas)
Urban lifestyles also increase per-capita metal and energy consumption.
d. Underinvestment in Supply
Supercycles often begin after years of:
Low commodity prices
Reduced mining investment
Capacity shrinkage
Supply chain disruptions
When demand picks up suddenly, supply cannot catch up, causing prices to surge.
e. Monetary and Fiscal Stimulus
Loose monetary policy or money supply expansion can raise:
Inflation
Liquidity in markets
Investment in commodity funds
This increases speculative and real demand for commodities.
4. The 2020s: Are We in a New Commodity Supercycle?
Analysts worldwide debate whether the 2020s reflect the start of a new supercycle. Several powerful forces suggest this possibility:
a. Energy Transition and Green Technologies
The transition to a low-carbon global economy hugely increases demand for:
Copper (electric grids, EVs)
Lithium (EV batteries)
Nickel, cobalt (battery chemistry)
Silver (solar panels)
Rare earths (wind turbines, electronics)
Estimates show the energy transition may require 3–10 times more metals compared to the current baseline.
b. Supply Constraints
This decade faces:
Mine depletion
Scarcity of high-grade ores
Stringent environmental rules
Slow permitting processes
Geopolitical resource nationalism (Africa, Latin America)
Supply shortages amplify price pressures.
c. Geopolitical Shifts
Conflicts and tensions between major powers affect commodity flows:
US–China rivalry impacts rare earths
Middle East tensions influence oil
Russia’s sanctions affect natural gas and metals
Realignment of supply chains supports longer-term price elevation.
d. Climate Change Disruptions
Extreme weather affects:
Agricultural output
Mining operations
Shipping routes
More frequent droughts, floods, and storms disrupt supply and raise volatility.
5. Major Commodities Likely to Dominate the Coming Supercycle
1. Copper
Considered the “new oil” of the green economy, copper demand is expected to surge due to:
EVs requiring 2–4 times more copper
Renewable energy grids
Electrification of industries
2. Lithium
A core input for batteries, with demand expected to grow 10–15x by 2035.
3. Nickel and Cobalt
Key metals for high-density battery chemistries.
4. Crude Oil
Despite renewable energy growth, oil demand remains strong due to:
Aviation
Petrochemicals
Industrial use
Slow transition in developing countries
5. Natural Gas and LNG
Seen as a “bridge fuel” in the transition away from coal.
6. Agricultural Commodities
Food prices are rising due to climate volatility and rising global population.
7. Precious Metals (Gold, Silver)
Investors hedge against inflation, currency depreciation, and geopolitical uncertainty.
6. Investment and Trading Implications
a. Long-Term Opportunities
A supercycle supports multi-year rallies in:
Mining stocks
Metal ETFs
Energy companies
Commodity indices
b. Volatility Will Remain High
While long-term trend is upward, short-term fluctuations will be sharp due to:
Interest rate swings
Policy changes
Currency volatility
c. The Role of Emerging Markets
India, Indonesia, Vietnam, and parts of Africa are entering new phases of:
Industrialization
Infrastructure spending
Urbanization
This will add structural demand to the global commodity landscape.
d. ESG and Sustainability Constraints
Environmental regulations limit new mining capacity, pushing prices higher.
7. Conclusion
Commodity supercycles represent long-term, structural shifts in global economic dynamics. They arise when powerful forces—industrialization, population growth, technology transitions, geopolitics, and supply constraints—drive sustained commodity demand. The world today is experiencing pressures that resemble previous supercycle conditions, especially with the rise of green energy, supply chain restructuring, and climate-driven disruptions. Whether or not this evolves into a full-fledged supercycle, commodities like copper, lithium, nickel, crude oil, natural gas, and agricultural products are likely to experience elevated demand and significant price appreciation in the years ahead. Understanding these trends helps investors and policymakers strategize effectively in a resource-constrained and rapidly evolving global economy.
Geopolitical Risks: US-China, Middle East, and Russia-Ukraine1. US–China Strategic Rivalry
The US–China geopolitical competition is the single most important strategic rivalry of the 21st century. It extends far beyond military issues and deeply penetrates technology, supply chains, trade policies, cyber security, and political influence.
A. Trade and Economic Decoupling
Since 2018, the US and China have been locked in a trade war that has evolved into a broader process of economic decoupling. The US seeks to reduce its dependency on China in areas such as:
Semiconductors
Critical minerals
Electric vehicle batteries
Pharmaceuticals and APIs
Artificial intelligence and telecommunications
Tariffs, sanctions, and export controls have disrupted global supply chains. Many companies are pursuing “China+1” strategies by shifting production to India, Vietnam, and Mexico. However, true decoupling remains complicated because China is deeply integrated into global manufacturing.
B. Technology War and the AI Race
Technology is at the core of the rivalry. The US is restricting China’s access to:
Advanced semiconductor equipment
AI chips
Quantum computing technologies
Meanwhile, China accelerates investment in self-sufficiency through initiatives like “Made in China 2025” and its national AI strategy. The global tech ecosystem is splitting into two competing blocs, affecting equipment standards, supply networks, and cybersecurity frameworks.
C. Taiwan and Military Tensions
Taiwan remains the most explosive flashpoint. China considers Taiwan a breakaway province and has intensified military activities around the island. The US supports Taiwan’s defense through arms sales and political backing. Any major escalation could disrupt:
Global semiconductor supply (TSMC)
East Asian shipping lanes
Global equity markets
Even minor incidents raise volatility across global markets.
D. Geopolitical Influence in Asia and the Global South
Both nations compete for influence:
The US strengthens alliances through Quad, AUKUS, NATO partners, and Indo-Pacific initiatives.
China expands influence via Belt and Road (BRI) investments, infrastructure financing, and strategic partnerships with Africa, the Middle East, and Latin America.
This rivalry affects voting patterns at the UN, trade agreements, and global governance systems.
Overall, the US–China rivalry increases strategic uncertainty, reshapes supply chains, and compels nations to navigate between two superpowers.
2. Middle East Geopolitical Risks
The Middle East remains a region of enduring conflict, energy dependency, and shifting alliances. Three major developments define current risks:
A. Israel–Palestine and Regional Escalations
The conflict between Israel and Palestinian groups has intensified after recent escalations. The risk lies in the potential regionalization of the conflict involving:
Hezbollah (Lebanon)
Iran
Syria
US interests in the region
Any escalation could disrupt vital energy corridors, oil shipments, and global market stability.
B. Iran–US Tensions and the Gulf
Iran’s nuclear ambitions and proxy networks in Iraq, Yemen, and Lebanon create persistent risk. The Strait of Hormuz—through which 20% of global oil passes—remains one of the most vulnerable chokepoints in the world. Threats to tanker traffic can cause immediate spikes in oil prices.
The US maintains its military presence to secure maritime routes, while Gulf states diversify politically and economically to reduce vulnerability.
C. Saudi Arabia’s Strategic Realignment
Under Vision 2030, Saudi Arabia is diversifying its economy and recalibrating its global alliances:
Improving ties with China
Balancing relations with the US
Leading OPEC+ production strategies
Mediating regional disputes
Saudi Arabia’s decisions on oil output influence global energy markets and inflation trends.
D. Fragmentation and New Alliances
The Middle East is witnessing a major geopolitical reconfiguration:
Abraham Accords brought some Arab countries closer to Israel.
Turkey is becoming more assertive in the Eastern Mediterranean.
China has brokered surprise diplomatic agreements (e.g., Saudi–Iran rapprochement).
These shifts illustrate rising multipolarity, reducing the dominance of Western diplomatic frameworks.
In short, the Middle East remains a source of energy risk, regional power struggles, and global market volatility.
3. Russia–Ukraine War
The Russia–Ukraine conflict is the largest military confrontation in Europe since World War II and has deep global consequences.
A. Energy Shock and Global Commodity Markets
The war triggered massive disruptions in:
Natural gas supply to Europe
Crude oil markets
Fertilizer exports
Grains (Ukraine and Russia are major wheat exporters)
Europe accelerated its shift toward renewables and alternative gas supplies, but global energy markets remain sensitive to military developments.
B. Sanctions and Financial Fragmentation
The US, EU, and allies have imposed comprehensive sanctions on Russia. This has:
Restricted Russia’s access to global banking networks
Frozen central bank assets
Limited technology and military imports
Forced Russia to redirect oil to China and India
Global finance has become more fragmented, accelerating the creation of alternative payment systems such as:
China’s CIPS
Russia’s SPFS
Local-currency trade agreements
This undermines the dominance of the US dollar over the long term.
C. Military Escalation and NATO Expansion
The conflict has reshaped European security:
Finland and Sweden joined NATO
Eastern Europe increased defense budgets
The US reinforced military presence in Europe
Russia has strengthened ties with China, Iran, and North Korea, forming an alternative geopolitical camp.
D. Long-Term Economic Impact
Ukraine’s infrastructure has suffered devastating damage, while Russia faces prolonged isolation. Global investors now factor geopolitical risk into investment decisions, especially in Europe.
The war also accelerates trends such as:
Defense industry investment boom
Energy transition
Rerouting of global commodity flows
The Russia–Ukraine war marks a major shift toward long-term confrontation between Russia and Western powers.
Conclusion
US–China rivalry, Middle East volatility, and the Russia–Ukraine conflict collectively define a new era of global uncertainty and multipolar competition. These conflicts disrupt supply chains, raise commodity prices, accelerate military spending, and reshape global alliances. The world is transitioning from unipolarity (US dominance) to a multipolar order where regional powers assert greater influence. Nations and businesses must navigate these risks carefully, as geopolitics will continue to drive market behavior, trade flows, and strategic decisions in the decade ahead.

Emerging Markets: India, Brazil, and Indonesia1. India: The Fastest-Growing Major Emerging Market
India stands out as one of the most dynamic emerging markets globally. With a population of over 1.4 billion and a young workforce, India provides a huge labor pool and consumer market. Its economic strengths lie in technology, manufacturing, services, and large-scale domestic consumption.
Key Growth Drivers
Demographic Dividend
India has one of the youngest populations in the world, with a median age of about 29. This creates a strong workforce and a large base of consumers driving retail, real estate, technology, and financial services.
Digital & Technological Leadership
India’s digital ecosystem is one of the world’s most advanced.
UPI revolutionized digital payments
Startup ecosystem is among the top 3 globally
IT and BPO services dominate global outsourcing
Manufacturing Push (Make in India)
The government is aggressively promoting domestic manufacturing with incentives for electronics, semiconductors, automobiles, renewable energy, and defense production.
Infrastructure Expansion
Massive investments in highways, airports, railways, ports, and metro networks aim to enhance long-term competitiveness.
Sectors with High Potential
Information Technology and AI
Renewable Energy (solar leadership)
Pharmaceuticals and biotechnology
Financial services and digital payments
Automotive and EV manufacturing
Challenges
Unemployment and uneven income distribution
Infrastructure gaps in rural areas
Regulatory complexities
Dependence on imported fuel
Despite these challenges, India’s growth trajectory is strong. It is expected to become the world’s third-largest economy by 2030, driven by structural reforms, rising consumption, and a booming tech sector.
2. Brazil: Latin America’s Largest Emerging Market
Brazil is the biggest economy in Latin America and a global supplier of commodities, agricultural products, minerals, and energy. Its enormous reserves of natural resources, expanding consumer class, and diversified sectors make it an influential emerging market.
Key Growth Drivers
Abundant Natural Resources
Brazil is a top global exporter of:
Soybeans
Coffee
Sugar
Beef
Iron ore
Oil (deep-water reserves)
Agricultural Powerhouse
Known as the “breadbasket of the world,” Brazil has fertile land, favorable climate, and advanced agribusiness technologies.
Agribusiness contributes significantly to GDP and exports, helping Brazil maintain trade surpluses.
Industrial Capacity
Brazil has strong manufacturing sectors in:
Automobiles
Aircraft (Embraer)
Chemicals
Steel
Textiles
Growing Middle Class
A large domestic consumer market supports retail, banking, and services growth.
Sectors with High Potential
Agriculture and food processing
Mining and metallurgy
Renewable energy (biofuel, hydroelectric)
Oil & gas exploration
Tourism and ecotourism
Challenges
Political instability and frequent policy changes
High public debt and inflationary pressures
Bureaucracy and governance issues
Income inequality and uneven development
Nonetheless, Brazil’s resource wealth and export-driven economy position it as a long-term growth engine for Latin America. Demand from China, the U.S., and Europe continues to shape its global trade profile.
3. Indonesia: Southeast Asia’s Rising Economic Power
Indonesia is the largest economy in Southeast Asia, with over 270 million people and a rapidly expanding middle class. Its strategic location, natural resources, and economic reforms make it a fast-growing emerging market.
Key Growth Drivers
Demographic Advantage
Similar to India, Indonesia has a young population, which fuels consumption, entrepreneurship, and labor supply.
Natural Resource Endowment
Indonesia is rich in:
Nickel (key for EV batteries)
Coal
Palm oil
Natural gas
Copper and gold
The government is encouraging downstream processing, such as nickel-based battery manufacturing, to move from raw material exporter to industrial producer.
Strategic Trade Location
Indonesia sits on major global shipping routes (e.g., the Strait of Malacca), giving it enormous trade potential and geo-economic importance.
Infrastructure Development
Indonesian government spending on ports, airports, roads, and industrial zones is improving connectivity and logistics.
Sectors with High Potential
EV battery and mineral processing
Palm oil and sustainable agriculture
Tourism (Bali, Lombok)
Manufacturing (textiles, electronics)
Digital economy (e-commerce boom)
Challenges
Dependence on commodity exports
Environmental concerns (deforestation & mining)
Bureaucracy and corruption issues
Vulnerability to global commodity prices
Still, Indonesia is on track to become a top 10 global economy by 2040, supported by industrialization, consumption, and its digital ecosystem.
Conclusion
India, Brazil, and Indonesia represent the next wave of global economic powerhouses. Their influence is rising due to strong demographics, natural resources, expanding markets, and reform-driven policies. While each country faces unique challenges—from political instability in Brazil to regulatory hurdles in India and environmental concerns in Indonesia—their long-term prospects remain robust.
As global supply chains shift, multinational companies diversify beyond China, and new technologies emerge, these markets will play a critical role in shaping world trade, investment, and economic growth in the coming decades.

$SPY $SPX $ES_F Why were so many people surprised today?AMEX:SPY SP:SPX $ES_F. Why were so many people suprised today.
Listen very carefully. —> You don’t want to go long at a downward facing moving average.
30min- facing down, 1hr flat and slightly down.
Then we went back underneath the 50DMA.
I’m going to publish the 1D timeframe as well and you can clearly see the long bearish divergence we’ve have for a while.
Y’all - today should have surprised no one.
