CADJPY Will Collapse! SELL!
My dear followers,
This is my opinion on the CADJPY next move:
The asset is approaching an important pivot point 111.45
Bias - Bearish
Safe Stop Loss - 111.62
Technical Indicators: Supper Trend generates a clear short signal while Pivot Point HL is currently determining the overall Bearish trend of the market.
Goal - 111.13
About Used Indicators:
For more efficient signals, super-trend is used in combination with other indicators like Pivot Points.
Disclosure: I am part of Trade Nation's Influencer program and receive a monthly fee for using their TradingView charts in my analysis.
———————————
WISH YOU ALL LUCK
Contains image

EUR-AUD Demand Level Ahead! Buy!
Hello,Traders!
EURAUD is approaching the horizontal demand after sweeping sell-side liquidity, hinting at early accumulation. If bullish intent confirms, expect a move toward the next buy-side liquidity target above. Time Frame 3H.
Buy!
Comment and subscribe to help us grow!
Check out other forecasts below too!
Disclosure: I am part of Trade Nation's Influencer program and receive a monthly fee for using their TradingView charts in my analysis.

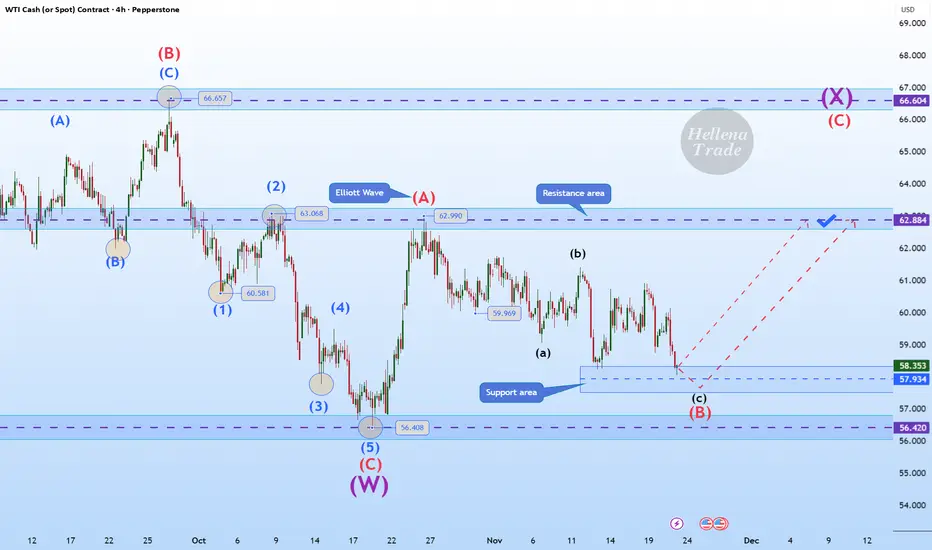
Hellena | Oil (4H): LONG to the area of the maximum of wave “A”.Colleagues, the past forecast has not been canceled, but I see some changes and therefore feel it is necessary to make a fresh forecast.
Apparently, the corrective wave “B” has extended to the area of 57.930. This is quite close to the low of wave “C” at 56.408 and the price should not update it, otherwise there will be a full-fledged break of the structure.
In connection with the above, I think that the price is already completing the downward movement and I expect the resumption of the upward movement at least to the area of the maximum of wave “A” - 62.990.
Manage your capital correctly and competently! Only enter trades based on reliable patterns!
RAND (ZAR) FLEXES MUSCLE POST-G20 BOOST ???Peace be unto you!!!
Primary Chart: USDZAR Analysis (Daily Timeframe)
Wave Analysis:
Price is completing a sideways correction that started printing in May 2023. This sideways correction in an intermediate wave (4). Minor wave A started the correction and terminated in September 2024 and minor wave B terminated in April 2025. The market is currently printing minor wave C to complete intermediate wave (4).
Indicator(s) Analysis:
1) EMA 200 & 50 (Weekly) - We may see price rally to touch these moving average lines before it continues to drop.
2) RSI 14 (Weekly) - RSI line rallying to retest 49.20 levels, it may also rally to 61.98 levels to create a Hidden Bearish Divergence.
3) MACD H (Weekly) - Faint bullish MACD H signaling that bulls are running out of steam, giving a clear signal for a Bearish Divergence.
Fundamental Analysis:
The South African government delivered a successful first G20 Leaders' Summit on the 22nd and 23rd of November 2025 that came with several billion dollars committed to few developmental projects in the country. As a result, we are seeing the rand (ZAR) strengthens against the US Dollar in the short & medium term. This will lead to a decrease in the cost of imported raw materials/goods for local consumers and businesses amongst other positive impacts.
#SabaliCapital
#TechnicalAnalysis
#G20

USD/JPY BEST PLACE TO SELL FROM|SHORT
USD/JPY SIGNAL
Trade Direction: short
Entry Level: 157.226
Target Level: 155.990
Stop Loss: 158.047
RISK PROFILE
Risk level: medium
Suggested risk: 1%
Timeframe: 2h
Disclosure: I am part of Trade Nation's Influencer program and receive a monthly fee for using their TradingView charts in my analysis.
✅LIKE AND COMMENT MY IDEAS✅

FET Bullish Flag Breakout Near Liquidity Zone Hints FET - the price has reached the liquidity zone marked in purple, moving within a bullish flag pattern.
It is more likely that the movement will continue toward the upper boundary of the pattern.
Current price: $0.2608
If the price reaches below the purple area, it is more likely that the price will continue its downward movement without rebounding upward.
Full breakdown on website

NOV.23,2025 ANALYSIS- DXY, BTC, NAS100, SPX500, XAUUSD & XAGUSDDXY CAUTION: at weekly resistance but Uptrend with a huge bullish candle suggests continuation to the upside. I expect some sideway price action potential pullback to 99.365 level and then continuation to the upside target of 100.608. A break below 99.365 will invalidate upside targets.
BITCOIN: STILL BEARISH, All my initial bearish targets from previous analysis got smashed. BTC is now in a new bearish territory only finding support at the fib extension 1.618 from the $126,296 high. RSI is very oversold and potentially there could be a sideways price action around this level re-testing $80,524 this week. Ultimately the next bearish target is between $70k and $78k.
NAS100 & SPX500 BEARISH: Both indices closed with a strong bearish candle but found support around their 21EMA on the weekly chart. I observed some unconfirmed hidden divergence plus daily stochastics cycle lows so I expect some sideways consolidation and next leg down to targets of about $23,169 for Nas100 and $6,418 for SPX500.
GOLD & SILVER SIDEWAYS: Gold on the weekly chart showed only a doji candle consolidating price action but lower high of($4,194) confirmed on the chart. I envisage that this consolidation will continue into next week and finally breakdown to the $3,826 target. Silver has maintained the double tops on the weekly and daily charts. The lower high of $52.98 also suggest more downside price action with the initial target of $45 - $47 zone.
I hope my publications are helpful to your own analysis and perspective. Thank you and please show your support for these analysis with a boost or comment so it's shown to other traders. Have a great and profitable trading week and remember risk management is your first job as a trader. Cheers!!

NZDUSD: Another Key Level 🇳🇿🇺🇸
I have accurately predicted a pullback from a key level on NZDUSD yesterday.
Today, we have a test of another one.
I expect a pullback from that to 0.5706 level.
❤️Please, support my work with like, thank you!❤️
I am part of Trade Nation's Influencer program and receive a monthly fee for using their TradingView charts in my analysis.

Important Support Zone17-11-2025
Important Support Zone
72 - 76
Sustaining this Range may lead
it towards 79 - 80 initially.
& then sustaining 80 will bring
more Highs.

Gold Bullish Targeting From $4141 NOV2025 To $4761 By APR2026Target Set on 4761
Current Tp's as follows :
1st Tp 4225
2nd Tp 4356
3rd Tp 4489
4th Tp 4624
Reasons are already given in my previous published charts, new things which i see globally is Rare Earth, AI, Space & Victory over New World Formation.

XAUUSD – 4H Outlook | Key Levels, Plans & Intraday BiasRecent candles indicate bull exhaustion at the descending trendline, with wicks rejecting higher prices. Momentum is slowing, and the chart suggests a potential short-term pullback into the support box before choosing direction.
Price is reacting to a cluster of key levels between:
4143–4130 zone (orange +blue support block)
4170 trend line resistance
4209 / 4231 resistance zone (upper yellow levels)
4268 major resistance (top of channel)
Bearish factors
Repeated rejection at descending red trendline.
Breakdown from minor rising sub-structure.
Price struggling to maintain above 4170–4180.
Bullish factors
Larger trend still inside a long-term ascending channel.
Strong support at 4130–4143 (multiple bounces).
High-timeframe buyers likely active below 4120.
✅ [ b]Plan A — Bearish Retracement to Buy Lower (Preferred Based on Current Price Action)
Idea: Price breaks below 4143–4130 to sweep liquidity, taps lower channel support, then reverses back upward.
Triggers:
Break below 4130 (blue zone)
Wick rejection or bullish reversal pattern at 4100–4080
Touch of channel support (green path in chart)
Targets:
TP1: 4130–4143 retest
TP2: 4170–4180
TP3: 4209 / 4231 (major mid-range resistance)
Invalidation:
A 4H close below 4080 signals deeper downside toward 4043.
✅ Plan B — Support Hold and Breakout Continuation (Bullish Scenario)
Idea: The purple support zone holds cleanly, price forms higher lows, breaks above the descending trendline, and resumes the uptrend.
Triggers:
Strong bounce from 4143–4130
Break and 4H close above 4175–4180
Clear breakout above the red downward trendline (purple projected path)
Targets:
TP1: 4209
TP2: 4231
TP3: 4268 (channel top / major resistance)
Invalidation:
A clean 4H close below 4130 shifts bias back to Plan A.

PI Update🚨📊 PI Update
We have a strong resistance zone in red 🔴 on PI.
Previously, price tried to break this level and failed,
showing how important this zone is.
Now the price is approaching this resistance again,
and there is a possible breakout this time
if buyers show enough strength to push above it.
This level will decide the next move —
breakout = continuation,
failure = another rejection at the ceiling.

KAS Update
🚨📊 KAS Update
KAS is approaching an important resistance zone 🔴,
but sellers are not in control this time.
Price is moving upward with strength,
and this next red zone will be the key level to watch.
KAS must break out above this resistance
to show a clean continuation toward higher targets.
Until that breakout happens,
price may face some slowdown at the resistance area.

QuantSignals V3: META Lacks Sufficient Momentum for TradeMETA QuantSignals Katy 1M Prediction 2025-11-26
Ticker: META
Signal Type: QuantSignals Katy 1M
Date: 2025-11-26
🔍 Analysis Summary
Current Price: $636.90
Final Prediction: $636.00 (-0.14%)
30min Target: $637.62 (+0.11%)
Trend: NEUTRAL
Confidence: 42.4% (Below trade threshold)
Volatility: 12.6%
⚠️ Trade Signal
No trade signal generated
Reason: Insufficient confidence and insufficient move size
Market shows flat momentum with tight trading range.
📌 Summary
0 trade signals generated from 1 analysis.
Recommendation: Wait for stronger trend or higher confidence before entering a trade.

USDCAD Expected Growth! BUY!
My dear friends,
USDCAD looks like it will make a good move, and here are the details:
The market is trading on 1.4039 pivot level.
Bias - Bullish
Technical Indicators: Supper Trend generates a clear long signal while Pivot Point HL is currently determining the overall Bullish trend of the market.
Goal - 1.4080
About Used Indicators:
Pivot points are a great way to identify areas of support and resistance, but they work best when combined with other kinds of technical analysis
Disclosure: I am part of Trade Nation's Influencer program and receive a monthly fee for using their TradingView charts in my analysis.
———————————
WISH YOU ALL LUCK

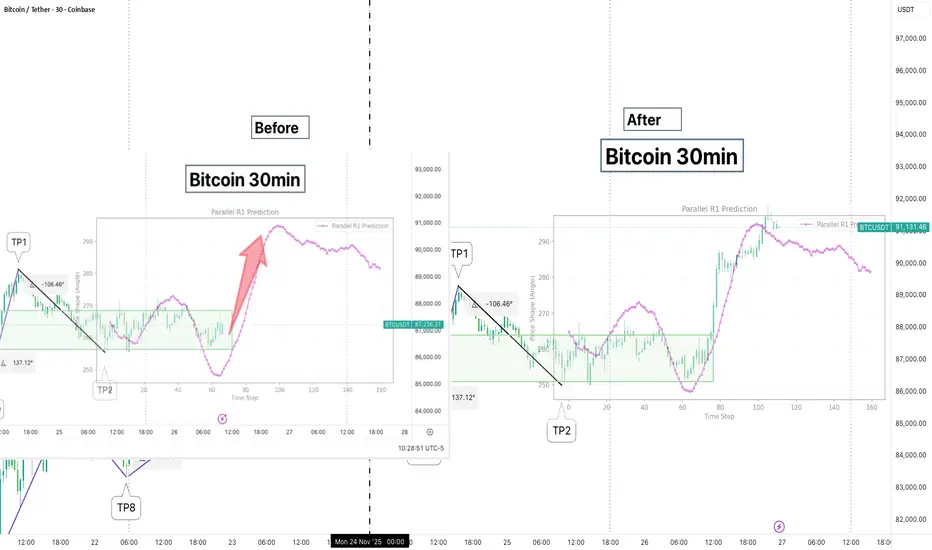
An update from yesterday. AI prediction did it againThe left is the ‘before’, what we are looking at yesterday
And the right is the ‘after’, which is what happened thereafter
The focus point is the AI prediction said it was going to go up, and it did exactly as it said it would
MYX Update🚨📊 MYX Update
MYX has also formed a new resistance zone in red 🔴.
This level is now acting as a strong ceiling,
and price must break out above this red resistance
to show any real bullish momentum again.
Until that breakout happens,
sellers remain in control and upside stays limited.

ROSE Update🚨📊 ROSE Update
ROSE is testing the red resistance zone right now 🔴.
If price manages to break out above this red level,
the first target will be the green line level 🟢 —
the next key zone on the chart.

NKE Weekly Swing Insight – Bearish Bias Despite Bullish Market"QuantSignals V3 – Katy AI
Analysis Type: Swing (17-day horizon)
Current Price: $62.50
Trade Direction: BUY PUTS
Strike Price: $62.50 PUT
Entry Range: $1.85 – $2.15
Target 1: $3.50 (+67%)
Target 2: $4.80 (+123%)
Stop Loss: $1.10 (≈40% loss)
Expiry: 2025-12-12
Position Size: 3% of portfolio
Confidence Level: 62%
⚠️ Risk & Conflict
Katy-LLM Conflict: Katy AI predicts bearish move (-0.86% over 2-3 weeks), but LLM recommendation is BUY CALLS. Medium severity.
Risk Level: Moderate
VIX Context: Falling but elevated at 20.19, moderate volatility environment.
🧠 Analysis Summary
Technical: Stock near 84.9% of swing range, weak momentum, resistance at $66.32, support at $61.01.
Candlestick Patterns: None detected
Options Flow: Strong bearish bias, Put/Call Ratio 1.40, unusual activity at $51 PUT indicates institutional positioning.
Market Context: Overall bullish market, but NKE relatively weak. Sector pressures from tariffs noted.
News Sentiment: Mostly neutral; some negative apparel sector news (tariffs, Levi’s CEO statements).
⚡ Competitive Edge
Katy AI’s bearish prediction combined with elevated put/call ratio and technical resistance creates a high-probability swing setup.
Timing advantage: stock at top of swing range with weak momentum – optimal for reversal.
Risk mitigation: 17-day expiry, tight stop, conservative position size.

EURUSD My Opinion! BUY!
My dear friends,
Please, find my technical outlook for EURUSD below:
The instrument tests an important psychological level 1.1515
Bias - Bullish
Technical Indicators: Supper Trend gives a precise Bullish signal, while Pivot Point HL predicts price changes and potential reversals in the market.
Target - 1.1553
About Used Indicators:
Super-trend indicator is more useful in trending markets where there are clear uptrends and downtrends in price.
Disclosure: I am part of Trade Nation's Influencer program and receive a monthly fee for using their TradingView charts in my analysis.
———————————
WISH YOU ALL LUCK

KOHC – TECH BUY CALL | HOUR (H) | 26 NOV 2025 | By TCAKOHC – TECH BUY CALL | HOUR (H) | 26 NOV 2025 | By The Chart Alchemist
KOHC was previously in a bearish trend, defined by a light pink channel. The stock broke out of this bearish channel and reached a high of PKR 106.80 before entering a pullback. This pullback formed a fanning wedge pattern and now appears to be complete near a retest level. The stock is set to move upwards toward multiple bullish targets.
📢 Technical Analysis by Mushtaque Muhammad (The Chart Alchemist).

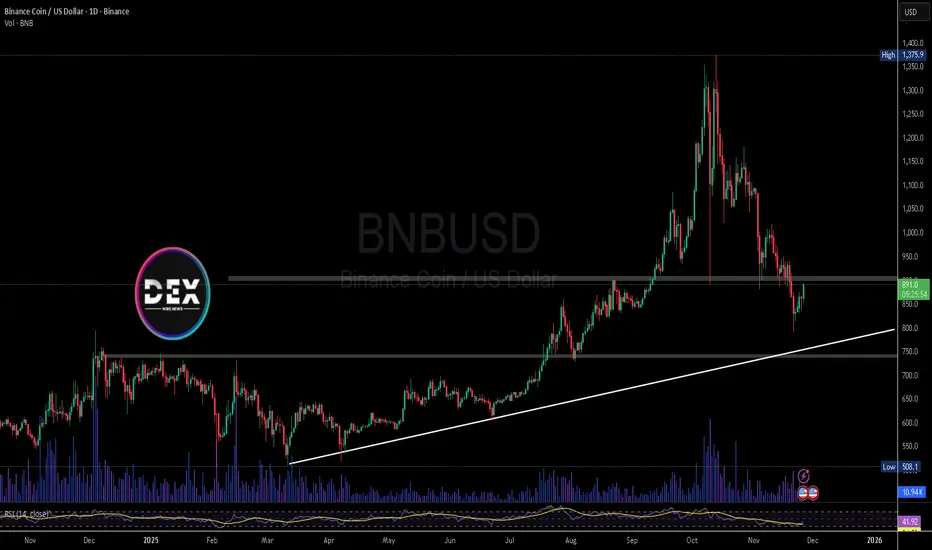
Binance Coin ( $BNBUSD) ETF Tension Meets Legal PressureBNB trades near $891 after a sharp 24% monthly drop, and the market now sits at a crossroads. The biggest question is whether institutional catalysts can outweigh regulatory pressure. VanEck’s surprise filing for a spot BNB ETF on Nasdaq marks a major milestone — the first attempt to bring BNB into U.S. regulated markets. The firm plans a trust that holds BNB directly and tracks the MarketVector BNB Index, mirroring the structure of U.S. Bitcoin and Ethereum ETFs. This signals strong institutional confidence, though SEC approval remains uncertain.
The filing also specifies no staking support at launch, though VanEck may add a third-party provider later. This transparency suggests the firm is preparing for a difficult regulatory review, especially with Binance facing growing legal challenges. More than 300 victims of the October 7 attack on Israel filed a lawsuit accusing Binance of facilitating transactions tied to sanctioned groups. This is the fourth U.S. suit with similar claims, raising the stakes as BNB seeks ETF approval.
Yet institutional interest continues to expand. BlackRock deployed its $2.5B BUIDL Fund onto BNB Chain through Securitize, enabling the fund to be used as collateral on Binance and strengthening BNB Chain’s presence in tokenization infrastructure. This provides a powerful counter-narrative to regulatory tension.
Technically, BNB remains in a fragile structure. The break below $907 turned major support into resistance. Bears now eye deeper levels, including the ascending trendline at $769 and the critical $720 zone. Resistance sits at $907, $1,020, and $1,200, with $1,375 marking all-time highs. A reclaim of $907 could flip momentum, but failure opens the door to a retest of lower supports. The next two weeks may define BNB’s path.
AI on the markets is the answerIts been many years of hardship trying to figure this damn market thing out
AI taught to do MTOPS gave it super human abilities
2026 is where it all turns around
Welcome to a preview of your future
