$AR long trade worked out well like others.NYSE:AR pumped crazy 20% profits if you listened to my entry and did not get shaken out then congrats on profits. Taking partial profits here. Will look to scale the position later next week.
Contains IO script

$sui long well playedCRYPTOCAP:SUI jumped exactly from our entry and good 17% profit if you entered long with leverage then congratulations for listening to my call.
Taking partial profits here.

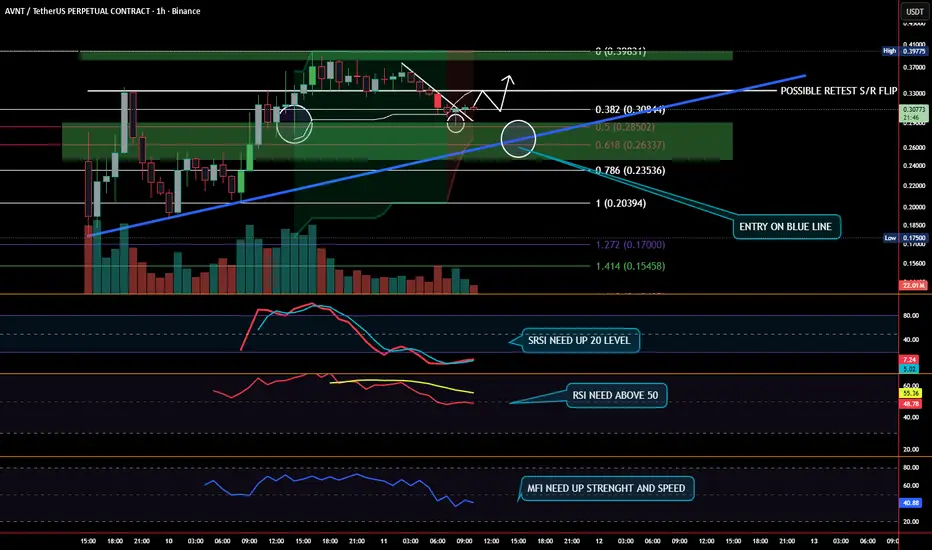
AVNT Possible entry long HELLO AVNT one hour chart possible long entry on blue line .Wait for confirmation.
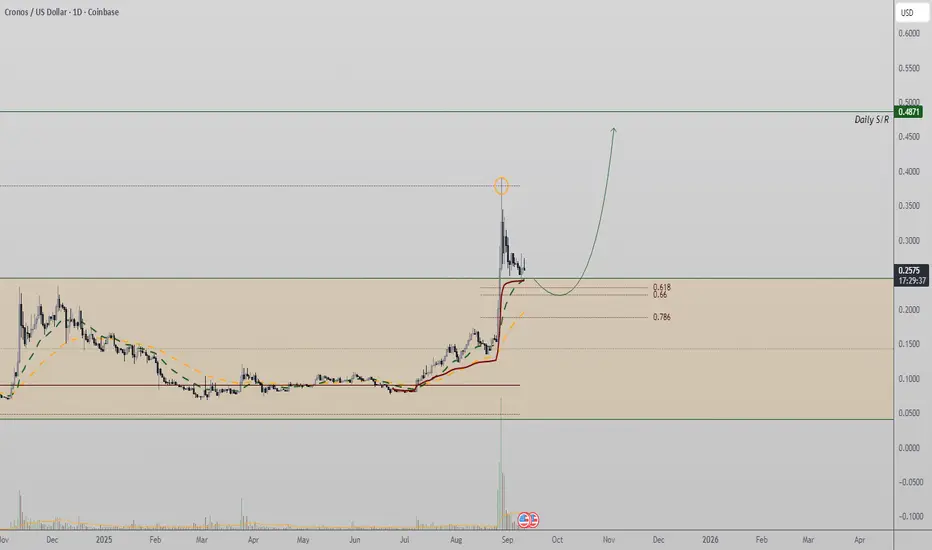
CRO Reclaims Range Support, Targets $0.48 UpsideCronos has returned to retest its old range, with confluence stacking at support levels. This gives bulls a strong foundation to attempt a reversal higher.
Key Technical Points:
- Retesting range high as new support.
- Confluence with 0.618 Fibonacci, VWAP, and moving averages.
- Upside potential toward $0.48 if support holds.
CRO recently faced rejection at the value area high, triggering a pullback into its prior trading range. However, this zone is now acting as a support base, with multiple technical indicators in alignment.
The 0.618 Fibonacci retracement, VWAP, and key moving averages all coincide at this level, forming a dense confluence area. Such overlaps often act as springboards for bullish reversals, provided demand steps in.
If buyers manage to defend the base, CRO could rotate higher toward $0.48. This would confirm a healthy retest of support and reestablish the bullish continuation structure.
What to Expect in the Coming Price Action:
As long as CRO holds above its reclaimed range, the bias remains bullish. A sustained reaction here could send price toward $0.48, reinforcing the broader bullish continuation setup.
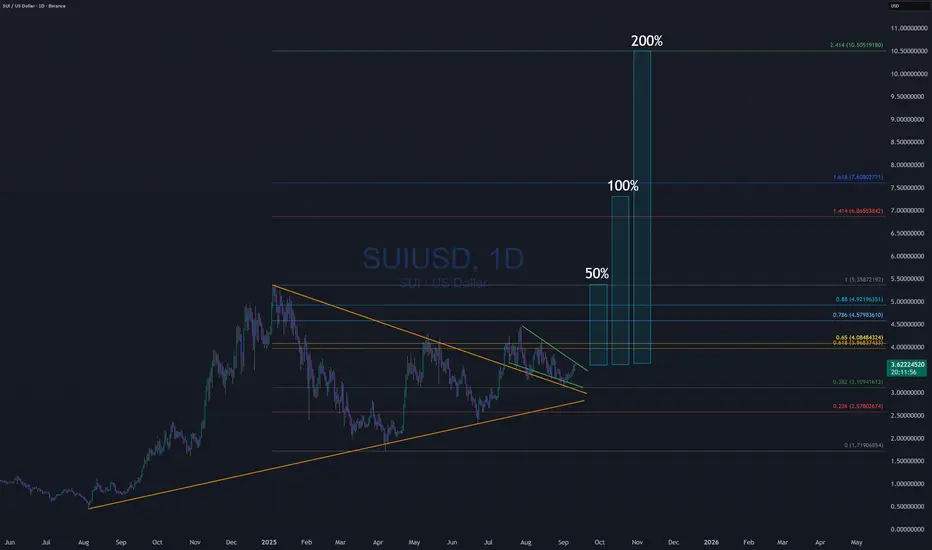
SUI long IdeaSUI LONG idea
Symmetrical triangle was broken, Market structure broken to bullish.
Breakout-retest and descending wedge will be broken up soon.

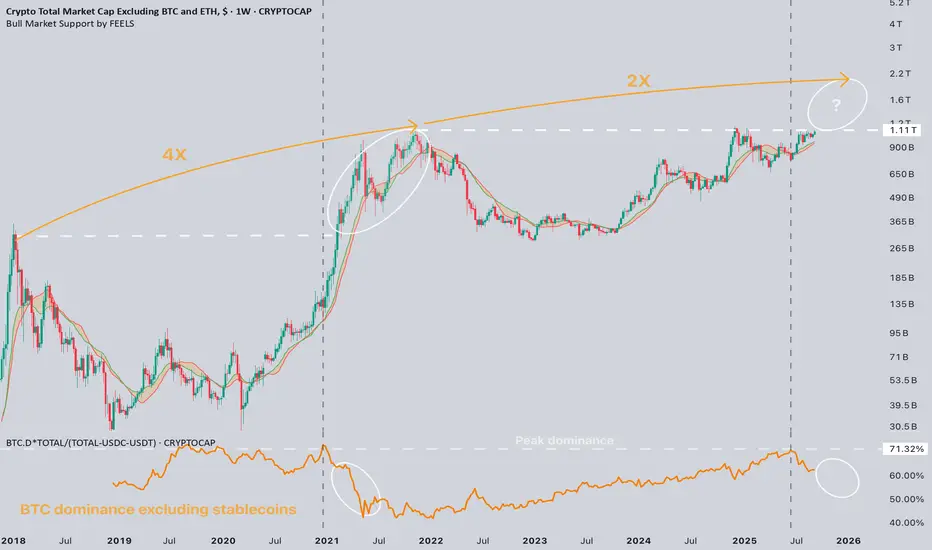
Altcoins: Is this the endgame?Some are asking if the altcoin run is already over this cycle. I don’t think so, and here’s why.
📍 Altcoins haven’t even broken their previous ATH yet. In past cycles, that usually happened after CRYPTOCAP:BTC reached its true dominance peak.
📝 Right now, we’re seeing conditions that could mirror 2021: ETF approval narratives building, steady rate cuts on the horizon, and capital rotation setting up.
📈 Of course, with diminishing returns, we shouldn’t expect 2021-style parabolic gains. But a realistic ~2x move by CRYPTOCAP:TOTAL3 from here is absolutely on the table.
💡 If you missed the September seasonality setup, there’s still time. With my indicators, support and mentorship, I’ll help you spot which assets are truly undervalued right now.
TAO LONG 1 HR TFLooking 2 long 4fter we bre4k this resistence coffin 4nd m4ke 4 bre4k of the resistence trend 4s well
entry now 342.79
stop loss 321

Long EUR/NOKLong EUR/NOK
Recommend going long EUR/NOK:
Entry: 11.6
Target: 12.10
Stop: 11.49
Recent NOK strength looks exhausted as global risk appetite softens, Fed rate cut expectations appear overstretched, and seasonal/political uncertainties weigh on NOK. Rising yields linked to deficit concerns and oversold conditions in EUR/NOK strengthen the case for a rebound. The risk-reward favors a long position, though a sharp recovery in risk appetite remains the main downside risk.
Don’t forget to like and share your thoughts in the comments! ❤️

BTC Inverse Head and ShouldersThe chart clearly shows an inverse head and shoulders formation:
Left Shoulder: ~Aug 25 low.
Head: ~Aug 29 low.
Right Shoulder: ~Sep 5-7 low.
This is a bullish reversal pattern after a prolonged downtrend. The breakout above the neckline (around 113,200 – 113,500) confirms the bullish bias.
Fib & Extension Targets :
Immediate target: Fibonacci 1.0 extension ~119,600.
Extended target: 1.618 extension ~123,500.
These align well with previous resistance levels (early August highs).

XAU OUTLOOK NYXAUUSD TRC Strategy (PRE NY)
Price is overall Looking bullish for gold as per the entire week. Price closed above the Asian High & London High on the 1HR timeframe, expecting continuation BUYS coming into the NY session.
For SELLS:
1) Create a 15M body candle close below the 15M Bullish OB at the3651.64 level.
2) Retest the strong bearish 15M CHOCH level at the 3651.64 level.
3) Create a 3/5M bearish engulfing candle to capitalize on SELLS towards the 3633 level.
For BUYS:
1) Body candle close above the 15M bearish FVG at the 3661.50level.
2) Retest the failed 15M bearish FVG at the 3661.50 level.
3) Create a 3/5M bullish engulfing candle to capitalize on BUYS
towards the 3675 level.
Trade smart, Trade Safe

XAUUSDPrice action trading is a methodology where traders make decisions based on the interpretation of actual price movements on a chart, rather than relying primarily on lagging indicators. It involves observing and analyzing candlestick patterns, trend lines, support and resistance levels, and volume to identify potential trading opportunities and manage risk. The focus is on understanding the story the market is telling through its price behavior.

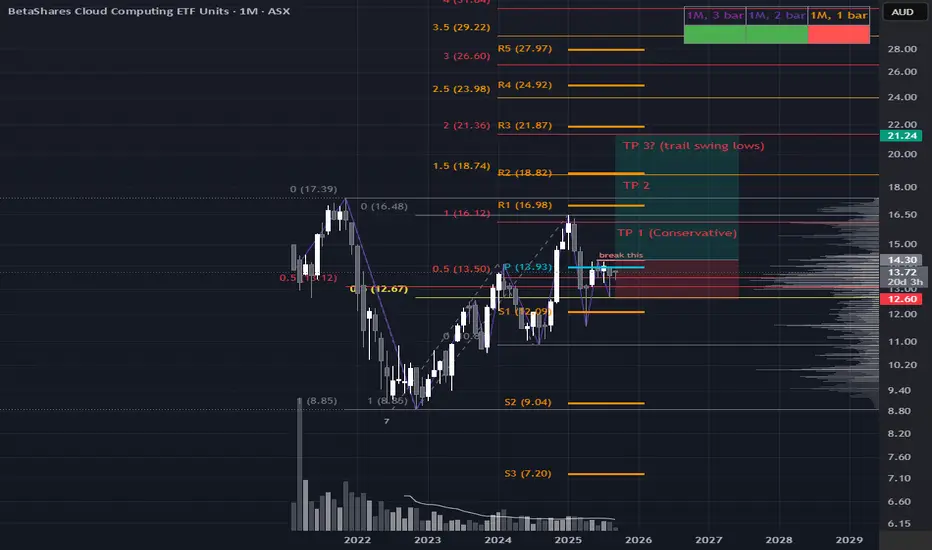
CLDD: Pullback Into StrengthStrong Long-Term Setup Developing
Price has pulled back into a well-established support zone, presenting a compelling long-term opportunity. The broader trend remains bullish, and a break above the 14.30 level would confirm renewed strength and continuation.
For risk-conscious positioning, a conservative partial take-profit near recent highs could be prudent, given the overhead resistance that deserves respect. If momentum builds, this setup could evolve into a solid trend-following play.
XERO Bounce Play at Key SupportXERO is shaping up nicely for a short-term trade setup. Last week’s price action printed a bullish hammer on elevated volume, right at the yearly pivot—a key technical level. This zone also aligns with the previous all-time high, reinforcing it as a strong support area.
If momentum holds, a logical take-profit target would sit just below the ATH. However, should price retrace further, attractive buying opportunities may emerge in the 143–129 range. That’s a scenario worth watching, but we’ll cross that bridge if it comes.

NCMI Breaks Through Downward Sloping Resistance This week NCMI broke through a downward sloping support line that started earlier this year. The price is currently above the 20SMA and about to cross over the 50SMA.
Analysts are targeting around a 3$ increase over the next year.
Analyzing the options chain for 12Dec2025 5$ strike, there is a significant disparity between the open interest of calls to puts (7950 vs 226) suggesting an overwhelmingly positive sentiment for NCMI.
Entering 5c 12Dec2025 @ 0.4

GRG Good Entry Point!The price is testing levels that have not been seen since 2022. And now the trend has been for quite some time going down trend. The stock itself has been performing okay and the current price is undervalued plus now we are seeing the first impression of long setup. The price is suggesting a high probability reversal from here.

Bitcoin breaking down to 95k !?The recent move makes me think Bitcoin could revisit the 95k area and sweep the June lows. Another scenario is we stay stuck between 105k and 115k for a while before the next big move, which then would be more likely to be up to new ATH. Until we reclaim 115k with volume, I expect down.
A big red flag for me is the lack of volume on the way up since April. Markets don’t move higher forever without new buyers stepping in, and right now it feels like momentum is running out.
95k isn’t just a random number either. It lines up with a key demand zone, and where the last big bounce started, and if price gets there with volume, that could be the reset we need. A clean sweep of the June lows would also wash out weak longs and set up a stronger base for the next move higher.
At the same time, the macro climate is still a wild card. Wars, inflation, interest rates, central banks, Trump... these are all heavy influences that can shift momentum in either direction without warning. Bitcoin might be doing its own thing, but it doesn’t live in a vacuum.
Until something changes, I’m leaning short on the way down, targeting 95k as the spot to watch for signs of real buying pressure.
What do you think?

ETH: Step by StepOn September 6, I opened a short on the 1-hour chart from $4294 — the decision was based on the indicator’s readings. The move down to $4227 allowed me to close the first target. About $70 difference per coin. Part of the profit was realized, part was left to the market — and that’s part of the plan.
The key here is not guessing but consistency. The indicator outlined the key levels, highlighted the control zone, and I followed the scenario step by step. This approach removes chaotic decisions and reduces emotional pressure.
When you see the structure of the move in advance, holding a position becomes easier. The plan turns the market from chaos into a map, where it’s clear when to take profit and when to stay calm. It helps to remain in the trade longer and make decisions without rushing.
The market will always remain unpredictable. But when actions are built on a system, results are shaped not by luck, but by discipline and the ability to move step by step.

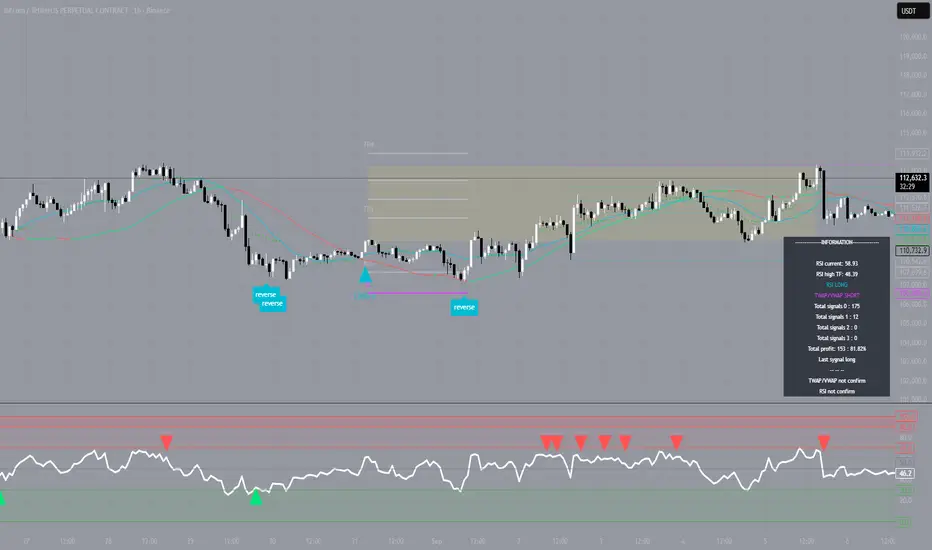
BTC: Controlling the MoveOn August 31, I opened a long on the 1-hour chart from $109,400. The upward move to $113,360 allowed me to secure three stages of profit. Nearly $4,000 difference per coin — I took part of it and deliberately left part to the market. Missed profit here isn’t a mistake, it’s part of the strategy.
The key was not guessing but management. Levels were outlined in advance, each step was monitored, so the position developed calmly without unnecessary emotions. For me, that’s essential: the market is volatile enough, there’s no need to add chaos.
With experience, you realize that strength lies not in one-off “shots,” but in consistency. When the structure of a trade is visible from entry to exit, it’s easier to hold the position. Emotions take a back seat, and results come not from luck but from discipline.
This approach makes missed dollars nothing to fear — they’re just part of the process. What matters is that the process is guided by a system, not by randomness.
ATH Technical OutlookDescription:
ATH has recently reached an All-Time High (ATH), attracting strong market attention. The price action shows increased volatility near resistance levels, while support zones are being tested by traders watching for potential continuation or retracement. From a fundamental perspective, ATH benefits from growing adoption and market interest, supported by positive sentiment in the sector.
Key factors to monitor include trading volume, liquidity flows, and broader market sentiment, which may influence whether the trend sustains above ATH or consolidates before the next move.
⚠️ Disclaimer: This is not financial advice. The content is for educational and informational purposes only. Please do your own research before making investment decisions.
#TradingView #ATH #TechnicalAnalysis #PriceAction #Crypto #Stocks #ChartAnalysis #Trading #MarketTrends #Investing #Fundamentals

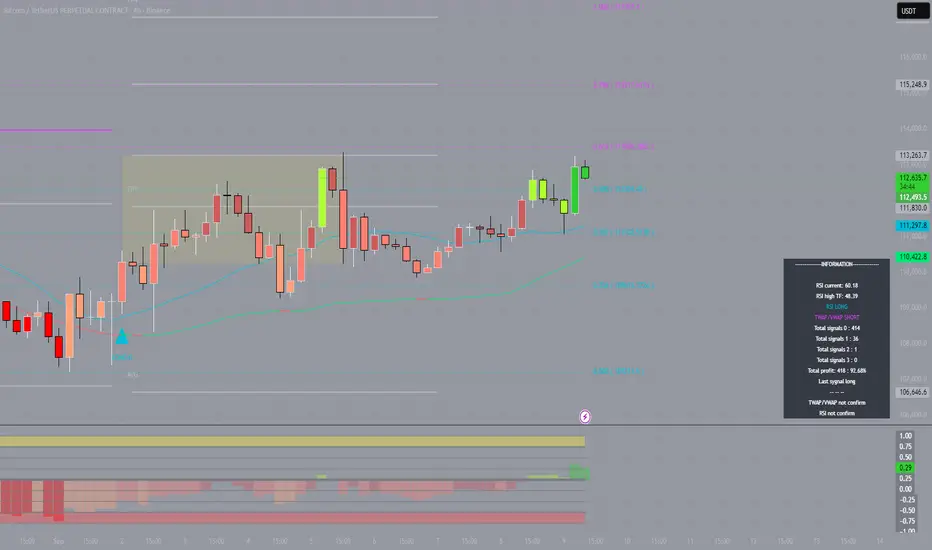
BTC: Breaking Through Levels "
On September 2, Bitcoin turned upward on the 4-hour timeframe from the $111,500 zone. From this level, a steady rise began, already passing through two profit-taking stages and reaching $113,370 — giving nearly $1,900 difference per coin. The position remains active, retaining potential for further continuation.
The key lies in how the move was managed. The algorithm marked intermediate zones, highlighted transition points, and provided ways to protect capital from unnecessary risks. Instead of chaotic decisions, the process unfolded step by step, with control at every stage.
For a mid-level trader, this format acts as an accelerator: everything already known about the market is reinforced through automation. This reduces emotional mistakes, speeds up decision-making, and allows trades to be held longer than relying on raw reactions alone.
The market will always remain unpredictable, but when management is built on a system, trading becomes a process where results are defined by discipline rather than luck."
AUDJPYPrice action trading is a methodology where traders make decisions based on the interpretation of actual price movements on a chart, rather than relying primarily on lagging indicators. It involves observing and analyzing candlestick patterns, trend lines, support and resistance levels, and volume to identify potential trading opportunities and manage risk. The focus is on understanding the story the market is telling through its price behavior.

ONGCTrend:
From 2020 lows (~₹50), ONGC rallied sharply to ~₹345 (2022 peak).
Since then, it has been in a corrective downtrend, now stabilizing near ₹205–₹230.
Still inside a rising channel (support & resistance lines drawn).
Support Levels:
Strong support near ₹200–205 (trendline + horizontal level).
If broken, next support lies around ₹175–180.
Resistance Levels:
Immediate resistance near ₹230–235 (horizontal + channel mid-zone).
Higher resistance near ₹275–280, then ₹320–345 (all-time high).
