Weekly crypto review: BTC trend structure Price continues to move in line with the main scenario discussed in previous weekly updates.
As long as the structure remains constructive and key supports hold, I'll be holding the base hypothesis of correction completion and gradual trend recovery as a prime one.
In this scenario, over the coming weeks and into Q4, I’d like to see:
• price holding above local support;
• breakout and consolidation above the 21-day EMA and 50-day MA;
• gradual movement toward next resistance zones — 115–120K, followed by 123K+.
Key levels:
• Local support: 109–107K
• Local resistance: 114–116K, then 120–123.5K
• Macro support zone: 102K
A breakdown below local support may trigger another retest of the lower boundary of the macro-support zone.
If weekly closes occur below 102K, it would notably increase the probability that the current long-term uptrend cycle is ending and a macro-correction phase is beginning.
Daily time frame:
Weekly:
Thank you for your attention — wishing everyone a calm weekend and a productive start to the new week!
Contains IO script

Scalping using PAR Scalping using PAR 10 min 60 & 240 - Make sure to watch on 15min then move to 1 min before entry

VisaNYSE:V is forming a bull flag
weekly 9/21 EMAs and 50 SMA are supporting
daily 9/21 EMAs and 50/200 SMAs are supporting
NYSE:AXP earnings were good and that is a positive sign for Visa
I am bullish.
very good R/R with stops on weekly close below 50 SMA

EDUUSDEDUUSD is in accumulation zone, Just crossed VWAP on daily and showing solid buy volume.
Power of 3 is the scenario I see.
Targets are PoC of upper range and TP2 is ATH

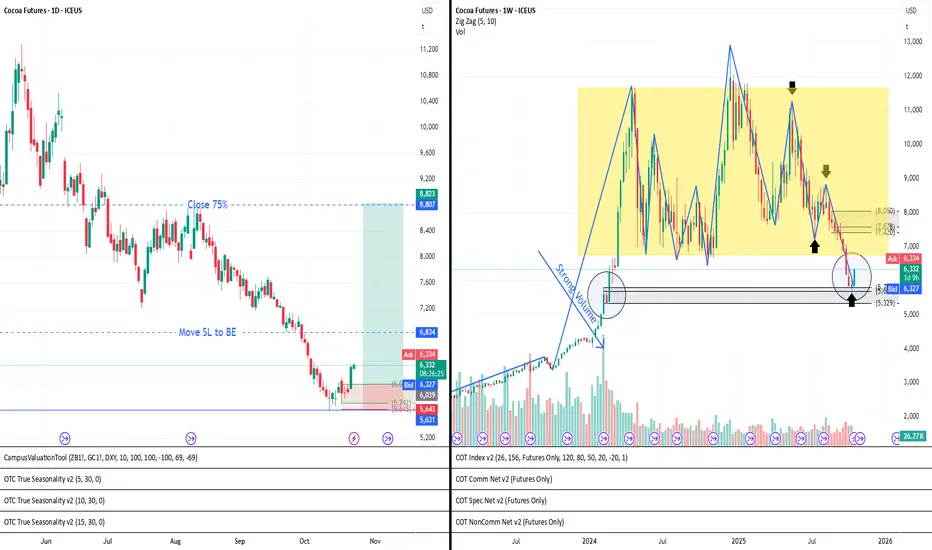
23.10.25 Cocoa Weekly buyWeekly
Cocoa reacted from a previous demand zone (Rally-Base-Rally, wider version) and it looks like it may be forming a Drop-Base-Rally pattern. This will be confirmed or invalidated with the close of this week.
At the moment, there is no clear trend, as there is still no confirmation according to my rules. Cocoa has mostly been moving sideways.
The existing risk is that we may be starting a breakout into a downtrend, since we already have one high with a lower high and one low with a lower low. However, we still need one more lower high and one more lower low to confirm a new downtrend.
Daily
A Drop-Base-Rally has formed with an explosive daily candle, which for me indicates the creation of a new demand zone inside a not-yet-confirmed weekly demand zone. My strategy is to set a buy limit order and go long.
I would prefer to see the buy limit triggered before price reaches the supply zone, because if it reacts from my weekly supply, there is a risk of confirming the downtrend.
OILUSD fast Scalp to Gapwiti created gap mostly closed within 12 hrs of creation, so that would be very fast please make sure tp have stop lose

#DAX, next leg downPreviously, I called for a short of DAX for a move down to 23700/23800 (). We got 450 points down, hit my 23700 level and rebounded 700 points, to perfection.
Market seemed weak now; could see another leg down, back to 23680 and possibly to 23200.


BTC M2 LAG📊 Overview
This chart visualizes the Lapse Legacy Fund System, a composite model integrating global liquidity metrics, macro-technical conditions, and the Hedge Fund Statistical Aggregate Index.
Each component quantifies institutional bias, volatility compression, and rate-of-change dynamics to form an adaptive probabilistic signal engine.
The system currently shows a synchronized SELL/SHORT bias across all analytical layers but we see M2 in an uptrend:
Technical Layer: -1.00 → Structural weakness within intermediate trend fractals.
Higher-TF Technical: 0.00 → Neutral higher timeframe bias, suggesting consolidation rather than acceleration.
Macro-Economic: -1.00 → Liquidity contraction and cyclical drawdown in aggregate liquidity flows.
Overall Signal: -0.67 → Weighted net bearish tilt in global risk appetite.
🧩 Interpretation
Price Structure:
Bitcoin’s price remains elevated within a mid-term distribution range following a strong parabolic advance. While the broader structure has not yet broken down, the series of lower highs on the Statistical Aggregate Index indicates declining momentum efficiency.
Global Liquidity Correlation:
The cyan and green overlays represent global liquidity curves. Historically, these lead Bitcoin by several weeks. The recent flattening in liquidity expansion hints at a potential stall phase or short-term correction window before further trending action.
System Dashboard Readout:
The composite system dashboard below the chart registers synchronized red zones across technical and macroeconomic components. Such multi-layer agreement historically precedes retracement events or trend rotations of varying magnitude.
Equity Curve (Strategy Performance):
Despite short-term volatility, the system’s equity line remains positive with a Profit Factor of 5.47 and Omega Ratio of 1.57, supporting the reliability of the signal environment.
📈 Scenario-Based Outlook
Bearish Scenario (Primary Probability):
If the macro-statistical score remains negative and liquidity stagnates, BTC may revisit support around the $89K–$94K zone before re-establishing directional clarity. This would align with prior cyclical liquidity drawdowns.
Bullish Reversal Scenario:
A decisive re-expansion in liquidity (green curve continuation) combined with an Aggregate Index rebound above zero would signal renewed institutional inflows, potentially re-targeting the $120K–$130K region.
Neutral Range Case:
If the system signals stay near zero, expect sideways mean reversion between $95K–$110K, acting as a volatility compression stage before the next macro-impulse.
🧭 Strategic Insight
This model doesn’t forecast price directly—it quantifies systemic conditions driving capital flows. When the Aggregate Index, Technical, and Macro-Economic layers align, it often precedes sustained moves.
The next directional pivot will likely be defined by liquidity regime changes rather than short-term sentiment.
🧩 Summary
“The Hedge Fund Statistical Aggregate Index currently signals systemic tightening and weakening trend persistence.
A temporary liquidity stall could prompt corrective action before macro liquidity expansion resumes.”

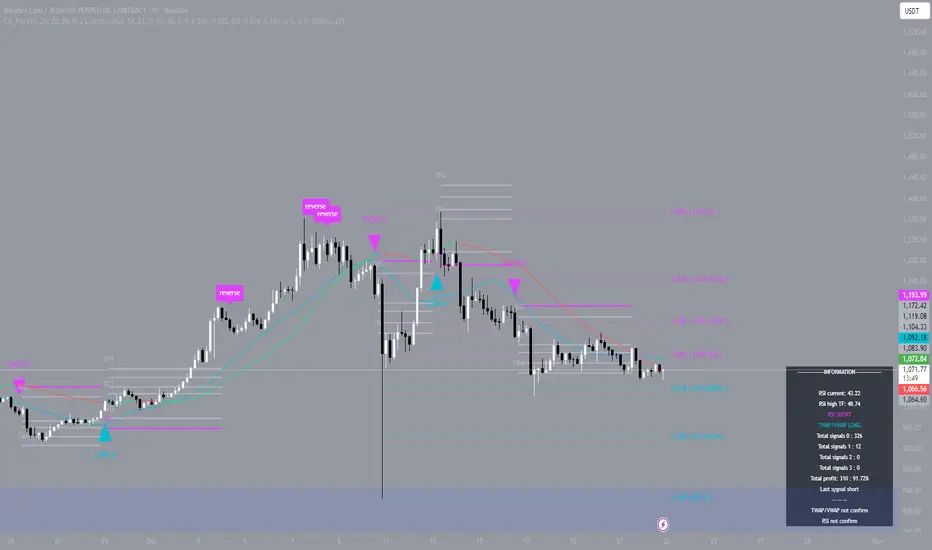
BNB rises after calmOn October 10, I watched the BNB 4-hour chart carefully. The market looked unstable, so I decided not to open a position, waiting for confirmation. That choice turned out to be right — a strong drop followed soon after, but previous take-profit levels had already been hit, which protected my balance.
On October 13, I entered on the next candle and closed the first target, taking about 2 percent profit without leverage. Nothing spectacular, but it was more about patience and discipline than chasing big moves. Then, on October 16, the setup repeated itself, but this time the momentum was stronger. All four targets were reached in sequence, giving me roughly 10 percent profit using 2x leverage.
I applied my secret custom strategy that helps analyze market structure without emotions. The indicator clearly highlighted fixation zones and confirmed trend stability. There are thousands of financial indicators on TradingView, but only a few can stay objective during turbulence. That objectivity becomes the true advantage when the market tests every trader’s discipline.
USDT.D Hits Supply Line – Reversal or Breakout?
USDT.D @ 5.12% – upper supply line (descending channel top + 5.00% resistance confluence).
What I See:
Bearish rejection: Red candle close below 5.12% → confirms reversal.
Bullish breakout: Close above 5.12% + volume spike → targets 5.40%+ (risk-off).
Bias: Bearish – price kissing supply with lower highs since 2023.
Next 24h trigger:
Break 5.00% → drop to 4.70% (altcoin fuel).
Hold/reject → grind to 5.40% (crypto caution).
Action: Watch 4h close. Rejection = short USDT.D (long alts).

BTC retracement by Wyckoff Replicated the model of Wyckoff distribution. The only thing is that he never used Fibbonacci in hes practice. While applying Fibbs will give us Swing entry at two resistance levels $98-100K and deeper at $92-94K, and the total 0.786 retrace would erase whole pump since April, that would be $84K. COnsidering that 2/3 of the trading volume is the US markets and US is currently in a bad shape, considering political situation, gov close and raw metals pump, BTC as a risk asset is still not a favorable investment. loosing 24K in short period of time or 20% value is showing that it can easy lose such value.

BTC cycle done? (ISM PMI) CRYPTOCAP:BTC & Business Cycles 🔄 (Part 2)
In the previous post, I explained how the ISM PMI reflects macroeconomic business cycles — now let’s look at how we can actually anticipate these cycles.
📈 The Global M2 (money supply) tends to lead the business cycle by about 6 months. When liquidity starts expanding, it fuels economic growth and risk appetite — and the crypto market, being one of the most liquidity-sensitive assets, reacts early.
📝 This is why #altcoins are especially dependent on liquidity flows. While Bitcoin can perform under tighter conditions due to its store-of-value narrative, altcoins rely heavily on surplus liquidity and speculative capital to thrive.
💡 The liquidity cycles continue to expand, which shows us where the ISM PMI will be in 6 months. Therefore, we can say with a high probability that we will not have a lost business cycle, but it will simply develop later.

NQ 4HR POSSIBLE MOVE AND TARGETSUsing the last swing up and pull back the market is already inside the 50/60.2/70.5 area to push higher pass the BOS

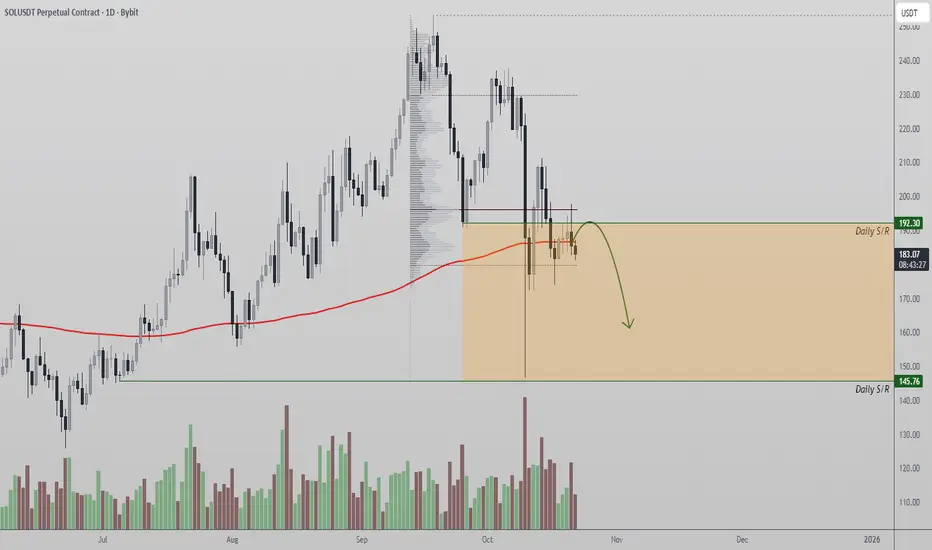
Solana Faces Strong Rejection at $192 ResistanceSolana price action is struggling to gain momentum above the $192 level, a critical zone packed with strong technical confluences. This region houses both the 200 Exponential Moving Average (EMA) and the Point of Control (POC), making it a decisive battleground for market participants.
The inability to reclaim this region suggests that bullish momentum remains limited in the short term. A rejection from this resistance could invite a deeper corrective phase, especially if buying pressure continues to fade near current levels.
Key Points:
- Major Resistance: $192, aligning with both the 200 EMA and POC, acting as a technical ceiling.
- Structural Weakness: Failure to reclaim this level limits upside continuation.
- Downside Target: Next high-timeframe support sits near $145, offering potential re-entry interest.
From a technical standpoint, Solana must close decisively above $192 to confirm strength and invalidate the current rejection bias. Until then, price remains vulnerable to a retracement toward lower liquidity zones.
What to Expect:
Expect further consolidation or minor pullbacks while below $192. A rejection from this region could accelerate a rotation toward $145, whereas a confirmed breakout would reestablish a bullish trajectory toward $210–$220.
BTCUSD 4H UPMOVE 🧭 Market Context – 4H BTC/USD
Bitcoin is currently consolidating after a strong decline, forming a potential accumulation zone near the lower support. Price is showing early signs of a bullish reversal attempt, but it is still below major resistance levels.
🔍 Key Technical Levels
Level Type Price Zone (Approx) Importance
Major Resistance 112,000 – 113,000 Final target of drawn bullish path
Mid Resistance 109,000 – 109,500 Key breakout confirmation zone
Immediate Resistance 107,800 – 108,200 First obstacle for bulls
Current Support (Holding Zone) 106,500 – 107,000 Accumulation / Reversal base
Major Support (Last Defense) 105,000 – 105,500 Break below = risk of deeper fall
🧱 Structure & Pattern
✅ Double bottom / accumulation behavior is forming around 107k, indicating buyers are defending the zone.
✅ Wick rejections below support show bullish absorption.
🚨 Still under bearish 4H structure until clean breakout over 108,200.
📈 Projected Bullish Scenario (White Path)
1️⃣ Hold above 107k and push toward 108,200
2️⃣ Break & Retest of 108.2k opens move to 109.5k zone
3️⃣ Continued higher highs leads toward 112k – 113k (major supply zone)
🐂 Bullish Confirmation Triggers
4H candle close above 108,200
Break of trailing red resistance line (bearish structure)
Increasing volume & higher lows in consolidation
🐻 Bearish Risk
Break below 106,500 may trigger liquidity sweep
Below 105k = deeper correction (next support ~103k)
🗣️ Trader Insight
This is a high-risk accumulation zone – Smart money accumulates quietly.
Ideal for swing traders waiting for breakout confirmation.
Inside range traders can scalp between 106.5k – 108k.

ATH RANGE TRADINGTODAYPlanning to trade the local range today, buy low sell high, it can be this easy. With luck it will break the pendant in the direction i am holding for the higher time frame trade.
Hopium is we rotate several more times in this range for distribution with a final big push up to squeeze shorts.

$NDX Make or BreakNDX is consolidating in a triangle, and is now re-test 25200 strong level.
Inability to break above the triangle should see a break below the triangle and a move down to 24700 first.

Richtech Robotics to $8.00!Richtech Robotics has completed a multi-month symmetrical triangle consolidation and has now broken out decisively to the upside on heavy volume. The triangle was defined by resistance near $4.23 and support near $1.13, creating a base height of roughly $3.10 (273%).
Breakout Dynamics:
Breakout Level: ~$2.17
Measured Move Projection: Applying the 273% height to the breakout point gives a technical target near $8.00.
Volume Confirmation: Breakout occurred on extreme volume (~66M shares), confirming strong market participation and adding credibility to the move.
Key Levels:
Support: $2.00 (must hold to validate breakout).
Interim Resistances: $3.50 and $5.20 (profit-taking zones).
Final Target Zone: $8.00 (measured move completion).
Interpretation:
This breakout signals the end of a prolonged consolidation phase and the beginning of a new bullish leg. The measured target of $8.00 implies potential upside of over 200%+ from breakout levels, though the path may include pauses at $3.50 and $5.20. Sustained volume and fundamental catalysts (expansion in Walmart, healthcare, and China ventures) will be critical to sustaining momentum.
Richtech Robotics is entering a technical expansion phase following a multi-month triangle breakout. With strong volume confirmation and a measured target of $8.00, RR presents a high-risk, high-reward setup in the robotics sector.
Risk management is centered on maintaining support above $2.00, with upside potential scaling in stages toward $3.50, $5.20, and ultimately $8.00.

Is NVTS about to enter wave 3 to $20.00 ?!
🔹 Thesis Summary
NVTS appears to have completed a textbook Wave (2) correction and is entering Wave (3), historically the strongest and most profitable leg of the Elliott Wave cycle. With semiconductor sector tailwinds (AI, EV, data centers), technical confluence of Fibonacci extensions, and volume confirming accumulation, the medium-term path points toward $14–22 for Wave (3) and $30 for Wave (5).
Wave (1): Strong impulsive move from ~$2.00 to ~$9.50 with high volume, breaking a multi-year descending channel.
Wave (2): Pullback into the $5.50–6.00 region (≈50% retrace of Wave 1), aligning with Fibonacci support and high-volume buying zones.
🔹 Forward Projections
Wave (3) target zone:
1.618 extension = ~$14.20
2.618 extension = ~$21.70
Wave (4):
Expected shallow retracement into ~$12–16 (23–38% of Wave 3).
Should remain above Wave (1) high (~$9.50) to keep count valid.
Wave (5):
Likely extension to $29–34 (3.618–4.236× Wave 1).
Will likely show momentum divergence (higher price but weaker RSI/volume).
🔹 Risk Management
Stop loss: Below $5.40 (Wave 2 low and 50% retracement line).
A close under this invalidates the bullish count and suggests deeper correction.

Nikkei, another leg lower first? Nikkei rallied strongly on Monday, stalled yesterday then came down. It dropped further just now but rebounded strongly. Price at a strong level here. If price is rejected by current level, look for another leg lower.

BTC/GOLDThe BTC/GOLD ratio just broke a multi-week descending trendline and pushed above a tight moving-average cluster, signalling trend transition from compression → expansion.
Momentum and breadth indicators have flipped bullish; this could be the onset of a 6–9 month relative outperformance cycle for BTC vs. gold if the breakout holds on higher-timeframe closes.

ATF trading at it's finestNot much up here to do but scalps of the LTF. Waiting to fall back into the range or form one with higher volume up here. Looking for reactions at the larger levels marked. Hopium is still the loss of the range POC to fill the open VA from Friday.
