PRE-US XAU PREDICTIONSweep of London low at 3342.32 with a confirmation in lower TF to push towards 3366. Trade smart, Trade safe guys.
Contains IO script

GER40As mentioned before, dax is going to go down, then recover. So far on the 4H chart we can see it has already started its move down.

BTCUSDT – Eyeing Liquidity & Channel Resistance BTC has rebounded strongly from the lower boundary of the descending channel, supported by a recovery in momentum indicators from oversold territory. This move has pushed price toward the upper trendline resistance, with bullish momentum eyeing key liquidity levels.
A CME gap lies just ahead, acting as a potential magnet for price action. The immediate long target sits at $115,450, aligning with the identified liquidity zone and serving as the first area of interest for partial profit-taking. Sustained bullish pressure could lead to a test of the upper channel resistance near $121,400.
However, traders should monitor price reaction closely — a rejection from resistance could trigger a retracement toward mid-channel support or even back to the lower boundary around $108,000.
Key levels to watch:
Long Target: $115,450 (Liquidity zone)
Resistance: ~$121,400 (Upper channel boundary)
Lower Support: ~$108,000 (Channel base)
📊 Bias: Short-term bullish toward $115,450, but still trading within a larger corrective structure. Reaction at $121,400 will be critical for the next trend leg.

EBAY Aggressive Pullback Setup to Deeper SupportsEBAY closed at $95.30 (+2.32%), up 22.33% over 1M, with RSI(14) at 78.55 signaling overbought exhaustion. Stochastic likely >80, ADX >25 trend intact, but price above upper BB after breaking 92 resistance. Recent all-time high near 93.50 (Aug 8) extended to 95+, but post-CPI inflation (core 3.0% YoY) and tariff risks could trigger a deeper correction in e-commerce. Analyses show potential downside to lower pivots.
Chart Analysis:
Strong uptrend from $72 support, but RSI divergence emerging. Bollinger Bands widening on volatility.
Key levels: Resistance at $97 (pivot high), deeper support at $85 (61.8% Fib from recent low, near older Bollinger lower ~$78 adjusted).
Trade Idea: Short
Entry: Below $94 (break of intraday support).
Target: $85 (deeper Fib/pivot support for extended pullback).
Stop Loss: $96 (tighter above today's high for reduced risk).
Risk: ~$2 (94 to 96), Reward: ~$9 (94 to 85), R/R: 1:4.5. Scale out at $88 if momentum fades early.
Tariffs hitting eBay harder? #EBAY #Overbought #Pullback #Ecommerce

RDDT More downside in social media?RDDT at $220.75 (+2.46%), soaring 56.38% in 1M on Q2 hype ($500M revenue +78% YoY), but overbought with Stochastic peaking >80 and price testing resistance near 221-224. ADX strong, but post-CPI jitters (core 3.0%) and November earnings volatility could accelerate the ongoing correction (down 50%+ from $230 peak). Cheat sheets highlight layered supports below 200.
Chart Analysis:
Bounce from $187 support, but RSI likely >70 with divergence. Upper BB pierced on volume.
Key levels: Resistance at $225 (near-term high), supports at $206 (2nd pivot), $200 (3rd pivot/50% Fib), deeper $187 (recent low/61.8% Fib).
Trade Idea: Short
Entry: Below $218 (break of today's low).
Target: $187 (deeper support for full correction wave).
Stop Loss: $223 (tighter above resistance for minimized risk).
Risk: ~$5 (218 to 223), Reward: ~$31 (218 to 187), R/R: 1:6.2. Partial exit at $200 if volume spikes.
More downside in social media? #RDDT #Overbought #TechPullback #CPI

PLTR AI hype cooling off? PLTR dipped to $182.68 (-2.29%), still up ~22% 1M, with RSI(14) at 80.25 and all-time high of 187.99 hit Aug 8. Stochastic >85, ADX >30, but fading volume post-Q2 (mixed AI outlook) and CPI-driven yield pressure suggest reversal below 190 resistance. Forecasts point to supports at 175/160 if 180 breaks.
Chart Analysis:
Uptrend from $150, but RSI at extremes with potential divergence. Price above EMA(50) ~$170, upper BB tested.
Key levels: Resistance at $188 (recent high), supports at $175 (near-term), $172.5 (HVL), deeper $160 (major pivot/Fib 61.8%).
Trade Idea: Short
Entry: Below $180 (break of key level).
Target: $160 (deeper support on earnings fade).
Stop Loss: $185 (tighter above resistance for lower risk).
Risk: ~$5 (180 to 185), Reward: ~$20 (180 to 160), R/R: 1:4. Watch for confirmation if loses 172.5.
#PLTR #Overbought #Tech #Pullback

We pull out Pink for the 50's We should see Hype push up to the 50's-60's on this next push up. Will be watching for Eth to lead the way for Alts.

Ethereum Struggles to Complete above the 0.786 Bearish 5-0 ZoneWhile on the intra-bar price action on ETH has gotten pretty excited above the 0.786 it is still worth considering that ETH has not completed any bars above the 0.786 since the breakout and that at a moments noticed much of the current price action above the main 0.786 PCZ could later find itself being filtered out of the Renko charts as a whole depending on how many Average True Ranges above the 0.786 PCZ ETH possible move.
Based on the fact that the current candle is simply still in the projection phase I'd caution longs here and remain accumulative of longer dated puts. There is also a 2x leveraged ETF of ETH called ETHU which has OTM monthly call options trading at 20-40 dollar premiums. I'd consider farming off of those premiums in the form of Bear Vertical Spreads as a way to hedge off the costs of holding the long puts.
Overall, we are still trading at the PCZ of the Bearish 5-0 which seems to also be in the similar shape of a Bearish Head and Shoulders pattern; the measure move of which could take ETH down to around $355 upon the break of $1,600

LTC working on the breakoutLTCUSD working on the breakout of our bullish pennant / triangle contracting!
Volume is increasing, that are good signs, volatility is not becoming crazy high, another good sign.
Timewise, compared to previous cycles, its moving a little bit late, but still looking good.

Stablecoins: Stability in a World of VolatilityIn the cryptocurrency space, everything changes rapidly: trends form within hours, and assets can rise or fall by double-digit percentages in a single day. In such conditions, traders need a tool that allows them to preserve capital and act without haste. That tool is the stablecoin — a digital asset with a fixed price.
They serve as a kind of “safe harbor” in the storms of the crypto market. Even if Bitcoin or Ethereum face a sharp correction, a stablecoin theoretically remains equal to 1 US dollar (or another pegged currency).
What is a Stablecoin
A stablecoin is a token whose value is pegged to a base asset at a 1:1 ratio. Most commonly, this peg is to the US dollar, but there are stablecoins linked to the euro, gold, or even a basket of assets.
The idea is simple: combine the convenience of cryptocurrencies (fast transfers, no borders, transparency) with the predictability of traditional money. This allows traders to quickly move capital between positions or exchanges without losing value to volatility.
Main Types of Stablecoins
1. Fiat-Backed
The issuer holds actual dollar reserves in bank accounts.
The peg is maintained by allowing token holders to redeem them for fiat at any time.
Examples: USDT (Tether), USDC.
Pros: high liquidity, easy to understand.
Cons: reliance on the issuer and a centralized structure.
2. Crypto-Backed
Backed by other cryptocurrencies used as collateral.
Collateral often exceeds the token’s face value to protect against volatility.
Example: DAI by MakerDAO.
Pros: decentralization and blockchain transparency.
Cons: risk of a sudden drop in collateral value, which can trigger liquidations.
3. Algorithmic
The peg to the dollar is maintained via smart contracts that regulate the supply of tokens.
Tokens are minted when the price rises and burned when it falls.
Examples: former UST (Terra) before its 2022 collapse.
Pros: decentralization, no need for real reserves.
Cons: highly vulnerable to market panic.
Why Stablecoins Matter to Traders
Locking in Profits
Closed a profitable ETH long? Instead of cashing out to fiat, you can convert to a stablecoin and preserve purchasing power until your next entry.
Protection from Volatility
When the market looks overheated or uncertain, stablecoins allow you to “go into cash” without leaving the crypto ecosystem.
Liquidity and Transfer Speed
A traditional bank transfer may take days, while moving USDT or USDC takes minutes — crucial for arbitrage or quick reactions to news.
A Tool for Margin Trading
Many futures platforms use stablecoins as the base currency for settlements, simplifying profit and loss calculations.
Risks and Pitfalls
Regulatory Pressure
Centralized issuers can freeze addresses or restrict operations in response to government requests.
Losing the Peg (Depeg)
If confidence in the issuer or system drops, the stablecoin’s price may deviate from $1. Algorithmic stablecoins are particularly vulnerable.
Centralization
Fiat-backed tokens depend on the issuing company, which controls reserves and redemption processes.
💡 Practical Use with CV_Pro
When trading crypto futures with CV_Pro, stablecoins can serve as a “parking spot” between trades. Closed a profitable position? Move funds into USDT, wait for the next signal, then re-enter. This reduces the impact of volatility and gives you time to make thoughtful entries.

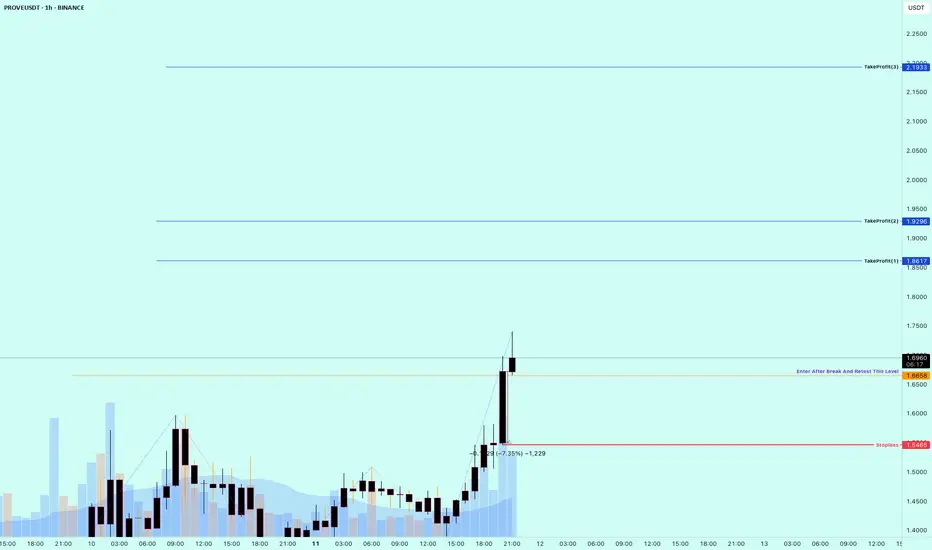
Buy Trade Strategy for PROVE: Driving Trust in BlockchainDescription:
This trading idea highlights PROVE, a cryptocurrency focused on enhancing trust and transparency in digital transactions through blockchain-based identity and data verification. By offering secure, tamper-proof verification solutions, PROVE aims to solve critical issues in industries such as finance, supply chain, and digital identity management. Its growing adoption, strategic partnerships, and innovative technology position it as a potentially valuable asset in the rapidly evolving Web3 landscape. As demand for reliable verification solutions increases, PROVE stands to benefit from its niche yet expanding market role.
Still, it’s important to note that the cryptocurrency sector is highly volatile, and PROVE is not immune to sharp price fluctuations caused by regulatory changes, technological challenges, or shifts in investor sentiment. Investors should approach with a clear strategy and proper risk controls.
Disclaimer:
This trading idea is for educational purposes only and should not be taken as financial advice. Trading cryptocurrencies like PROVE involves significant risk, including the possibility of losing your entire investment. Always conduct comprehensive research, evaluate your personal financial situation, and consult with a financial advisor before making any investment decisions. Past performance is not indicative of future results.
USDJPY Looks Bearish, Your thoughts ?USDJPY Looks Bearish, It has been falling hard after touching resistances. Now it will continue to glide. Check your support and resistances and open positions accordingly. Wait for Price Again and strong solid breakouts to enter the market.
Disclaimer:
The content presented in this IMAGE is intended solely for educational and informational purposes. It does not constitute financial, investment, or trading advice.
Trading foreign exchange (Forex) on margin involves a high level of risk and may not be suitable for all investors. The use of leverage can work both for and against you. Before deciding to participate in the Forex market, you should carefully consider your investment objectives, level of experience, and risk tolerance.
There is a possibility that you may incur a loss of some or all of your initial investment, and therefore, you should not invest money that you cannot afford to lose. Be fully aware of all the risks associated with foreign exchange trading, and seek advice from a licensed and independent financial advisor if you have any doubts.
Past performance is not indicative of future results. Always trade responsibly.

GBUPSD Still goes down and down on every time frame.GBPUSD Still way bearish on every time frame. This could fall hard on D1 and H4 Analysis ? What are your thoughts ? Check your support and resistances and open positions accordingly. Wait for Price Again and strong solid breakouts to enter the market.
Disclaimer:
The content presented in this IMAGE is intended solely for educational and informational purposes. It does not constitute financial, investment, or trading advice.
Trading foreign exchange (Forex) on margin involves a high level of risk and may not be suitable for all investors. The use of leverage can work both for and against you. Before deciding to participate in the Forex market, you should carefully consider your investment objectives, level of experience, and risk tolerance.
There is a possibility that you may incur a loss of some or all of your initial investment, and therefore, you should not invest money that you cannot afford to lose. Be fully aware of all the risks associated with foreign exchange trading, and seek advice from a licensed and independent financial advisor if you have any doubts.
Past performance is not indicative of future results. Always trade responsibly.

AUDUSD Continues the UP Move ??!!After touching strong downs on every larger time frame, AUDUSD Continues to catch the Bullish Momentum. Check your support and resistances and open positions accordingly. Wait for Price Again and strong solid breakouts to enter the market.
Disclaimer:
The content presented in this IMAGE is intended solely for educational and informational purposes. It does not constitute financial, investment, or trading advice.
Trading foreign exchange (Forex) on margin involves a high level of risk and may not be suitable for all investors. The use of leverage can work both for and against you. Before deciding to participate in the Forex market, you should carefully consider your investment objectives, level of experience, and risk tolerance.
There is a possibility that you may incur a loss of some or all of your initial investment, and therefore, you should not invest money that you cannot afford to lose. Be fully aware of all the risks associated with foreign exchange trading, and seek advice from a licensed and independent financial advisor if you have any doubts.
Past performance is not indicative of future results. Always trade responsibly.

USDCAD Prepaing to Gilde Down ??USDCAD has been struglling to move up, All the monthly and Bi-Monthly analysis show down including D1. Check your support and resistances and open positions accordingly. Wait for Price Again to preform and see the strong breakouts.
Disclaimer:
The content presented in this IMAGE is intended solely for educational and informational purposes. It does not constitute financial, investment, or trading advice.
Trading foreign exchange (Forex) on margin involves a high level of risk and may not be suitable for all investors. The use of leverage can work both for and against you. Before deciding to participate in the Forex market, you should carefully consider your investment objectives, level of experience, and risk tolerance.
There is a possibility that you may incur a loss of some or all of your initial investment, and therefore, you should not invest money that you cannot afford to lose. Be fully aware of all the risks associated with foreign exchange trading, and seek advice from a licensed and independent financial advisor if you have any doubts.
Past performance is not indicative of future results. Always trade responsibly.

USDCHF Bullish Continuation ?Preparing to shoot up again. Keep your support and resistance in eyes and do entries on breakout. Can touch 0.81715 again.
Disclaimer:
The content presented in this IMAGE is intended solely for educational and informational purposes. It does not constitute financial, investment, or trading advice.
Trading foreign exchange (Forex) on margin involves a high level of risk and may not be suitable for all investors. The use of leverage can work both for and against you. Before deciding to participate in the Forex market, you should carefully consider your investment objectives, level of experience, and risk tolerance.
There is a possibility that you may incur a loss of some or all of your initial investment, and therefore, you should not invest money that you cannot afford to lose. Be fully aware of all the risks associated with foreign exchange trading, and seek advice from a licensed and independent financial advisor if you have any doubts.
Past performance is not indicative of future results. Always trade responsibly.


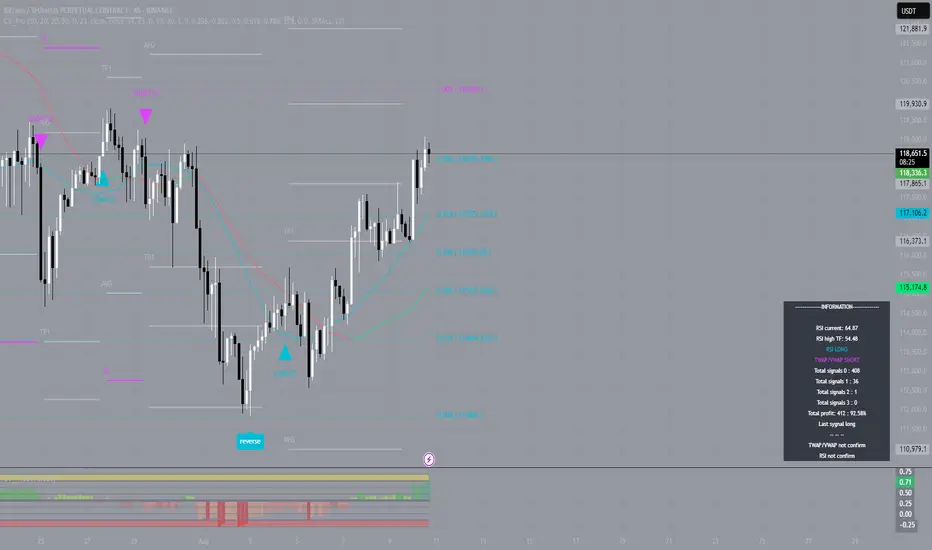
#BTC — TP2 Closed by Indicator SignalAs anticipated, Bitcoin continued its upward movement, and our indicator precisely identified the optimal entry point for a long position. The signal was triggered around the $114,000 level, allowing for a timely entry and guided trade management toward the target levels.
The first target was reached within three days, and yesterday the second Take Profit (TP2) level was successfully closed. Throughout the entire trade, the indicator consistently outlined holding zones and partial profit-taking points, ensuring a systematic approach free from emotional decision-making.
The current price is approaching the TP3 area; however, divergence and convergence analysis indicate an increased likelihood of a correction. Despite the absence of a clear reversal impulse, the risk-to-reward ratio has already reached an optimal level, making profit-taking at the current range a justified decision.
The long position opened on the indicator’s signal delivered strong results once again, confirming that precise entries and algorithm-based trade management enable traders to fully capitalize on market movements.
Altcoins and Altseason:How to Understand and Use Them in Trading
The cryptocurrency market has long moved beyond Bitcoin’s monopoly. Today, it consists of thousands of digital assets, each with its own technology, goals, and economic model. Among traders, two terms are frequently used — “altcoin” and “altseason,” and understanding them is essential for anyone aiming to earn consistently in crypto.
An altcoin is any cryptocurrency other than Bitcoin. The first alternative coins appeared in 2011, when developers sought to improve BTC by offering faster transactions, new algorithms, or additional features. Today, some of the most well-known altcoins include:
Ethereum (ETH) — the leader in smart contracts and decentralized applications.
Ripple (XRP) — focused on fast international transfers.
Cardano (ADA) — known for its scientific approach and energy efficiency.
Solana (SOL) — prioritizes ultra-fast transaction speeds.
Polygon (MATIC) — tackles blockchain scalability issues.
Altseason refers to a period when altcoins become the main growth drivers of the market, outperforming Bitcoin in both speed and volume of price gains. During this time, investors often take profits from BTC and move capital into other projects. As Bitcoin’s dominance declines, space opens up for alternative coins to rally. In such phases, traders shift their attention to promising technologies and big news stories, with many altcoin charts showing growth that far exceeds that of Bitcoin.
For a trader, altseason is not just a flashy market phase — it’s a period of maximum opportunity. With the right analysis, it can deliver returns that are hard to achieve during normal market conditions. However, the potential for high profit also comes with high risk. The altcoin market is known for sharp volatility, and choosing the wrong asset can result in losses just as significant as potential gains.
That’s why it’s crucial not only to understand what altcoins and altseason are but also to recognize them in time. This requires a combination of fundamental and technical analysis, tracking Bitcoin dominance trends, and using reliable trading tools that can spot shifts in market cycles. With a thoughtful approach, altseason can become the window of opportunity that opens the door to new results in trading.
"XAU/USD: Testing Critical Resistance - Breakout or Pullback?"
📊 XAUUSD Analysis - 15M Timeframe
Current Price: 3,398.810
📈 Market Structure:
Strong uptrend with price testing critical resistance zone. Clear supply and demand levels identified with defined risk parameters.
🎯 Key Levels:
Resistance/Supply: 3433.49 - 3429.99 (Upper target)
Immediate Resistance: 3404-3409
Support/Demand: 3389.11 - 3381.40
Secondary Support: 3375.22 - 3371.57
📋 Trade Setup:
Bullish Scenario: Break above 3409 → Target 3433.49
Bearish Scenario: Rejection at 3409 → Pullback to demand zones
Buy SL: Body candle close below 3404
Sell SL: Body candle close above 3409
⚠️ Risk Management:
Using body candle closes for stop losses to avoid false breakouts. Multiple demand zones provide structured support levels.
💡 Strategy: Wait for clear breakout confirmation or rejection before entry. Ascending trendline provides dynamic support for bullish bias.
This is not financial advice. Trade at your own risk.

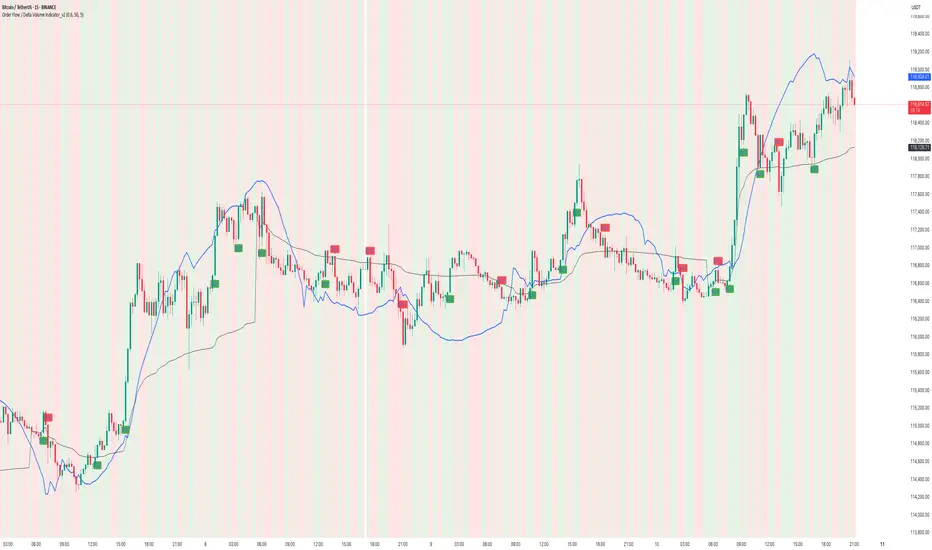
How to use Order Flow / Delta Volume Indicator for IntradayWhat you’re seeing
This idea visualizes an intraday session with my Order Flow / Delta Volume study applied. The chart overlays three things that matter for short-term context:
• Cumulative delta (blue line) : running sum of delta, rescaled so it’s easy to compare to price swings.
• VWAP (grey line) : session anchor for bias and mean-reversion context.
Signal logic (kept simple & rule-based)
A bar is considered imbalanced when one side’s volume dominates the bar’s total volume.
• Imbalance: upVol / totalVol > 0.60 → buy-side imbalance; downVol / totalVol > 0.60 → sell-side imbalance.
• Trend/strength filters (optional but enabled here):
• VWAP filter → longs only when price > VWAP; shorts only when price < VWAP.
• RSI(14) filter → longs only if RSI > 50; shorts only if RSI < 50.
• Noise throttle: minimum 5 bars between signals + price must exceed the prior close by ±ATR(14) to avoid tiny wiggles.
These rules try to capture moments when flow (delta) and context (VWAP/RSI) line up, while the ATR and cooldown help skip low-quality, back-to-back prints.
How to read the chart
• Rising blue cumulative-delta with price above VWAP → constructive backdrop for longs; fading/ranging delta warns to de-risk or wait.
• Green “ BUY ” labels plot when a buy-side imbalance clears the filters; red “ SELL ” labels mark sell-side imbalances with bearish context.
• Background tints briefly highlight where the raw imbalance occurred (light green/red), even when a trade filter blocks a signal.
Walk-through of the attached example
• Trend leg after a base: cumulative delta turns up first and price reclaims VWAP → several filtered BUY signals print into the push; ATR gate avoids chasing the very first small upticks.
• Mid-session chop: delta flips around the zero line and price hovers near VWAP → far fewer signals; most imbalances are filtered out by RSI/VWAP or fail the ATR move requirement.
• Late expansion: a swift VWAP reclaim with strong positive delta → clustered BUY signals that track the follow-through, while opposing sell imbalances near VWAP are rejected by filters.
Inputs used on this chart
• Imbalance threshold: 0.60
• VWAP filter: On
• RSI filter: On, threshold 50
• Cooldown: 5 bars
• ATR length: 14
Notes
• This is not a trade recommendation. Signals highlight where participation leans, not certainty of direction.
• Best paired with your execution plan (risk unit, stop location, partials near prior S/R or VWAP).
• In fast spikes, delta can be extreme—ATR and the cooldown help, but slippage and whipsaws are always possible.
• For instruments with very low volume or during illiquid hours, consider raising the imbalance threshold or disabling signals altogether.
Takeaway
Order-flow imbalance by itself fires often; layering VWAP, RSI, and an ATR-based movement check concentrates signals to moments when both flow and context align. The attached session shows that behavior clearly: fewer prints in chop, more conviction when cumulative delta trends and price holds its side of VWAP.
Educational post for discussion only. No financial advice.
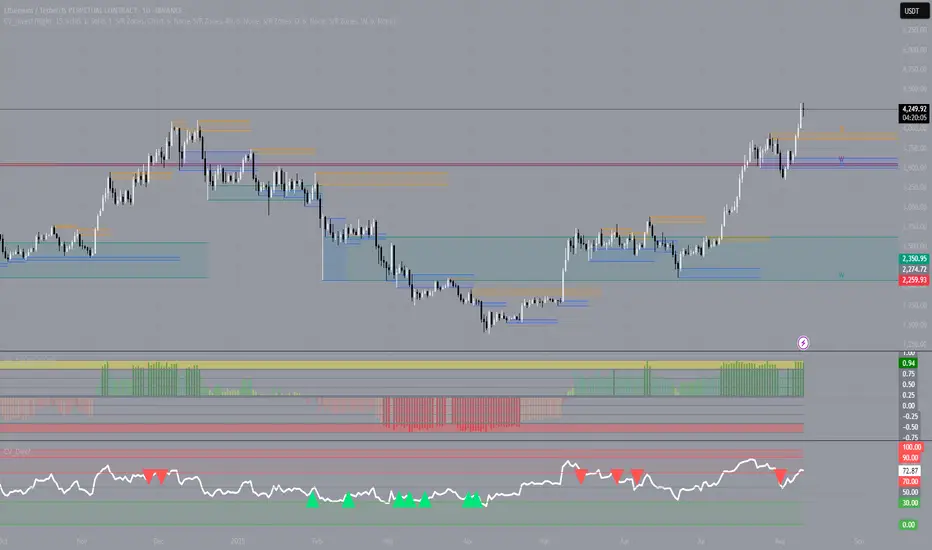
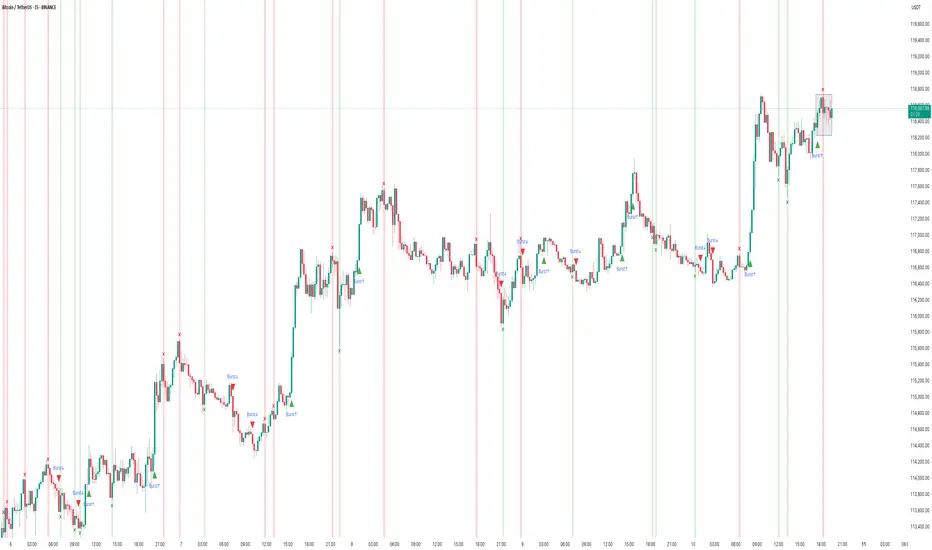
How the PCCE + False Breakout Detector Performed in BTCChart: BTC/USDT (15m – BINANCE)
Tool Used: PCCE + False Breakout Detector
Type: Educational – How to interpret breakout and trap detection.
🟢 What the Indicator Does:
The PCCE + False Breakout Detector blends two core functions:
1. Price Coil Compression & Expansion (PCCE): Finds tight volatility compression zones and signals when price bursts out with strength (Burst↑ or Burst↓).
2. False Breakout Detection: Flags bull and bear traps when breakout moves fail to hold beyond recent swing levels.
This pairing gives a setup phase (compression), a confirmation phase (burst), and a risk filter (trap detection).
✅ Recent Performance Highlights:
📈 Early Session:
• Several Burst↑ and Burst↓ signals emerged during small compression ranges.
• A Burst↑ around 06:00 marked the start of a steady climb, confirming breakout alignment with volume/trend filters.
📉 Mid Session:
• A Burst↓ appeared, but price quickly reversed upward.
• The reversal was flagged as a bear trap (green ❌), warning traders of a failed breakdown.
📈 Late Session Rally:
• Around 15:00, a compression zone formed before a strong upward move.
• The breakout printed a Burst↑ and continued into a multi-hundred-dollar rally.
• Shortly after, a bull trap (red ❌) was flagged at the top — price stalled and pulled back within minutes.
🔍 Interpretation:
• Burst↑/↓ = Entry cues from high-probability volatility expansions.
• ❌ markers = Real-time warnings that a breakout may fail, helping avoid false momentum plays.
• Combined Effect : Captures early move potential while filtering risky breakouts.
⸻
📚 How to Apply in Trading:
1. Mark coil zones and prepare for potential expansion.
2. Confirm breakouts with Burst signals and, optionally, trend/volume filters.
3. Heed trap markers — they often precede reversals or consolidation.
4. Pair with higher-timeframe analysis for trend bias.
About Dax 40 CFDTime is approaching for a correction. We have clear price action support levels. According to Larry Williams' principle, I believe that the end of the correction will be around the end of September.
