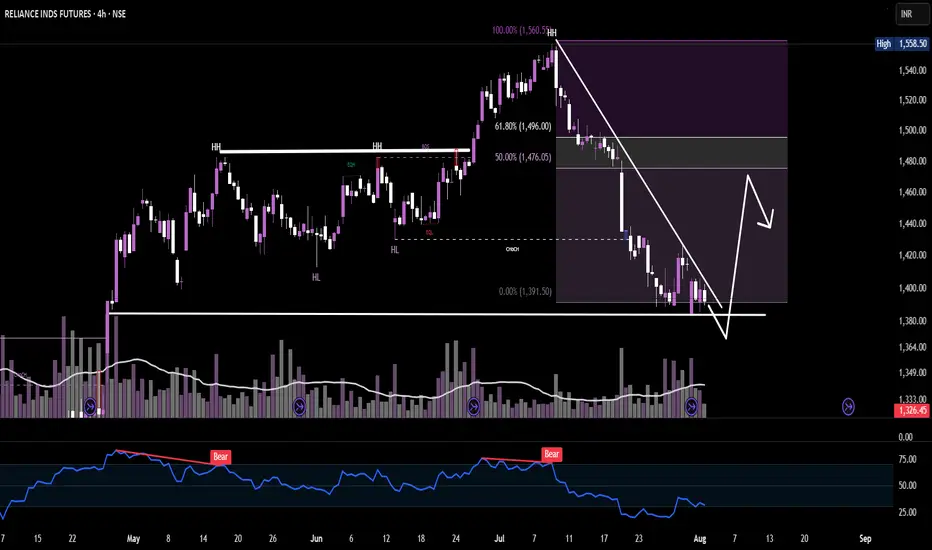
Reliance Futures: Bearish Rally or Relief Bounce Ahead?💬 What’s your take — bounce & dump? Or trend shift incoming?
Type “Bearish bounce” if you see a short setup coming.
Contains IO script
Visa UpsideWe're approaching what I believe is max pain at $435 after impressive earnings from Visa. I think the upside is very much on here

HOW TO Spot Liquidity-Driven Reversals & Market TrapsAdaptive Liquidity Pulse
🎯 Spot Liquidity-Driven Reversals & Market Traps
The Adaptive Liquidity Pulse is designed to help traders detect high-volume rejections and absorptions, revealing where big players are likely defending or accumulating positions. This indicator is especially useful for spotting market traps, liquidity sweeps, and swing reversals.
⸻
🧠 How It Works
1. Dynamic Liquidity Zones
• Red Band (High EMA) → Potential supply/rejection zone
• Blue Band (Mid EMA) → Equilibrium / magnet zone
• Green Band (Low EMA) → Potential demand/absorption zone
2. Signal Labels
• 🔴 Rejection → Price spikes into high liquidity with volume → Bearish bias
• 🟢 Absorption → Price flushes into low liquidity with volume → Bullish bias
3. Volume-Weighted Detection
• Only triggers signals when volume exceeds a configurable threshold
• Filters out weak moves, highlighting true liquidity events
⸻
📊 Best Use Cases
• Scalping & Intraday Trading: Identify early reversal points
• Swing Trading: Track absorption/rejection cycles to time entries/exits
• Liquidity Sweep Detection: Spot where false breakouts occur with volume confirmation
⸻
⚡ Trading Tips
• Use Rejection (Red) for short entries or take-profits near highs
• Use Absorption (Green) for long entries or short exits near lows
• Combine with support/resistance zones or trend structure for higher accuracy
• Midline (Blue) often acts as a mean-reversion magnet in ranging markets
⸻
📢 Alerts
• 🔴 Rejection Alert → Strong selling pressure at liquidity zone
• 🟢 Absorption Alert → Heavy buying at demand zone
⸻
🧠 Why Traders Love It
• ✅ Visualizes hidden liquidity interactions
• ✅ Highlights trap zones before reversals occur
• ✅ Works across crypto, indices, forex, and commodities
• ✅ Designed for confluence with other strategies
⸻
This script gives you a real-time pulse of liquidity shifts, allowing you to trade like institutions and avoid falling into retail traps.
⸻
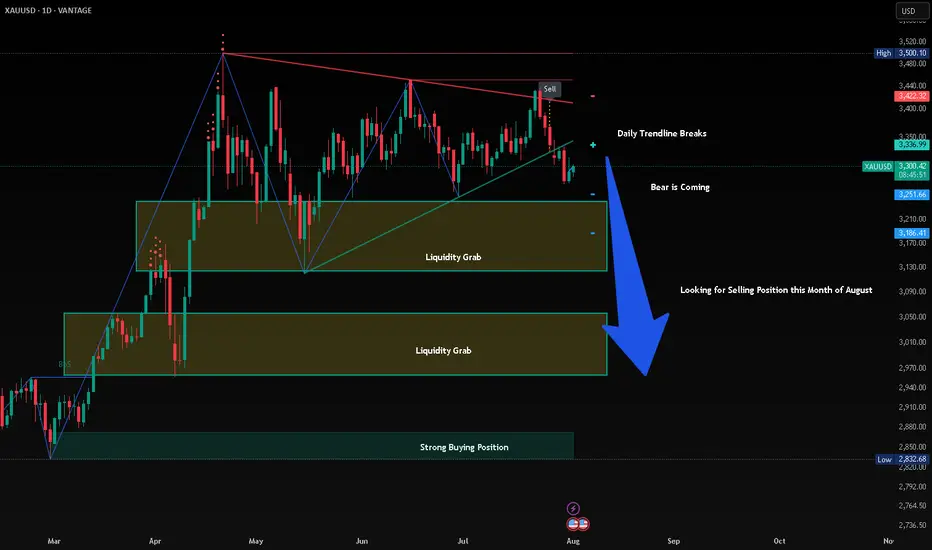
Bearish Sentiment For GoldGold breaks daily trendline leaving a bearish engulfing pattern last Wednesday July 30, Expecting the price go down for correction. In my opinion, Gold will be BEARISH this coming August up to October. This is just my theory.
BTC in a Sideways MovementBTC in a Sideways Movement: When the Market Froze, Psychology Starts to Fail
Honestly, this is one of the most difficult stages in the market - uncertainty without a clear direction. Bitcoin gets stuck between levels, giving false breakouts and immediately rolling back. It seems that something serious is about to happen, but in reality, nothing happens.
This kind of price movement often leads to emotional burnout of traders. Some start entering trades blindly, just to stay in the market. Others suffer a series of small losses, trying to guess the breakout. And some just close the charts, unable to cope with the silence.
The reality is that markets get tired too, especially after big moves. What we are seeing now with BTC is probably just a rebalancing phase. And that's okay. If there is no clear pattern, then this is not your trade.
For now, I am just watching, marking the boundaries of the range and waiting. For myself, I highlight the order block for 1D as zones of interest, I wait for a reaction from it and will look for a model to enter a position.
Any breakthrough, confirmed by volume and subsequent movement - that's when the next real movement will begin.
The main thing is not to waste energy in vain. Sideways movement is not eternal. After silence, movement always comes.

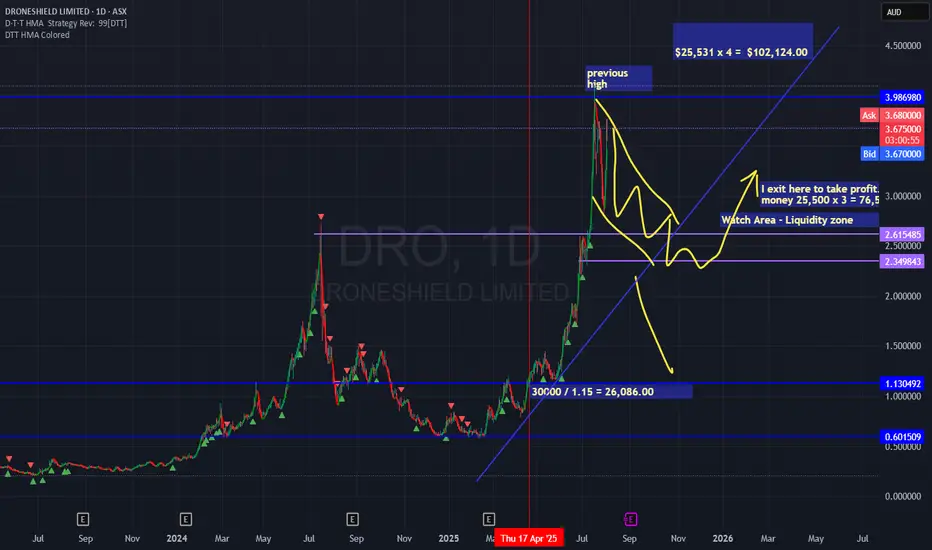
Dronesheild flagDRO is forming higher high and higher low.
the price significantly fly and move so far in such away that it cannot stop
however like anything it has its end.
this DRO will now form a flag.
This is the anonymity and uncertainty of the DRO in the future but it will be fueled with war again once its broke out.
Be ready and Prepared and always look on the higher time frame
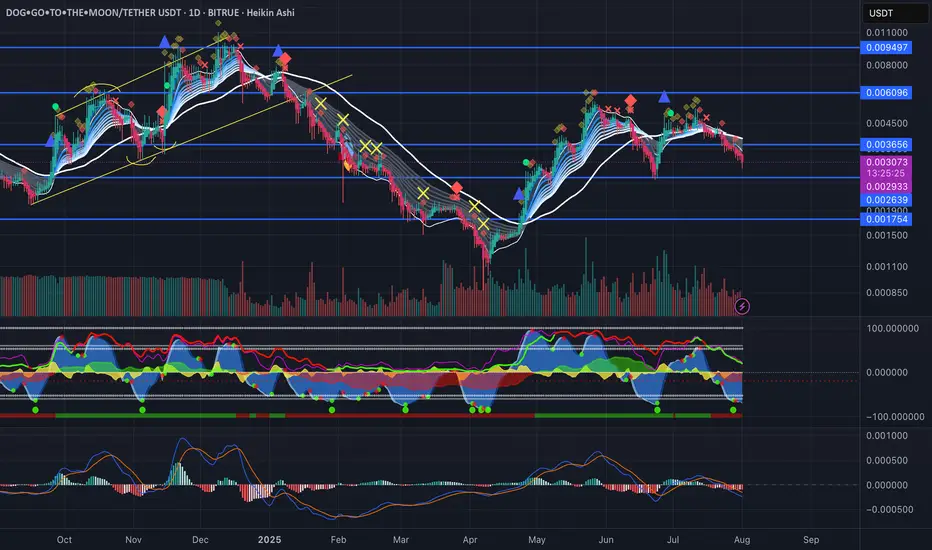
DOGSeems like we getting a cool down going into August. More sideways CHOP ahead nothing new. HODL the line..

XAUUSD GOLD The XAUUSD Gold price is approaching our target zone, where it will find strong support in EMA 100 if it does not comply with LSOB in small timeframes. In the 4H timeframe, the price has been making lower lows so far, so I recommend waiting a little and entering based on the daily timeframe from the lower zone.

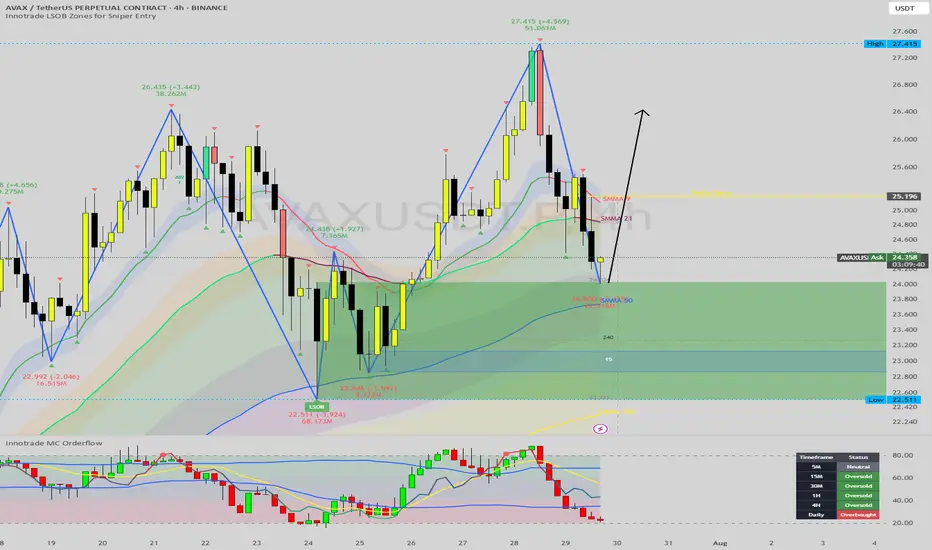
AVAX at the Golden Pocket: A High-Confluence Long Setup EmergesHello, traders. Today, we're analyzing Avalanche (AVAX), which has undergone a healthy and necessary correction after a powerful impulsive move upwards. Price has now pulled back to a critical decision point that is loaded with a confluence of technical support signals.
This analysis will break down, step-by-step, why the current price zone represents a high-probability area for a bullish reversal, potentially kicking off the next major leg up. This is an educational walkthrough demonstrating how to stack technical factors to build a strong trade thesis.
The Analysis: Stacking the Technical Confluences
A high-probability trade is rarely based on a single signal. It's built on multiple, independent factors all pointing in the same direction. Here is the confluence we are seeing on the AVAX 4H chart:
1. The Bullish Market Structure:
First, the context. The overarching trend for AVAX is clearly bullish. Our Zig-Zag indicator confirms a strong pattern of higher highs and higher lows. The current dip is, therefore, considered a corrective pullback within a larger uptrend, meaning we should be looking for buying opportunities, not fighting the trend.
2. The Golden Pocket (Fibonacci Retracement):
We've drawn a Fibonacci retracement from the beginning of the last impulsive leg up (
22.54)
Price has now pulled back precisely into the "golden pocket" between the 61.8% and 78.6% levels. This zone is a classic, high-probability area for trend continuation entries, as it often represents a point of equilibrium before the dominant trend resumes.
3. The Bullish LSOB (Liquidity Sweep Order Block):
The most significant signal in this area is the large green LSOB zone. This institutional footprint was formed after a sweep of a prior low and represents a major area of buying interest. The fact that the golden pocket lies directly within this LSOB provides a powerful layer of confirmation. Price has now entered this zone, effectively mitigating the imbalance and reaching a key area of demand.
4. Dynamic & Static Support Confluence:
Octo MA: The EMA 100 is flowing directly through the LSOB, providing a strong layer of dynamic support.
Daily Open: The Daily Open is situated just above, acting as an initial magnet and a potential first target for a bounce from this zone.
5. Momentum Exhaustion (Oscillator Analysis):
This is the final, critical piece of the puzzle. Our MC Orderflow oscillator in the sub-chart shows that selling momentum is deeply exhausted, with the lines pushing into the green oversold territory.
Critically, the Dashboard confirms this across multiple timeframes (5M, 15M, 30M, 1H, and 4H are all flashing "Oversold"). This is a powerful signal that sellers are losing control and the market is primed for a reversal, providing excellent timing for a potential entry.
The Potential Trade Plan
Based on this strong confluence, here is a potential trade plan:
Entry Zone: The current area between $23.50 and $24.80 (the LSOB / Golden Pocket) is the ideal entry zone.
Stop Loss: A logical stop loss can be placed just below the low of the LSOB and the 100% Fibonacci level, around $22.40. This invalidates the entire setup if hit.
Potential Targets:
Target 1: The Daily Open / 38.2% Fib level at ~$25.40.
Target 2: A retest of the recent swing high at $27.41.
Target 3 (Extension): If the trend resumes with strength, longer-term targets can be found at the 127.2% or 161.8% Fibonacci extension levels.
Conclusion
We have a powerful alignment of bullish market structure, a golden pocket retracement, a major institutional LSOB zone, dynamic MA support, and clear momentum exhaustion. This stack of confluences presents a compelling case for a long position on AVAX.
Disclaimer:
This content is for educational purposes only and does not constitute financial or investment advice. Trading carries a high level of risk. Please do your own research and consult with a professional financial advisor before making any investment decisions. You are solely responsible for any trades you take.
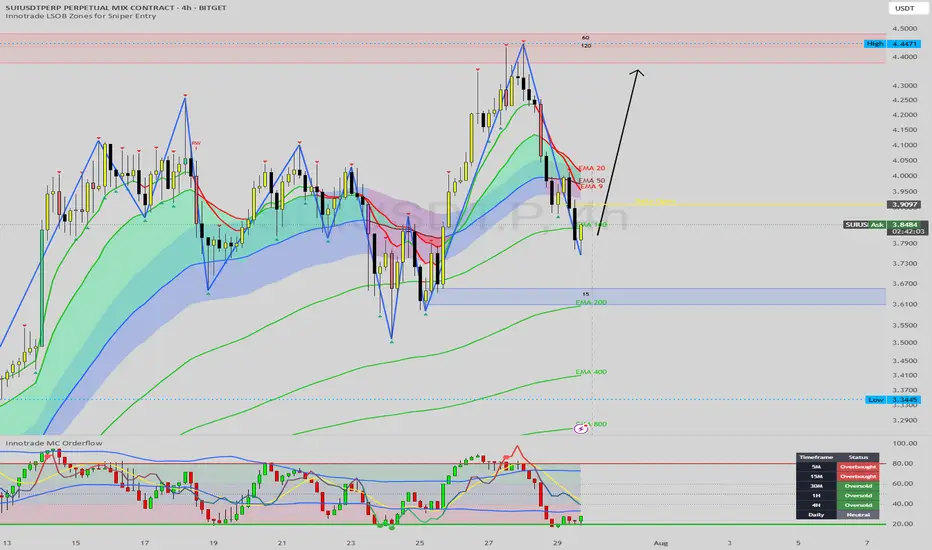
SUI Approaching Major Buy Zone: A High-Confluence Long SetupHello, traders. Today, we're putting SUI under the microscope as it undergoes a sharp but healthy correction following an impressive rally. The price has recently broken below its short-term moving averages, and is now heading directly towards a powerful cluster of technical support. This is a classic "buy the dip" scenario unfolding.
This analysis will provide a step-by-step breakdown of why the $3.60 - $3.70 zone represents a high-probability area for this corrective move to end, and for the primary bullish trend to resume.
The Analysis: A Convergence of Powerful Signals
The strongest trade ideas are not based on one signal, but on multiple, independent factors aligning. Here is the powerful confluence we are observing on the SUI 4H chart:
1. The Primary Bullish Structure:
First, let's establish the market context. The Zig-Zag indicator confirms that the primary market structure is firmly bullish, with a clear series of higher highs and higher lows. The current move is a textbook corrective pullback within this uptrend. Our goal is not to fight the trend but to identify the most logical point for it to continue.
2. The Key Support Cluster (Order Block + EMA 200):
The price is approaching a major floor of support. This floor is composed of two critical elements:
Demand Zone / Order Block: There is a significant demand zone (the blue-shaded box) sitting between $3.60 and $3.70. This is an area where strong buying pressure previously entered the market, and it's likely to act as a solid support level.
The EMA 200: Flowing directly through this demand zone is the EMA 200. This long-term moving average is one of the most significant dynamic support levels in an uptrend. The confluence of a static order block with the powerful EMA 200 creates an incredibly strong support cluster.
3. Multi-Timeframe Momentum Exhaustion (The Key Timing Signal):
This is the crucial timing component. While the price is dropping, our momentum dashboard reveals that sellers are becoming exhausted.
MC Orderflow: The oscillator in the sub-chart is plunging towards the green "Oversold" area, signaling that the downward momentum is getting stretched.
The Dashboard: This gives us a panoramic view of momentum. The 30M, 1H, and 4H timeframes are all simultaneously flashing "Oversold". This is a critical piece of information. It tells us that selling pressure is exhausted across multiple key timeframes, precisely as the price is about to hit a major support cluster. This is a classic recipe for a sharp reversal.
The Potential Trade Plan
Based on this powerful alignment of signals, here is a potential trade plan:
Entry Zone: The support cluster between $3.60 and $3.70 is the ideal zone to look for entries.
Stop Loss: A logical stop loss could be placed just below the demand zone and the EMA 200, around $3.55. A break below this level would invalidate the bullish structure.
Potential Targets:
Target 1: A reclaim of the Daily Open at $3.91.
Target 2: The intermediate resistance and recent swing high in the $4.15 - $4.25 area.
Target 3: A full retest of the major high at $4.45.
Conclusion
We are witnessing a textbook technical setup on SUI. The price is correcting within a confirmed uptrend and is now approaching a massive confluence of support (Order Block + EMA 200), all while multi-timeframe momentum indicators are signaling widespread seller exhaustion. This presents a compelling, high-probability case for a long position.
Disclaimer:
This analysis is for educational purposes only and is not financial advice. Trading cryptocurrencies involves a high level of risk. Always conduct your own research and consult with a licensed financial advisor before making any trading decisions.
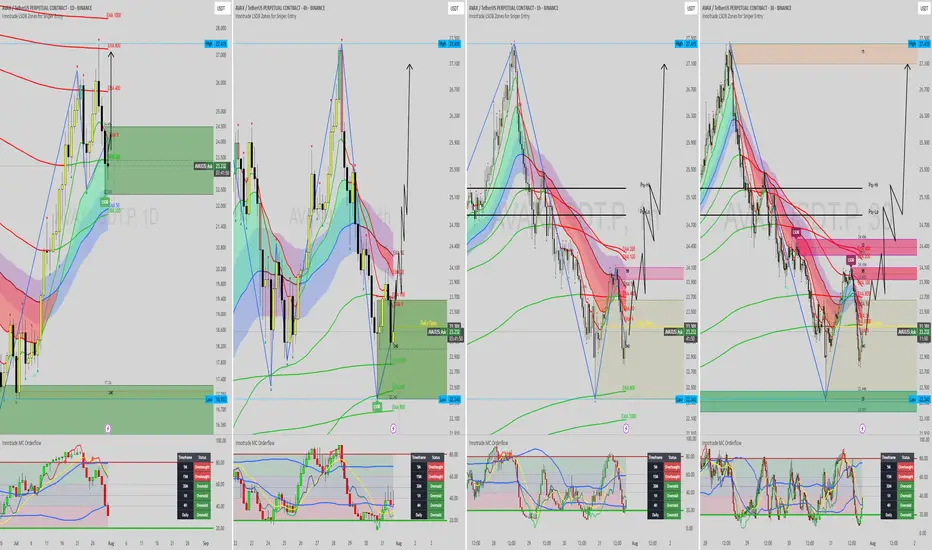
AVAX Update - Second Chance for a Long positionAVAX left Bullish-FVG behind. It's normal that price comes back to take it's FVG. Long setup is in tact.
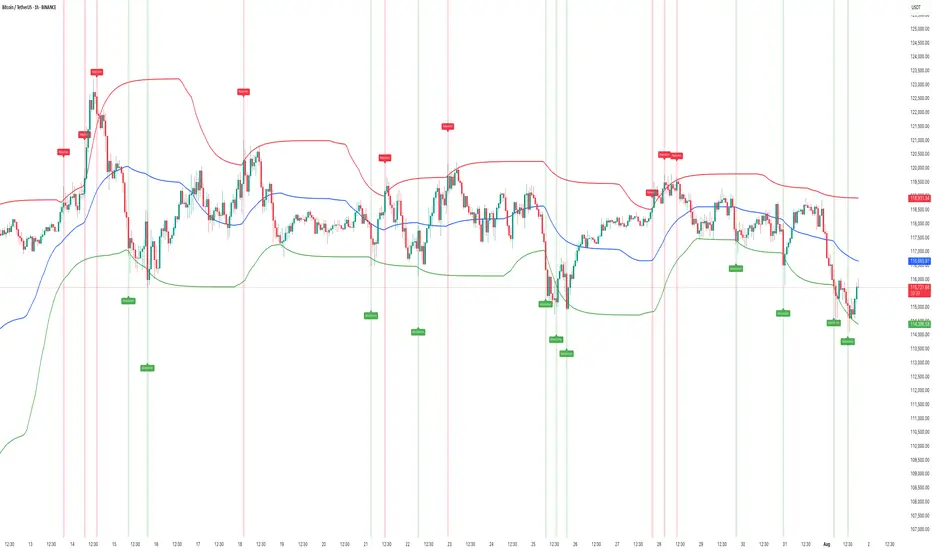
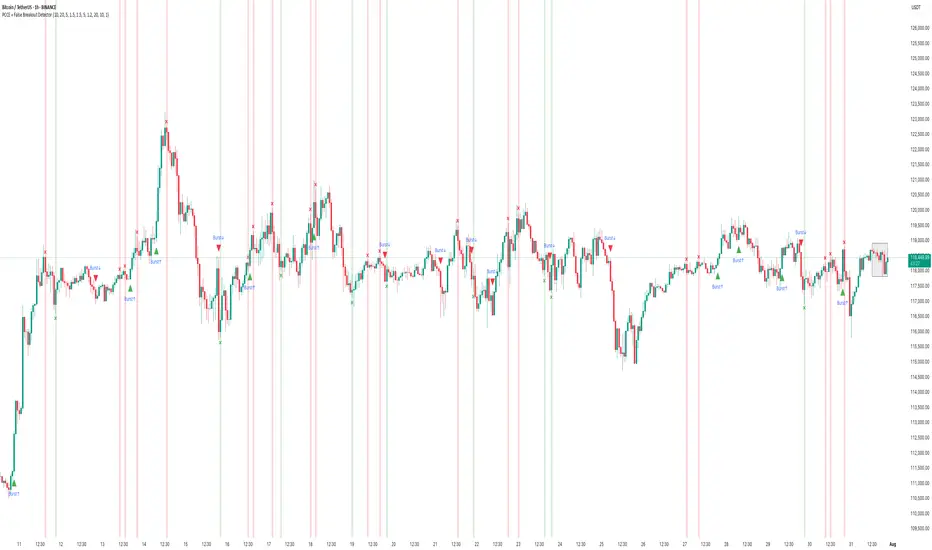
How to Use the PCCE + False Breakout DetectorHow to Use the PCCE + False Breakout Detector to Catch Trap Zones in BTC
Chart: BTC/USDT (1H)
Tool Used: PCCE + False Breakout Detector
Type: Educational – How to identify false breakouts and anticipate trend shifts.
⸻
🧠 What the Indicator Does:
The PCCE + False Breakout Detector is designed to identify breakouts from coiling ranges and filter out trap moves that often fool traders.
🔹 Burst↑ / Burst↓: Valid breakout from a price coil with volume and trend alignment
🔻 Red X: Marks a bull trap — breakout failed and price reversed lower
🟢 Green X: Marks a bear trap — breakdown failed and price reversed higher
By flagging where breakout structure fails, the indicator helps traders avoid false entries and position early for reversals.
⸻
✅ Recent Performance Highlights (BTCUSDT 1H):
📈 From July 13–31:
• Burst↑ on July 13 led to a clean uptrend (+$1,500 gain)
• Red X on July 16 called a failed breakout — price dropped hard
• Green X on July 16 caught the bear trap — price reversed immediately
• Burst↓ on July 21 triggered a sharp decline, validating breakdown
• Red X on July 30 spotted the bull trap just before price reversed down
📉 Even in sideways ranges, Red/Green Xs signaled when the move lacked conviction, allowing traders to wait instead of chasing noise.
⸻
🔍 Current Interpretation:
• BTC is trading inside a choppy structure after a recent Burst↑ and Red X combo.
• The X mark zone (gray box) warns of instability — bulls attempted a breakout but failed.
• If price continues to stay below the Red X high → likely retracement ahead.
• If we see a Green X + rally soon → potential reversal setup in progress.
⸻
📚 How-To Use the Indicator:
1. Burst Signals (Breakouts)
🔸 Use these to enter when coil compression breaks with volume
🔸 Works best when aligned with EMA trend and breakout body
2. Red / Green X (False Breakout Detector)
❌ Red X: Price spiked above resistance but lacked follow-through → trap
✅ Green X: Price dipped below support but got bought → trap
3. Confirm with Price Context
🔄 Look for reaction candles after X marks
📏 Set tighter stops — traps often reverse fast
🔔 Combine with your S/R zones or order block theory
⸻
🧠 Final Thoughts:
The PCCE + False Breakout Detector isn’t just about spotting momentum — it’s about reading intent vs. failure in price action.
BTC’s current structure shows signs of indecision. Trust the Xs to tell you whether the move has legs — or is just another trap.
🎯 Learn to trade the trap, not fall into it.
DXY USDOLLAR CRASH Incoming!Long-term fundamentals are bearish
Long-term sentiment = bearish
Long-term technicals = bearish
Trump wants a weaker dollar + FED injecting endless amounts of cash into the markets
driving stocks/ gold up, and the dollar down, losing purchasing power.
My plan is to look for shorts on the 1hr-4hr timeframe with lower timeframe confirmation.
Once price starts turning over, day-traders can join in.
Agree or disagree?

Full review of my NY basket and trading ideas for todayFull analysis and trading ideas for todays NY session for DXY, Silver, Gold, WTI, NAS, S&P, DJ30

Fartcoin Hello Traders,
After major Pullback, Fartcoin gives a Chance to Enter for the Long Setup in illustrated Price Level.
Take Profit will be at Swing High of the Order block. You can also take partially TP in minor swing highs.
Disclaimer
This trading setup is provided for educational purposes only and does not constitute financial advice. Trading involves significant risk, and past performance is not indicative of future results. Users should conduct their own research and consult with a qualified financial advisor before making any investment decisions. xAI and its affiliates are not liable for any losses incurred from using this information.

LtcLtc lproject looks promising
Solid owners who define the true value of crypto
I don’t see any reason this turns bearish anytime soon

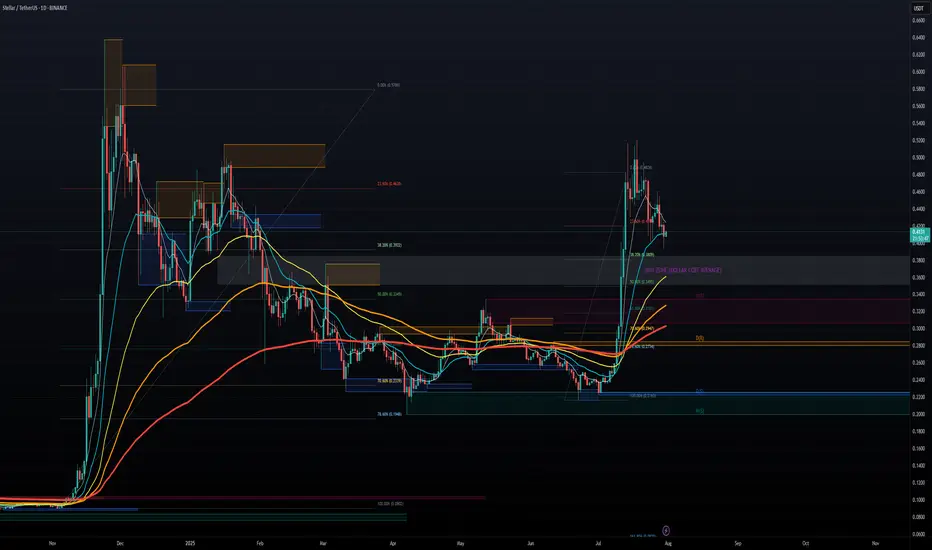
STELLAR LUMENS - DOLLAR COST AVERAGE FOR LONG TERM GAINSSTELLAR LUMENS (XLM) has taken off late 2024 from under .10 cents and now trading at .40 cents for a 400% Gain in 6 months so far, and there is much more upside to come potentially. It hit all time highs around .50 cents and now the token seems to want to test those highs in the near term 2025, we can easily see XLM approach $1.00 towards 2026 for a 100% gain and even higher longer term. Overall, XLM moves with XRP and we all know XRP is a blue chip project, it has all the funds and institutional backing, and so does XLM.
Both projects share a common creator in Jed McCaleb, however they have different focuses. Ripple, and its native token XRP, was initially designed to facilitate cross-border payments for financial institutions. Stellar, on the other hand, focuses on financial inclusion and aims to provide accessible financial services for individuals, including remittances and access to banking services.
CAN WE SAY BULLISH?! TO THE MOON!!!
A look at a CPR strategy using monthly CPRA look at a CPR strategy using monthly CPR - Using conditions to enter and move SL

DXY still in downward channel. Rejection here = BTC rally The DXY is still in a downward sloping channel and trying to break back above the previous 2-year cycle low, but I think will reject here and kick off the next leg of the BTC rally.
Ideally we get a big DXY drop and ultimately break below the 95% level and on down into 'Bitcoin Super Rally Zone'🚀

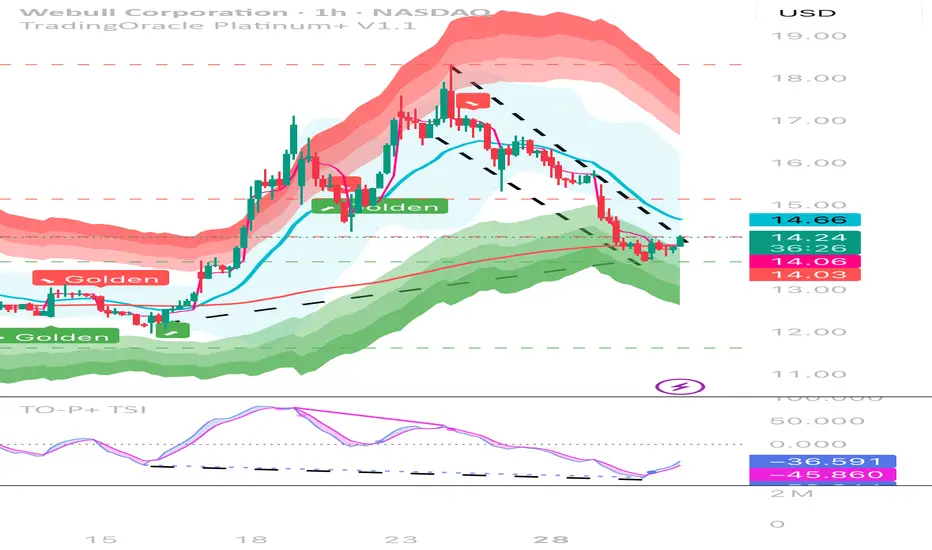
Hidden Bullish Divergence Bull is in a falling wedge patter while also making lower lows on the 1hr while making higher lows on the true strength index indicator. It is also bouncing off the 200ma, the bottom bollinger band, and the first reversal zone.
Cello has bottomed out and will move upsideCello According to wave analysis has bottomed out and can give good risk reward from here
Buy At 590 to 600 range
sl 564
target 700

NZDCAD; Heikin Ashi Trade IdeaIn this video, I’ll be sharing my analysis of NZDCAD, using FXAN's proprietary algo indicators with my unique Heikin Ashi strategy. I’ll walk you through the reasoning behind my trade setup and highlight key areas where I’m anticipating potential opportunities.
I’m always happy to receive any feedback.
Like, share and comment! ❤️
Thank you for watching my videos! 🙏
