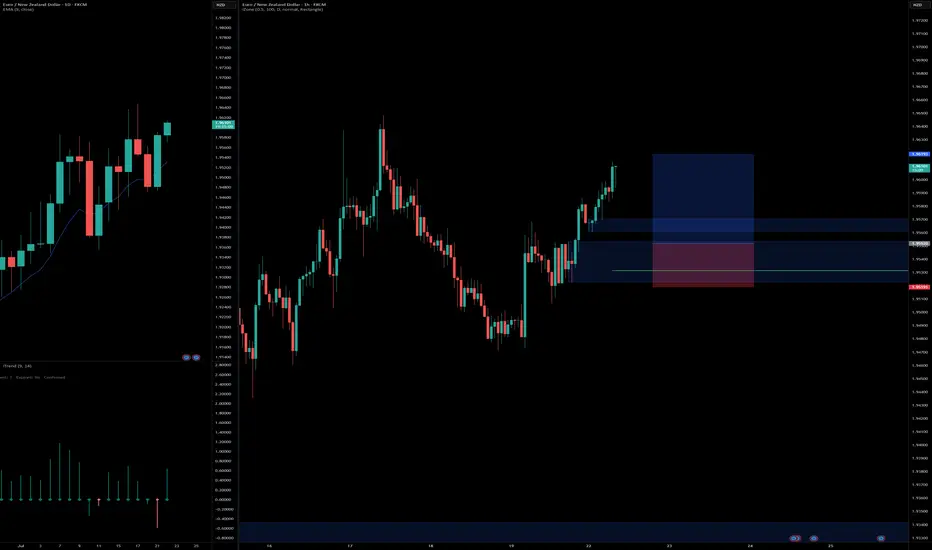
EURNZD long setupBuying from fresh demand zone after bullish structure break.
Daily showing strong momentum, 1H confirms continuation with clean break and retest zone.
📍Entry: Demand zone
🎯 Target: 2R
🛑 SL: Below demand zone
Risk-Reward: Favorable setup aligning with higher timeframe bias.
#trading #forextrading #EURNZD #priceaction #smartmoney #demandzone #tradingsetup #forexanalysis
Contains IO script
$EXOD position buildingIf it holds, solid flip of support and EMA bands (including 200d), we see higher!
Still weary of PA potentially taking out supports below. If this happens, adding position.

HOW-TO: Auto Harmonic Screener - UltimateXHello Everyone,
In this video, we have discussed on how to use our new Auto Harmonic Screener - UltimateX. We have covered the following topics.
Difference between Auto Harmonic Screener - UltimateX (Current script) and Auto Harmonic Pattern - UltimateX and how to use both the scripts together
Difference between Auto Harmonic Screener - UltimateX (Current script) and the existing screener Auto Harmonic Pattern - Screener which is built on request.security calls. We have discussed how the limitations of old script and how using the new script with Pine screener utility will help overcome those problems.
We have gone through the indicator settings (which are almost similar to that of Auto Harmonic Pattern UltimateX
Short demo on how to use the script with Pine Screener
Also check our existing video on How to use the new Pine Screener Utility.

Very simple strat using 15min and 90 min PARVery simple strat using 15min and 90 min PAR. Mainly for scalping trades takling 1-6 hrs

ETH: Huge Reversal or Correction Still in the Horizon?The recent price action in Ethereum (ETH) has left market participants questioning its next major move. With volatility high and sentiment shifting, is ETH headed for a massive reversal, or is a correction still looming on the horizon?
Key Points to Consider
Macro Environment: Global markets are facing uncertainty from shifting interest rates and regulatory developments in crypto. These factors may spark continued volatility for ETH in the near term.
Technical Analysis: ETH has many analysts watching key support and resistance areas. A clean break above resistance could signal a reversal, while a failure to hold recent gains may suggest a correction is not over yet.
On-Chain Data: Activity on the Ethereum network, including DeFi usage and staking patterns, can offer clues as to whether accumulation or distribution is taking place.
Market Sentiment: Traders remain divided, with some calling the recent bounce a bull trap, and others anticipating renewed upside momentum.
My Take
While the case for a reversal is gaining strength, the possibility of a broader correction can’t be dismissed. It’s crucial for investors to stay alert, watch the charts, and position size accordingly. I'm not longing any crypto in the short run...As for the long run, extremely BULLISH!
*not investment advice*
#Ethereum #Crypto #Investing #MarketAnalysis #Web3 #crypto #bitcoin #trading

GOLD - Lovers Elliott wave - looking strong Short/Medium termGOLD-----Daily counts indicate Excellent bullish wave structure.
Both appear to be optimistic and this stock invalidation number (S L) wave 2 low
target short / long term are already shared as per charts
correction wave leg seems completed (C)
Investing in declines is a smart move for short/ long-term players.
Buy in DIPS recommended
Long-term investors prepare for strong returns over the next two to five years.
one of best counter
Every graphic used to comprehend & LEARN & understand the theory of Elliot waves, Harmonic waves, Gann Theory, and Time theory
Every chart is for educational purposes.
We have no accountability for your profit or loss.

Keeping track of your favorite TA listsKeeping track of your favorite TA lists, with simple sub folders in your main watch list.


Potential 23% Move in TSSIThere is a high change of reversal in TSSI. This is due to a number of factors:
1. Both the 30min and 150min time frames are showing that the price is overextended to the downside on the custom Data Distribution script. (Yellow dots)
2. The custom USI script has shown a buy signal on the 30min chart. (Background changed to green)
3. There was a good reversal candle on the 30min chart.


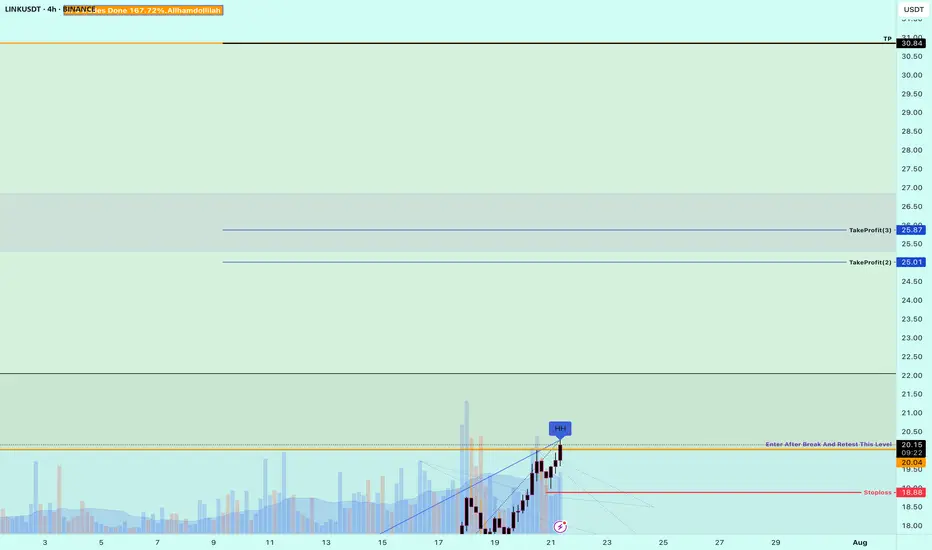
Buy Trade Strategy for LINK: Powering Smart Contracts with RealDescription:
This trading idea is centered on LINK, the native token of the Chainlink network—one of the most crucial infrastructures in the blockchain ecosystem. LINK fuels decentralized oracles that connect smart contracts with real-world data, enabling everything from DeFi platforms to insurance protocols and gaming applications. With countless integrations across blockchains and institutional partnerships, Chainlink has positioned itself as a foundational layer for Web3 development. The growing need for reliable, tamper-proof data feeds strengthens the long-term fundamentals of LINK.
That said, the crypto market remains highly speculative and volatile. The price and adoption of LINK can be significantly impacted by macroeconomic conditions, regulatory developments, and overall market sentiment. As promising as the project may be, investing in it should always be approached with caution and a solid risk management strategy.
Disclaimer:
This trading idea is provided solely for educational purposes and should not be considered financial advice. Trading cryptocurrencies like LINK involves substantial risks, including the risk of complete capital loss. Always conduct your own research, evaluate your financial situation carefully, and consult with a licensed financial advisor before making any investment decisions. Past performance is not indicative of future results.
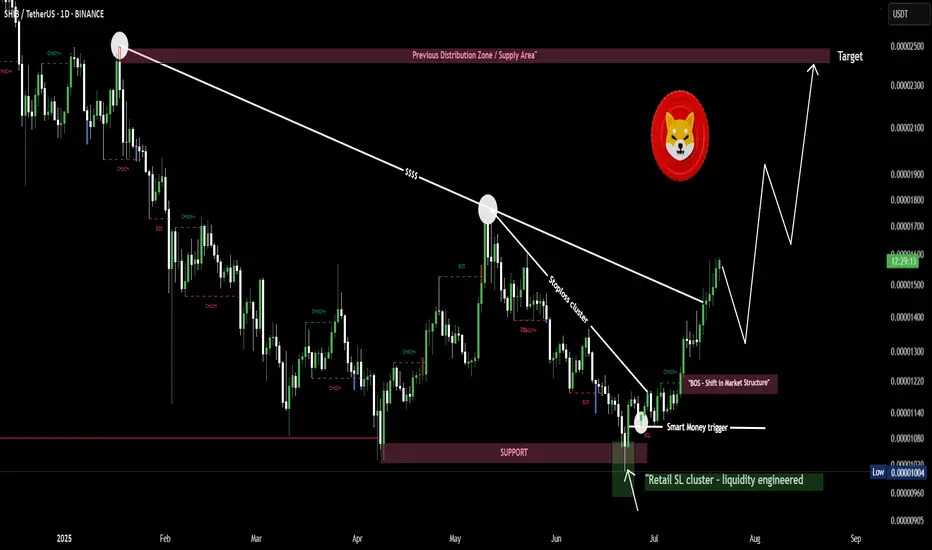
$SHIB/USDT Grabbed liquidity below key support and reversed hardSHIB just gave you a free masterclass in liquidity.
Here’s exactly what happened 👇
2/
Retail panic sold as price broke support.
That break? Engineered.
Liquidity was swept, and price instantly reversed — leaving late sellers wrecked.
3/
Smart money doesn’t chase.
They trap you first, then move the market in their direction.
SHIB is now showing momentum with clean market structure.
Next target: $0.000025🚀🚀
SHIB grabbed liquidity below key support and reversed hard
DAX / GER40: Double Long tradeGood morning traders,
I just received an alert from my LuBot Ultimate indicator of a Long signal on a good uptrend structure.
From the weekly chart I see that we are surfing on the wave of the second swing after the last bearish retracement, however on the daily the first swing has just begun after a slight minimum made in the last few days.
On the 4H this opportunity presents itself which I take advantage of in a doubly way, that is:
-I insert a trade on correction with stop at the level suggested by the indicator and TP to be defined based on the trend.
-I insert a second trade, again on correction, but with stop below the latest lows and take profit on the latest highs, the invested capital is much lower in this case in order to contain the loss but optimize any profit.
👍 If you want to see other similar posts, like/boost
🙋♂️ Remember to follow me so you don't miss my future analyses
⚠️ Disclaimer: This post is for informational purposes only and does not constitute financial advice. Always do your research before making investment decisions.
AMEX:EWG BMFBOVESPA:DAX1! FPMARKETS:GER40 PEPPERSTONE:GER40 ACTIVTRADES:GER40 XETR:DAX

I'm currently long on EUR/GBPPrice is currently reacting to a retest of an order block located within the discount zone, following a Shift in Market Structure (SMS).
Additionally, on the weekly timeframe, price is also positioned in the discount zone, aligning with a weekly order block at the same level.
Disclaimer: This is not financial advice—just my personal analysis.

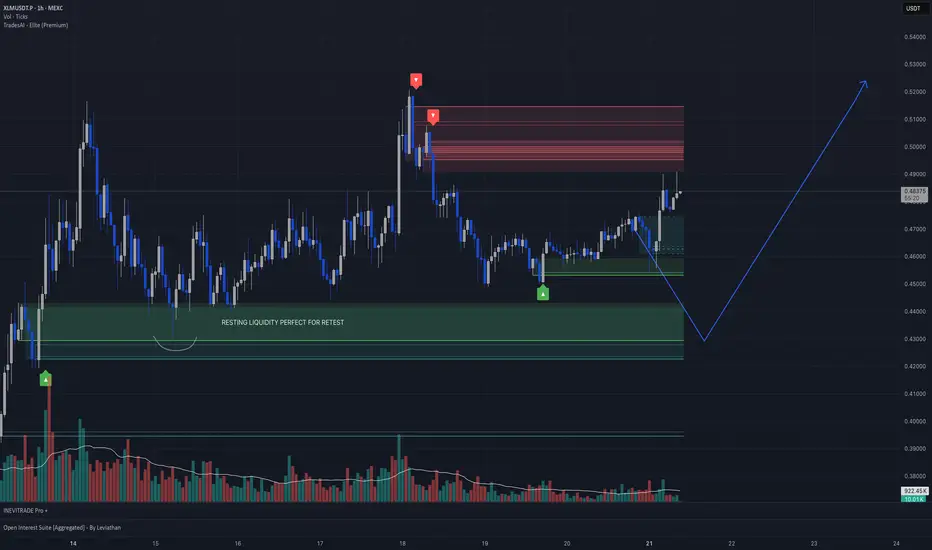
XLM/USDT 1-hour chart analysisHey everyone! Thrilled to present my first TradingView idea! Check out this XLM/USDT 1-hour chart from MEXC. I’ve identified a key “resting liquidity” zone at 0.4100–0.4200, where I expect a retest soon. The price surged from 0.4000 to 0.5200, hit resistance, and is now consolidating around 0.47388. This green zone was a consolidation area before the breakout, and with high volume at the peak dropping during the pullback, it’s a prime dip zone. If it holds, we could see a move back to 0.5200!
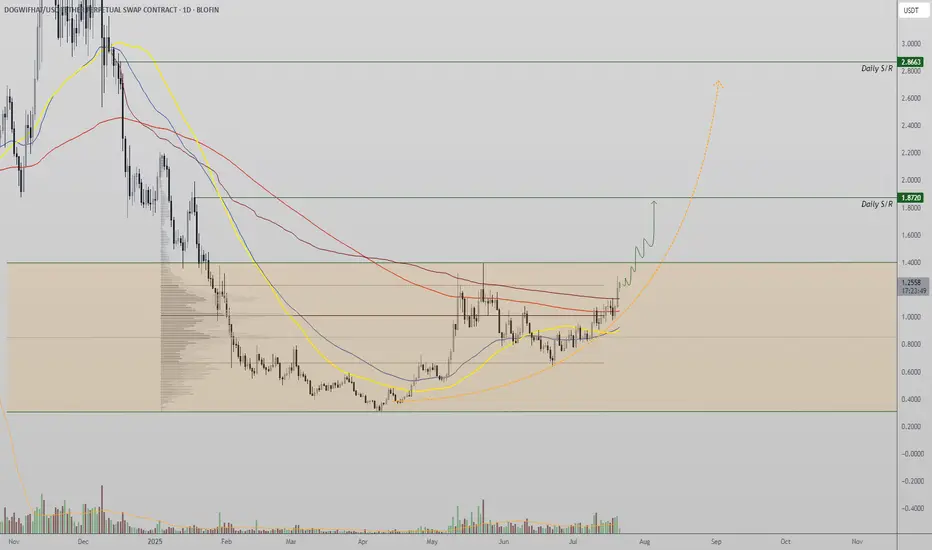
WIF Eyes Bullish Expansion as Range High NearsWIF (W-I-F) is gearing up for a potential parabolic move as it presses against key range high resistance. A confirmed breakout from this level, supported by rising volume, could trigger a bullish expansion first toward the $1.60 mark, with a secondary target of $2.60 in play.
Technically, the asset has reclaimed its 200-day moving average — a strong bullish signal that often precedes trend continuation. However, the current volume profile remains below average. For this breakout to be considered valid and sustainable, it must be accompanied by a noticeable surge in volume.
As long as price breaks above the range high with strong volume support, WIF remains poised for significant upside in the coming weeks and months. The overall structure suggests bullish continuation — but volume confirmation will be the key trigger to watch.

possible double bottom with higher lowlooking for a 1day time frame bearish breaker block. looking to enter in a bullish fvg after breaker if we get one may have to zoom into a smaller timeframe to nail entry.
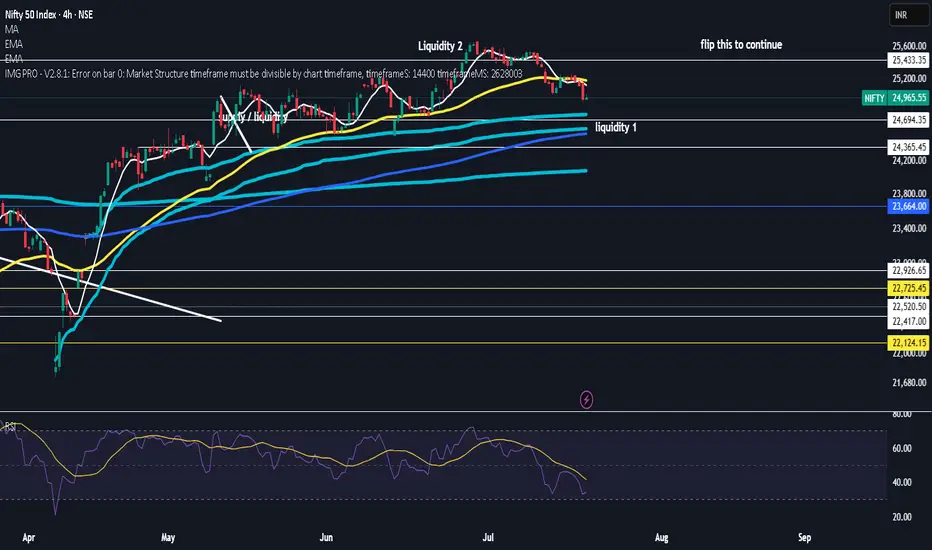
$nifty50took first liquidity and deviated back
now we take liquidty under vwap or not but good spot to reverse here
ATH incoming
rsi looks nice and reset
wont be suprized if we range here for a bit before blasting through
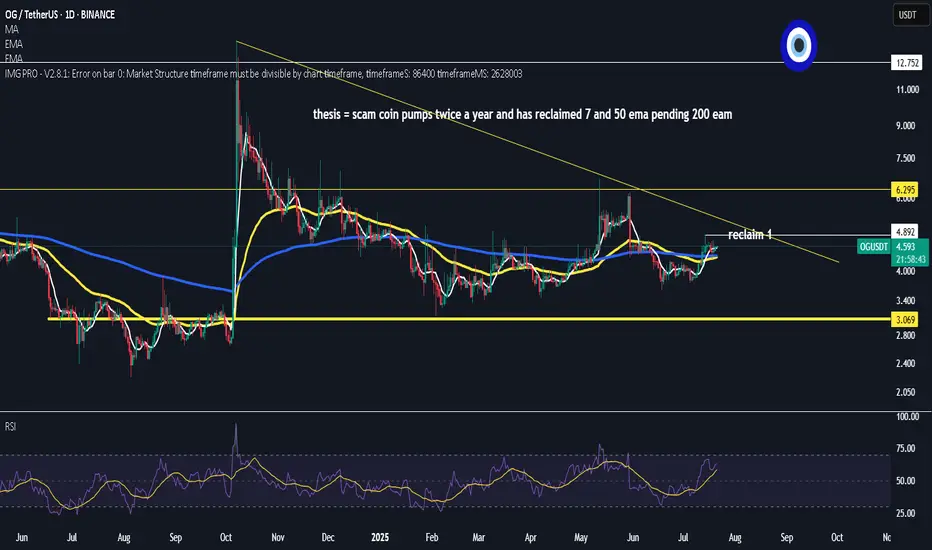
$OG fan token
scam coin as they all are till we progress as an industry and adoption picks up
for now low cap rotation play
above all ema's
50 ema 1-2 days to cross 200
golden cross
BTFD mode
using low leverage
risking $1 to make $10-$12
rsi looking nice.. dominance has some way to go down
$ELMO – Meme Coin Watchlist Alert VIE:ELMO – Meme Coin Watchlist Alert
(Not the dev / not financial advice – just sharing what I’m seeing)
Elmo has been popping up everywhere lately after going viral on X. Not gonna lie, I think this could be one of the next meme plays to keep an eye on. 🔥
A few reasons I’m watching it:
Total Supply: 294.85M — much lower than typical meme coins that flood the market with trillions. Scarcity matters when hype builds.
If it ever hit $1, that would be a ~$295M market cap — not impossible in meme territory.
Community sentiment is bullish, and it’s gaining holders fast.
Some recent attention due to the alleged X account drama, where Elmo's profile posted wild conspiracy content — added a weird but viral twist to the narrative.
⚠️ I'm not holding a huge bag — just risked a small position to see where this goes. It’s a meme coin, so it’s high risk/high reward. Could do nothing, could moon.
🔎 Just giving a heads up — do your own research if it interests you. I’ll be tracking it for a while.
DYOR
NotFinancialAdvice

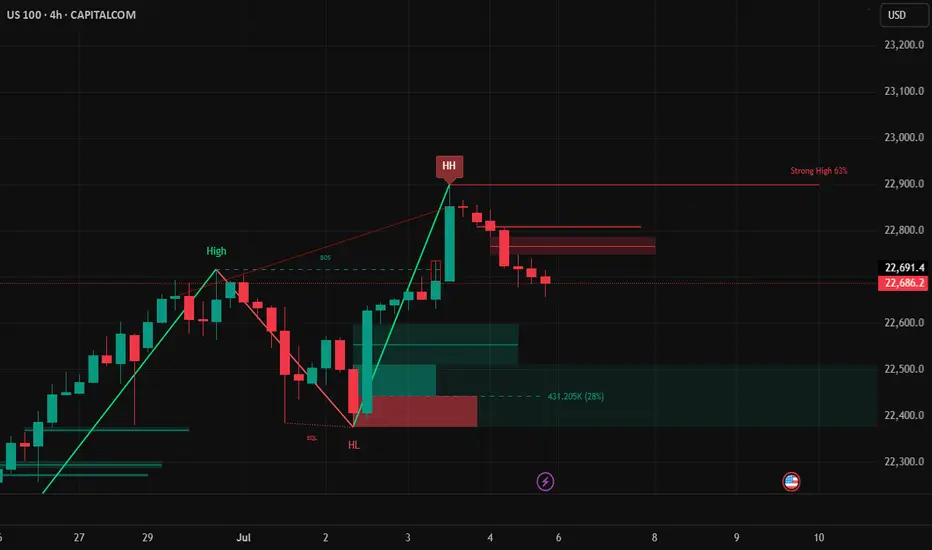
Nas Long to clear HH liquidity before correctionHTF Context – Monthly / Weekly / Daily
• Big Beautiful Bill (Trump Tax + Spending Bill)
o Passed July 4th, acting as a stimulus.
o Markets historically rally on fiscal stimulus expectations (tax cuts + spending packages).
o This fuels bullish sentiment short-term, but long-term raises debt, inflation risk, and rate hike concerns.
• Seasonality
o July is typically strong for equities, especially tech, with mid-July often marking local tops before August pullbacks.
• Monthly structure
o Strong bullish monthly candles.
o Next major fib retracements if rejected: 38.2% ~20,398, 50% ~19,625, 61.8% ~18,852.
• Weekly / Daily structure
o HH-HL sequence continues.
o Price in premium zone, approaching major supply block 23,200–23,300.
o Daily BOS not broken downwards yet.
________________________________________
Key Levels
• Major supply / liquidity magnet: 23,200–23,300 (sell-side OB in futures, uncollected liquidity above HH)
• Recent swing high: 22,900
• Daily pivot: 22,470
• Intraday demand zone: 22,450–22,350 (4H wedge base + VWAP)
• Weekly support shelf: 22,100–22,200 (if lost, major trend shift bearish)
________________________________________
My View – Most Likely Path
1. Price is likely to sweep the liquidity above recent highs into the 23,200–23,300 supply zone.
o Why? Market rarely leaves liquidity uncollected. This move traps breakout buyers and hits stops above HHs.
o Big Beautiful Bill fuels the final squeeze higher as algorithms price in fiscal stimulus.
2. After liquidity sweep above 23,200–23,300:
o Expect strong rejection from that zone.
o Institutions offload positions into trapped retail longs.
o Price pulls back towards daily and weekly support zones for reaccumulation.
3. Alternate scenario (less likely)
o Immediate sell-off from current levels without sweeping HH.
o Weak move; would still expect a revisit higher later to clear liquidity before a proper downtrend.
________________________________________
Trade Setups – Intraday & Swing
Intraday Long (Most Likely)
• Bias: Bullish continuation
• Entry Zone: 22,450–22,350 (4H demand + VWAP)
• Trigger: 5m/15m BOS up
• Stop: Below 22,300.
• Targets: First at 22,615, next at 22,845, final at 23,200–23,300.
________________________________________
Intraday Short (Countertrend / Liquidity Sweep Reversal)
• Bias: Short from supply after liquidity grab
• Entry Zone: 23,200–23,300
• Trigger: Sweep of HH with rejection wick or bearish engulfing candle
• Stop: Above 23,350 (structure invalidation).
• Targets: First at 22,845, then 22,600, extend to 22,450 if momentum accelerates.
________________________________________
Swing Long (Continuation)
• Bias: Bullish trend intact
• Entry: After retest of daily pivot (22,470) or 4H demand (22,350–22,450) with 4H CHoCH + BOS up.
• Stop: Below 22,200 (weekly support break invalidates).
• Targets: 22,845 then 23,200–23,300. Blue sky if above.
________________________________________
Swing Short (Only if structure breaks)
• Trigger: Daily close below 22,200
• Bias: Bearish trend shift
• Targets: 21,800 first, then 21,000 major fib cluster and weekly MA.
________________________________________
Summary – My Final Opinion
Price is in a strong uptrend fuelled by fiscal stimulus, rate cuts and tarrif hopes . I think it will sweep the liquidity above 23,200–23,300 before any deeper pullback or trend reversal. Any rejection from that supply zone will be the cue to short for a structural retracement. Until then, I’ll keep buying dips aligned with the HTF bullish structure.