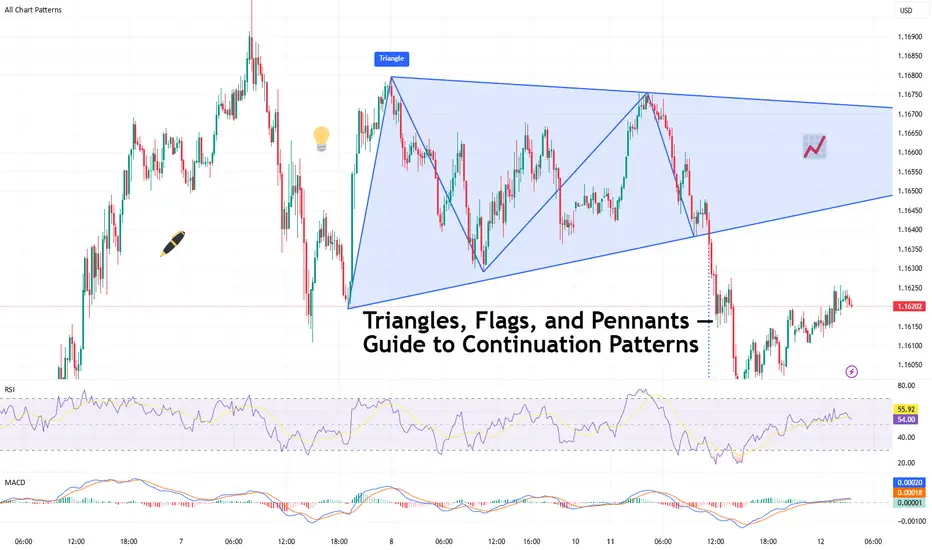
Triangles, Flags, and Pennants — Guide to Continuation PatternsChart patterns can be mysterious — until they’re not. Let’s break down the technical trio that tells you when a trend’s just taking a breather before it flexes again.
So your chart’s been pumping higher for weeks, and then… nothing. Price starts scribbling sideways. Cue panic? Maybe. But more likely, you’re staring at a continuation pattern.
Triangles, flags, and pennants are the subtle “hold my beer before I try to pull a move” signals of technical analysis. They show up when markets pause — not reverse. That pause could mean your trend is catching its breath, not dying in a ditch.
In other words: don’t close your longs just because things go quiet. Sometimes the market is just stretching before it sprints again.
⚠️ Symmetrical, Ascending, Descending
Let’s talk triangles, the Swiss Army knife of consolidation. These shapes come in three stylish varieties:
● Symmetrical triangle: Higher lows, lower highs. Traders call this the indecision pattern, but don’t get it twisted — it may just be winding up for a breakout. Wanna see how these look in practice? Dive into our community’s symmetrical triangle ideas .
● Ascending triangle: Flat top, rising bottom. Buyers are aggressive, their patience is running out. Resistance looks like it’s begging to be broken. Check the ascending triangle ideas for your viewing consideration.
● Descending triangle: Flat bottom, falling top. This one’s more bearish than your boomer uncle who knows zero about Bitcoin BITSTAMP:BTCUSD , and yes — it’s often a precursor to a breakdown. Follow the descending triangle ideas and make sure you DYOR.
Key tip : Wait for the breakout. Don’t front-run triangles unless you like volatility surprises and emotional damage.
🚩 Flags: Fast Moves, Tight Consolidations
Flags form after a sharp price move — the “flagpole” — followed by a tight, slightly sloping channel that moves against the prevailing trend. They’re short-term patterns that act like pit stops during a race.
● In a bull flag, price rallies sharply, then consolidates lower in a downward-sloping rectangle. If price breaks above the upper boundary, the uptrend is likely to resume. Jump straight into the bullish flag ideas .
● In a bear flag, price crashes, then drifts higher or sideways, forming an upward-sloping consolidation. A breakdown below the lower support hints at a continuation lower. What goes up must go down — bearish flag ideas for thought.
Flags are prized for their reliability and tight risk-to-reward setups. The breakout is typically swift, and traders often use the length of the flagpole as a projected target.
🎏 Meet the Pennant: The Flag’s Cousin
Pennants are like mini-triangles that form after a strong price move, usually in high-volume conditions. Unlike regular triangles, they’re smaller and more compressed — a tight consolidation in the shape of a tiny symmetrical triangle.
What makes a pennant different from a flag? The structure. While flags are rectangular, pennants are more pointed — a converging pattern rather than parallel lines.
Pennants are often seen in high-momentum environments, and when price breaks out of the consolidation zone, it often does so with force. Get some pennant ideas straight from our community.
🧐 How to Actually Trade These Patterns
Spotting a continuation pattern is one thing. Trading it with discipline is another.
Here’s a basic checklist:
● Identify the trend. Continuation patterns only work when there’s a clear preceding move. If the chart is a sideways mess, maybe skip it.
● Draw your levels. Use trendlines or horizontal support/resistance to outline the pattern. Keep it clean — if you’re forcing a pattern, it probably isn’t there.
● Wait for the breakout. Don’t jump in too early. Let the price confirm your bias. Breakouts are more credible with a volume spike.
● Set your stop wisely. Most traders place stops just outside the opposite side of the pattern — below the lower trendline in an uptrend, or above the upper trendline in a downtrend.
● Target projection. Many use the height of the pattern or the flagpole to estimate a target price, though market conditions should influence your approach.
🤔 So, What Could Go Wrong?
Glad you asked. Plenty.
● Fakeouts: Just because it looks like a breakout doesn’t mean it’s real. Wait for confirmation — volume, a close outside the pattern, or your favorite indicator giving the green light.
● Shaky patterns: Not every triangle-looking pattern is a triangle. Sometimes it’s just noise. Don’t make up patterns. The market doesn’t care about your geometry.
● Overleveraging: Continuation patterns look reliable, but no pattern is bulletproof. Position sizing still matters. Don’t bet the farm because a pennant gave you butterflies.
💡 Pro Tips from the Chart Trenches
● Set alerts on trendline breaks so you’re not glued to the screen like a caffeinated hawk.
● Use pattern recognition tools if you’re a newer trader — but verify manually. No software is a crystal ball.
● Trade continuation patterns in the direction of the trend. Countertrend flags are usually bear traps in disguise.
📌 One Last Thing: Pattern ≠ Prediction
Chart patterns don’t tell the future. They tell a story about buyer and seller behavior. Continuation patterns? They’re just the market saying, “Yeah, we’re still into this trend. Just grabbing some break first.”
Use them as one part of a system. Combine them with momentum indicators, volume, or good ol’ fashioned risk management.
Because in the end, it’s not about how many triangles you find — it’s about how many fakeouts you avoid.
Off to you : Spotted any textbook triangles or sneaky flags this week? Or caught a pennant fakeout that wrecked your stop loss?
Drop your best (or worst) continuation pattern story below. You never know who might learn something from your chart scars.
Continuationpatterns
The Low Hanging Fruit Stacey Burke setup, with Silver R4,5 shortIn this video, I walk you through my entire thought process during today's trading session. You'll learn how I selected the pairs and executed three key trades:
Silver 3 Sessions of Rise Reversal short
DJ30 Low Hanging Fruit Continuation short
I'll also provide a detailed explanation of the Low Hanging Fruit setup, helping you understand how to apply this strategy in your own trading. Low Hanging Fruit is a key best trade setup of Stacey Burke. Don't miss out on these valuable insights and tips!
For details on the Stacey Burke style trading approach see his site and playbook: https://stacey-burke-trading.thinkifi...

Navigating Market Turbulence: Unveiling the Bearish Flag Pattern
In the world of technical analysis, patterns often provide valuable insights into potential market movements. One such pattern, the bearish flag, is a vital tool for traders seeking to identify and capitalize on bearish trends. In this comprehensive guide, we'll explore the bearish flag pattern, uncovering its characteristics, formation, and implications. With real-world examples, you'll gain the knowledge to spot this pattern and make informed trading decisions in bearish market conditions.
Demystifying the Bearish Flag Pattern
What is a Bearish Flag Pattern? 🚩
The bearish flag pattern is a continuation pattern that occurs during a downtrend. It resembles a flag on a flagpole, hence its name. This pattern suggests a brief consolidation or pause in the downtrend before the price resumes its downward trajectory.
Key Characteristics of a Bearish Flag
1. Prior Downtrend: The bearish flag pattern forms after a notable downtrend, indicating bearish sentiment in the market.
2. Flagpole: The flagpole is the initial sharp decline in price that precedes the flag's formation. It represents the strong selling pressure.
3. Flag Formation: Following the flagpole, there is a period of consolidation where the price moves in a horizontal or slightly upward range. This forms the flag itself and indicates a temporary pause in the downtrend.
4. Volume: Ideally, the volume should decline during the flag formation, reflecting a decrease in trading activity.
5. Breakout: The bearish flag is confirmed when the price breaks below the lower boundary of the flag, resuming the downtrend.
Bearish Flag in a Stock
Bearish Flag in a Forex Pair
The bearish flag pattern is a valuable tool for traders seeking to navigate bearish market conditions. By understanding its characteristics and monitoring its formation, traders can identify potential opportunities to profit from the resumption of a downtrend. However, like all technical patterns, it should be used in conjunction with other forms of analysis to make well-informed trading decisions. The bearish flag pattern is a powerful addition to any trader's toolkit for analyzing and interpreting market dynamics. 📉🚩
Please, support my work with like and comment!
Love you, my dear followers!👩💻🌸

User Request: How to Set Pull Back Alert on Bull Bear Power VoidOne of the users following me asked a really good question.
Thanks @Manu45e for this one. Its actually a really important thing to know about.
This will help you understand when a pullback is over and its time for a continuation trade.
1. Wait for HTF Volume to cross down below the ZERO level
2. Wait for Volume to turn BLUE while still below ZERO
3. Wait for Blue Volume to cross ABOVE the zero level
4. You need to already have current volume above the Bullish side of the VOID
Continuation trade confirmed.
For this you are going to need one indicator.
The Bull Bear Power Void
Make sure to click the image below and also click the BOOST button on that page to make it popular.
Here's the indicator

Candlestick Charts Part 3: ContinuationHello everyone, as we all know the market action discounts everything :)
_________________________________Make sure to Like and Follow if you like the idea_________________________________
NOTE: some pattern could be reversal and continuation patterns depending if its in an uptrend or downtrend.
Today's video will be about the Candlestick Chart : Continuation Patterns.
Continuation Patterns are candlestick patterns that tend to resolve in the same direction as the prevailing trend.
So lets start by talking about the different types of Patterns :
Bullish Continuation Patterns
Bearish Continuation Patterns
And they are divided into 3 groups :
Weak Patterns
Reliable Patterns
Strong Patterns
We Start with the Strong Continuation Patterns :
1) Rising Three Methods :
is a five candlestick bullish continuation pattern. The first candlestick is a large bullish candlestick that takes place during an uptrend. Then a group of two to four small body candlesticks (either bullish or bearish) retreat within the price range established by the first day’s real body bullish candlestick. The final candlestick of the pattern is another large bullish candlestick that closes above the first day’s closing price.
2) Falling Three Methods :
is a five candlestick bearish continuation pattern. The first candlestick is a large bearish candlestick that takes place during a downtrend. Then a group of two to four small body candlesticks (either bullish or bearish) slowly ascend within the price range established by the first day’s real body bearish candlestick. The final candlestick of the pattern is another large bearish candlestick that closes below the first day’s closing price.
3) Deliberation in an uptrend :
A deliberation structure is comprised of three Japanese candlesticks. All three are bullish (green). The first is a candlestick with a small body followed by a large full candlestick. Finally, the last candlestick also has a small body and forms a star.
4) Concealing Baby Swallow in an uptrend :
The Concealing Baby Swallow is a four-line candlestick pattern, which appears so rarely. Two Black Marubozu candles appearing one after the other are very uncommon situation on the candlestick charts what limits the appearance of this pattern.
Now Lets Talk about the Reliable Continuation Patterns :
1) Bullish Separating Lines :
Bullish separating lines pattern is a two-candle bullish continuation candlestick pattern that comes up in the middle of a bullish trend. It indicates that the current bullish trend is about to continue after a temporary pullback.
2) Bearish Separating Lines :
The bearish separating line is known as a bearish continuation pattern. The first line is a white candle that comes up as a long line in a downtrend. The second line is made up of a black candle that comes up as a long line. Both bars will open at the same price, and then the prices are separating.
3) Bullish Matching High :
This pattern involves two or more matching highs. On a lower timeframe chart this pattern will look like a support or resistance being broken.
Breakouts are used by traders a trigger to enter the market with the momentum of the breakout signaling a new leg of a trend.
4) Bearish Matching Low :
This pattern involves two or more matching lows which if broken is a signal that there will be a resumption of the current trend.
5) Upside Tasuki Gap :
It is a bullish continuation candlestick pattern which is formed in an ongoing uptrend.
This candlestick pattern consists of three candles, the first candlestick is a long-bodied bullish candlestick, and the second candlestick is also a bullish candlestick formed after a gap up.
The third candlestick is a bearish candle that closes in the gap formed between these first two bullish candles.
6) Downside Tasuki Gap :
Downside Tasuki Gap is a bearish continuation pattern that forms in the middle of a downtrend. The first candle is bearish, and is followed by a negative gap and another bearish candle. The third candle is bullish and closes right in the gap between the first two bars.
And Last but not least The Weak Continuation Patterns :
1) Advance Block :
The advance block is a three bar pattern. The pattern appears as a block of three white, rising candlesticks, each with a shorter body than the last.
The candles should not have overly long shadows as these can sometimes develop into other pattern types such shooting stars and hanging men.
2) Stick Sandwich :
The stick sandwich candlestick pattern can occur in both bull and bear markets. The stick sandwich candlestick pattern consists of three candlesticks, where one candlestick has an opposite colored candlestick on both sides. The closing prices of the two candlesticks that surround the opposite colored candlestick must be same.
3) Bullish Side by Side White Lines :
– It occurs during an Uptrend; confirmation is required by the candles that follow the Pattern.
– The First Candle is white.
– Then there is a Gap Up between the First and Second Candle.
– The Second and Third Candle are white, their Real Bodies have the same length; moreover they have the Open at the same level (More or less) and is above the Real Body of the First Candle.
4) Bearish Side by Side White Lines :
– It occurs during a Downtrend; confirmation is required by the candles that follow the Pattern.
– The First Candle is black.
– Then there is a Gap Down between the First and Second Candle.
– The Second and Third Candle are white, their Real Bodies have the same length; moreover they have the Open at the same level (More or less) and is below the Real Body of the First Candle.
5) Bullish On Neck Line:
The on neck candlestick is a continuation pattern. In an on neck pattern, the first candle is Bullish and the second one is Bearish. The first candle’s body is long while the second one is shorter. The second candle closes near the first one or close to the first candle. The pattern gets its name because at the point where the closing prices of the two are nearly the same or same, it forms a horizontal line which looks like a neck or a neckline.
6) Bearish On Neck line :
The on neck candlestick is a continuation pattern. In an on neck pattern, the first candle is bearish and the second one is bullish. The first candle’s body is long while the second one is shorter. The second candle closes near the first one or close to the first candle. The pattern gets its name because at the point where the closing prices of the two are nearly the same or same, it forms a horizontal line which looks like a neck or a neckline.
I hope that I was able to help you understand Continuation Patterns in Candlestick Charts better and if you have any more questions don't hesitate to ask.
Hit that like if you found this helpful and check out my other video about the Moving Average, Stochastic oscillator, The Dow Jones Theory, How To Trade Breakouts, The RSI , The MACD , The Bollinger Bands , The Different Types Of Trading Strategies, Candlestick Charts Part 1 & 2 links will be bellow

2 Types of Chart Pattern2 Types of Chart Pattern are Continuation Pattern and Reversal Pattern as show in the chart.
Continuation Pattern
1. Symmetrical Triangle
2. Triangle
Reversal Pattern
1. Ending Diagonal
2. Expanding Diagonal (Broadening)
3. Channel
For best practices, draw channel and then adjust the 2nd line to confirm either triangle or diagonal.
Example Up trend :
Market Up Trend, draw channel (Bullish / Up trend) by starting draw support trendline as 1st line.
For 2nd line, draw resistance trendline as channel.
Adjust 2nd line to become triangle or diagonal if applicable.
Example Down trend :
Market Down Trend, draw channel (Bearish / Down trend) by starting draw support trendline as 1st line.
For 2nd line, draw resistance trendline as channel.
Adjust 2nd line to become triangle or diagonal if applicable.
Sebagai latihan yang baik, lukis Channel terlebih dahulu kemudian ubah garis kedua untuk dapatkan garis sama ada triangle atau diagonal.
Contoh Up Trend :
Market Up Trend, lukis channel (Bullish / Up trend) dengan melukis support trendline as garis nombor 1.
Untuk garis nombor 2, lukis resistance trendline sebagai channel.
Ubah garis nombor 2 untuk jadi triangle atau diagonal jika sesuai.
Contoh Down Trend :
Market Down Trend, lukis channel (Bearish / Down trend) dengan melukis resistance trendline as garis nombor 1.
Untuk garis nombor 2, lukis support trendline sebagai channel.
Ubah garis nombor 2 untuk jadi triangle atau diagonal jika sesuai.

Symmetrical Triangle GBPJPYSymmetrical Triangle spotted on GBPJPY. Long entry on break of pattern.
You can find these Patterns across all charts. Mark out your areas of interest and monitor Price Action!

Trend Continuation Patterns & Reversal Patterns🚀💣Hi, friends! Let's keep learning?😉
Today we are talking about <> and <> of Technical Analysis 😊
- this girls try to tell You more details😉
Hope, It would be helpful for You♥️
🐂Bull flag🐂
The principle of bullish flag trading, like all technical analysis figures, is the same - a breakout of the control point is required. As soon as a breakdown has occurred, you can immediately post the target. The target in a bull flag will be the height of the pole.
There is one more feature of this figure - the canvas of the flag should be tilted against the main trend.
🐻Bear flag🐻
For the most profitable entry, it is better to enter into a deal with a pending order. As soon as the trade is entered, the take profit is placed at the height of the pole from the breakout point of the pattern.
🐂Bullish pennant🐂
The pattern trading rules are identical to the bull flag trading rules.
🐻Bearish pennant🐻
The trading rules are the same as for the bear flag .
💥Head & Shoulders Pattern💥
After the pattern has become clearly visible, namely, the right shoulder is clearly visible, the trader needs to wait for the neckline breakout. Breakouts occur on strong impulses with a sharp increase in volume . Therefore, in order not to miss the entry and enter at the best price, it's better to use a sell stop order.
To calculate where the price will go after the breakout of the pattern, it is enough to measure the height of the pattern (vertical from the maximum of the head to the neckline) and postpone it to the breakout point.
💥Inverted Head & Shoulders Pattern💥
An inverted head and shoulders pattern occurs in a downtrend and heralds an uptrend. The rules for working on a figure are similar to the previous ones.
It is worth noting that the head and shoulders pattern is rarely encountered in its pure form. Be careful!
💥 Double Bottom Pattern 💥
After you have identified the pattern on the price chart, you need to wait for the breakout of its resistance line. If the price has broken through the resistance, then the target will be the width of the pattern's range - the distance from the lowest point to the resistance.
💥Double Top Pattern 💥
A double top is similar to a double bottom . The only difference is that this pattern is reversed and occurs on uptrends.
The number of extrema in a pattern can be not only double, but also triple, and even more. But the rules of work will be identical for everyone - enter on a breakout, postpone the target to the height of the figure and wait for its execution.
💥Diamond💥
We measure the height and wait for the breakdown of the diamond. If a breakout has occurred, then the price movement target will be the height of the pattern from the breakout point.
💥Cup & Handle💥
Trades are opened on the breakdown of the "handle" upwards. Target is the height of the figure.
Thanks for Your attention🙏🏻
Stay in touch🧡
Sincerely yours Rocket Bomb🚀💣

Continuation Flag ExplainedThis is a perfect example of a Continuation Flag (CF) That was taken last month.
Although each pair that we trade has a slight variation to how it forms a CF.
The fundamental parts of each set up is exactly the same.

RISING AND FALLING WEDGES
Good afternoon.
Today we are looking at another chart pattern
RISING AND FALLING WEDGES .
Let’s get on it.
Wedges can either be continuation or reversal patterns.
Just to refresh your memory, continuation patterns are formations that show side way price action, signalling a temporary pause in the trend; whereas reversal patterns indicate a change in the trend.
Whether wedges are continuation or reversal, it’s not really significant, what matters is spotting the pattern, and knowing how to make money out of it.
Wedge patterns are classified as either RISING WEDGES OR FALLING WEDGES.
Rising wedges, as the name implies, slopes upwards, and they eventually break to the downside
Graphically, rising wedges look like the above sketch chart(Sketch 1)
notice how the slope of the support line is steeper than that of the resistance.
This indicates that higher lows are being formed faster than higher highs. That is precisely how the wedge pattern get to be formed.
The inverse of the rising wedge is the FALLING WEDGE , which usually breaks to the upside.(Sketch 2)
Just like on the rising wedge pattern, the falling trend line connecting the highs (resistance) is steeper than the trend line connecting the lows (support).
As mentioned earlier, rising and falling wedges can either be continuation or reversal patterns.
But whether they be continuation or reversal patterns is not our focus, our focus is on making money when these patterns ‘BREAKOUT’ .
If you case you are wondering what we mean by ‘breakout’; consider the chart above(Sketch 3) of a falling wedge and a rising wedge, and how they typically break to the upside and downside, respectively
Now let’s look at how we can make money out of a RISING WEDGE PATTERN.
Let’s start by considering the chart (Sketch 4)
Now, when entering a Short trade based on a rising wedge, it’s important to wait for a break and close below the support line.
After this close, aggressive traders can ‘pull the trigger’.
But a more conservative way to enter the trade, is to wait for a retest of the previous support (now resistance) before pulling the trigger.
In this case the sequence will be something like this:
1. Wait for a close below support
2. Wait for a retest of the previous support
3. If the previous support act as resistance, then enter short trade
A Long trade based on a falling wedge is entered on the same principle (but in reverse), that is,
1. Wait for a price close above resistance
2. Enter Long trade at that close (for aggressive traders)
3. For conservative traders, wait for a retest of the previous resistance (now support) before pulling the trigger
That’s ENTRY, now let’s look at placing stop loss and take profit levels when trading wedge patterns.
Take profit target should ideally be the height of the wedge formation.
Consider the chart above(Sketch 4)
Stop loss orders should always be placed at a level that if hit, it will invalidate the trading set up.
In the case of rising wedges, this level will be the area just above resistance.
The opposite is true for falling wedges, place stop loss just below support.
Thanks for your Likes and Support....
Until next time, let’s keep if Profitable!

#BTC Bullish Flag Pattern 1D#BTC is showing a bullish Flag Pattern on 1D , which includes -as we know-
- The flag pole
- The flag
- The continuation
The Flag pole, starting from the bottom at 6875 which represent a major support and was a big price bounce from it, ends at 10427 the Highest price in this trend.
the flag was formed after the correction starting from the previous 10427 level until -+ 8350 which was a good support on Jan. 24,2020 to bounce from it and continue the uptrend.
the Continuation Started as I think from the previous level @8350 zone and will go up with some corrections from time to time to reach 11831 ,
Many of you will ask why that level (11831) ?
The point is that the flag pattern when formed, we take the length of the Flag pole , and clone it when the flag is formed, so I expect to see the same length of growth to 11831 , the same level is a major Fibo level 1.618.
If you like my idea, Like or comment, share your opinion, don't be shy.

Continuation pattern lesson This is just a simple chart showing continuation patterns. I took all the normal indicators I typically add to every chart to help you see clearly.
