#XCUUSD COPPER - Price Is In A Clear UptrendCopper is in a clear uptrend (bullish structure).
Price broke above old resistance (green zone = support now) also a previous ATHs, pulled back into it, and is holding higher lows inside an ascending channel.
That support area is a buy-the-dip (long) zone, with upside targets toward ~7.00 if the trend continues. Which is a round number and a strong psychological level that has been acting like a magnet for the price.
Copperlong

Falling towards key support?COPPER is falling towards the support level, which acts as a pullback support aligned with the 38.2% Fibonacci retracement, and could bounce from this level to our take profit.
Entry: 5.8119
Why we like it:
There is a pullback support level that aligns with the 38.2% Fibonacci retracement.
Stop loss: 5.7173
Why we like it:
There is a pullback support level that is slightly above the 78.6% Fibonacci retracement.
Take profit: 5.9634
Why we like it:
There is an overlap resistance level.
Enjoying your TradingView experience? Review us!
Please be advised that the information presented on TradingView is provided to Vantage (‘Vantage Global Limited’, ‘we’) by a third-party provider (‘Everest Fortune Group’). Please be reminded that you are solely responsible for the trading decisions on your account. There is a very high degree of risk involved in trading. Any information and/or content is intended entirely for research, educational and informational purposes only and does not constitute investment or consultation advice or investment strategy. The information is not tailored to the investment needs of any specific person and therefore does not involve a consideration of any of the investment objectives, financial situation or needs of any viewer that may receive it. Kindly also note that past performance is not a reliable indicator of future results. Actual results may differ materially from those anticipated in forward-looking or past performance statements. We assume no liability as to the accuracy or completeness of any of the information and/or content provided herein and the Company cannot be held responsible for any omission, mistake nor for any loss or damage including without limitation to any loss of profit which may arise from reliance on any information supplied by Everest Fortune Group.

CopperXCUUSD
- Fair Value Gap
- Demand Zone
- Fibonacci Level - 61.80%
- Order Block
- Completed " 12345 " Impulsive Waves

CopperXCUUSD
- Head and Shoulder as an corrective pattern in Short Time Frame
- Break of Structure
- Demand Zone
- Fair Value Gap
- Buy Side Liquidity

XCU/USD: Will This Demand Zone Hold for Bulls?🎯 XCU/USD: The Great Copper Heist Strategy | Multi-Layer Entry Setup 💰
📊 Asset Analysis
Copper vs U.S. Dollar (XCU/USD) - Metals Market
Strategy Type: Swing/Day Trade Hybrid
Market Bias: 🐂 BULLISH CONFIRMATION
🔍 Technical Setup Overview
The setup shows bullish confirmation with triangular moving averages converging in a demand zone - a classic institutional accumulation pattern. We're seeing strong support structure forming, making this an attractive risk-reward opportunity for multi-layer entries.
🎯 The "Layered Entry" Strategy Explained
This isn't your typical single-entry approach. We're using a multi-limit order layering strategy (what I call the "strategic accumulation method") to build positions gradually:
📍 Suggested Layer Entry Levels:
Layer 1️⃣: $4.9000
Layer 2️⃣: $4.9500
Layer 3️⃣: $5.0000
Layer 4️⃣: $5.0500
Layer 5️⃣: $5.1000
💡 Pro Tip: You can add more layers or adjust based on your account size and risk tolerance. The beauty of layering? You average into the position as price dips, reducing overall entry cost.
🛡️ Risk Management
🚨 Stop Loss: Below $4.8000
This level invalidates the bullish structure and protects capital if the setup fails.
⚠️ Important Disclaimer: The stop loss mentioned is based on this specific analysis. You should always determine your own risk parameters based on your account size, risk tolerance, and trading plan. Take profits at YOUR comfort level - your risk, your rules! 🎲
🎯 Profit Targets & Exit Strategy
Primary Target: $5.4000 🎊
This represents a solid risk-reward ratio from our layered entries.
⚠️ Long-Term Resistance Warning: There's a major resistance zone around $28.00 (historical supply zone acting as a strong barrier + potential overbought conditions). If you're thinking ultra-long term, be aware that this level has trapped bulls before.
💰 Exit Strategy Note: The targets provided are guideline levels. Always manage your own exits based on price action, momentum, and your personal profit goals. Lock in gains when you're comfortable - trading is personal!
🔗 Related Pairs to Watch (Correlation Analysis)
Keep an eye on these correlated assets to confirm the copper move:
HG (Copper Futures) - Direct correlation, primary benchmark
FCX (Freeport-McMoRan Inc.) - Major copper producer, equity proxy
DXY (U.S. Dollar Index) - Inverse correlation; weak dollar = stronger copper
CL (Crude Oil) - Industrial commodity correlation
AUD/USD - Australian dollar heavily tied to copper exports
CNY/USD - China is the largest copper consumer globally
💡 Key Point: If DXY weakens and AUD/USD strengthens while industrial commodities rally, this confirms the copper bullish thesis.
📈 Why This Setup Works
✅ Triangular MA convergence in demand zone = strong technical confluence
✅ Multi-layer entry reduces timing risk
✅ Clear invalidation level for risk management
✅ Favorable risk-reward ratio to first target
✅ Industrial metals showing strength in current macro environment
⚡ Final Thoughts
This is a methodical approach to capturing potential upside in copper while managing downside risk through layered entries. Remember: trading is a marathon, not a sprint. Build positions strategically, manage risk religiously, and let the market come to you.
🎭 Strategy Style Disclaimer
This analysis uses a creative "layered accumulation" approach for educational and entertainment purposes. All trading involves substantial risk of loss. This is not financial advice - trade at your own risk and always do your own research. Past performance doesn't guarantee future results. ⚠️📉
✨ If you find value in my analysis, a 👍 and 🚀 boost is much appreciated — it helps me share more setups with the community!
#XCU #Copper #MetalsTrading #SwingTrading #DayTrading #ForexTrading #CommodityTrading #TechnicalAnalysis #LayeredEntry #RiskManagement #BullishSetup #TradingStrategy #XCUUSD #CopperFutures #MultiLayerEntry

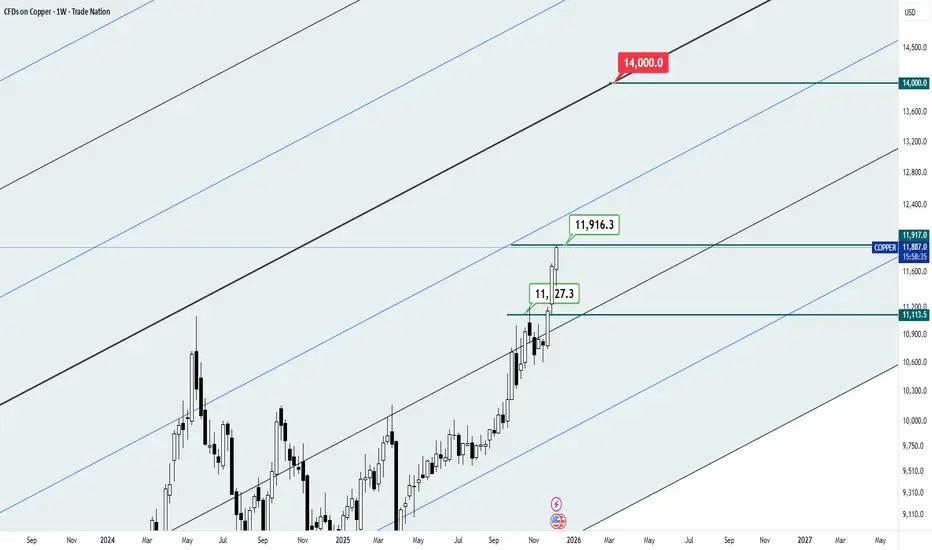
What is the rate of 14K displayed for?According to the past analysis that you can see in the link below and the speed of its realization:
What the chart on Friday morning can do is keep the copper market active awake. The predictable rates for this metal are colorful and to hedge the risk, you should keep an eye on the future rates in copper!!
Good luck...
Copper Trend Acceleration! LSMA Pullback Supports the Move!🔥 XCU/USD — “COPPER VS U.S. DOLLAR”
🔧 Metals Market Opportunity Blueprint (Day / Swing Trade Edition)
📌 🔵 Market Plan: Bullish Structure Confirmed
Copper continues to showcase strong upside structure, and the LSMA Moving Average Pullback has now confirmed fresh bullish continuation momentum.
The price action is stabilizing above key intraday support, keeping buyers in control while maintaining trend discipline.
🎯 Entry Strategy (Flexible + Layer-Friendly)
You may enter at any price level, depending on your personal plan.
For traders using the Thief Layer Strategy, here are the structured levels:
🔹 Layer 1 → 5.3400
🔹 Layer 2 → 5.3800
🔹 Layer 3 → 5.4200
🔸 (You may extend layers based on volatility and your personal system.)
This layered approach helps average entries while staying aligned with market strength.
🛡 Stop-Loss Zone (Trader-Controlled)
Suggested SL for the thief plan: 5.2800
Dear Ladies & Gentlemen (Thief OG’s), this is NOT a mandatory level — adjust according to:
• Your risk profile
• Your system’s buffer
• Market volatility
Use your own decision-making to secure gains and protect your capital.
🎯 Target Levels (Smart Exit Zone)
Copper is approaching a strong resistance cluster combined with overbought conditions + liquidity trap zones.
So the recommended approach is to escape with profits rather than hold blindly.
🏁 Primary Target → 5.5600
Again, Dear Ladies & Gentlemen (Thief OG’s), this TP is optional — manage exits with your own discipline, risk, and style.
🌍 Related Pairs to Watch (Correlation Guide + Key Points)
🟠 1. XAU/USD — Gold vs USD
Correlation:
• Often moves inversely with USD strength
• Can highlight broader commodity demand sentiment
Why watch it:
• Gold strength can indicate commodity-wide risk-on behavior
• Helps confirm metals sector flows
🟣 2. XAG/USD — Silver vs USD
Correlation:
• Silver and Copper often rise together during industrial demand expansions
Why watch it:
• Strong silver rallies often lead or follow copper momentum
• Helpful for timing metals-based pullbacks and extensions
🟢 3. USOIL / WTI Crude
Correlation:
• Copper responds to global growth expectations — oil confirms economic activity
Why watch it:
• Rising oil typically reflects higher industrial production
• Gives early signals of demand conditions that benefit copper
🔵 4. AUD/USD — Commodity Currency
Correlation:
• Australia is a major copper producer
• AUD is strongly tied to global commodities
Why watch it:
• AUD strength often corresponds with rising metals
• Can help detect early sentiment shifts
🟤 5. DXY — U.S. Dollar Index
Correlation:
• Copper moves inversely with USD
Why watch it:
• Copper rallies strengthen when USD weakens
• A strong DXY can slow or cap copper upside near resistance
Remember:
✅ Trade with layers ✅ Adjust SL/TP to your style ✅ Watch correlated assets
🚀 Let’s catch this move, Thief OG’s!
Like, Follow, and Share if this helps! 💬⬆️🔔
Stay tuned for more high-quality setups.
#Copper #XCUUSD #TradingSetup #MetalsTrading #Bullish #SwingTrade #DayTrade #ThiefMethod #TradingView #Investing #Commodities

CopperXCUUSD
- Bullish Channel as an corrective pattern in Short Time Frame
- Resistance Level
- RSI - Divergence
- Completed " 1234 " Impulsive Waves
- BSL

CopperXCUUSD
- Fibonacci Level - 61.80% / 78.60%
- Demand Zone
- Completed " 12345 " Impulsive Waves and " AB " Corrective Wave
- Fair Value Gap
- Bullish Channel as an corrective pattern in Short Time Frame

CopperXCUUSD
- Completed " 12345 " Impulsive Waves
- Bullish Channel as an corrective pattern in Short Time Frame
- Break of Structure
- Order Block
- Fair Value Gap

Risk appetite will return again! With all the FUD that's going around in the market, I look back to dr. copper! Sometimes it's important to look back at the fundamentals and then you'll realize, everything is playing out the way it should.
Extreme bearish deviation from the mean on the COPPER/GOLD ratio
Massive macro pitchfork bottom reoccurring
Small caps can't catch a breath
All while talks of QE just being around the corner!
I don't believe the current liquidity strain on the system (High SOFR spreads, Large TGA build up, Lowest reverse repo reserves, Low bank reserves) will last too long before the printer restarts. Powell knows this!

CopperXCUUSD
- Falling Wedge in Short Time Frame
- Demand Zone
- Order Block
- Change of Characteristics
- Bullish Channel as an corrective pattern in Long Time Frame

CopperXCUUSD
- Bullish Channel as an corrective pattern in Short Time Frame
- Sell Side Liquidity
- Change of Characteristics
- Demand Zone
- Completed " 12345 " Impulsive Waves and " A " Corrective Waves

Copper (HG1) Market Watch Simple & Clear!Copper’s looking strong right now 💪 and it might be setting up for a big move.
Here’s the key level I’m watching:
📈 If copper breaks and closes above 5.41, that could open the door for a run all the way up to 7.13.
That’s a big potential move but only if we hold strong above that breakout level.
💡 Right now, it’s all about confirmation ; a clean close above 5.41 could shift the trend in a big way.
Want to see the chart setup I’m using and how I’m planning around that 5.41 breakout?
💬 DM me “COPPER” and I’ll send you the exact breakdown directly. 🚀
Mindbloome Exchange
Trade Smarter Live Better

Zinc & Copper Correlation is very healthyZinc and copper markets are closely related because both metals are used heavily in construction, manufacturing, and electrical applications, so demand often rises and falls together with industrial activity.
They’re also frequently mined from the same deposits, meaning supply-side disruptions can affect both. As a result, prices for zinc and copper tend to show a high degree of correlation, moving in similar cycles tied to global economic growth and infrastructure.
Comparing the Charts (Zinc on the left on a Monhtly TF), we see that Zinc has a lot of room left to the upside. Because it's goal is to go back to balance, which is the Centerline.
And because of the close correlation, I think the Chart of Copper HG1! is still OK.
So, in Copper, the Centerline target is still in play.

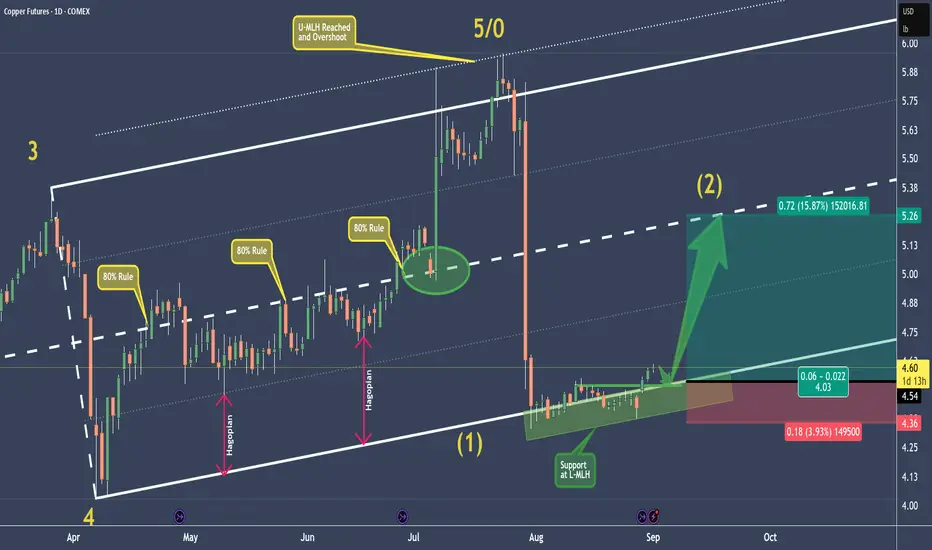
HG - Copper Setting Up For A Long Opprtunity At Extreme📊 Fundamentals first:
- Short-term: The copper market is turbulent—marked by sharp price spikes, crashes, and global shifts in stock levels.
- Medium-term: Despite forecasted surpluses from ICSG, technology innovations and steady demand (especially from China and green sectors) may underpin prices.
- U.S. risk factor: The tariffs remain a major wildcard, likely restructuring trade flows, increasing domestic input costs, and distorting global price differentials.
📈 Now the Chart:
P5/0 at the U-MLH marked the end, and price dropped into the void.
Now, at the L-MLH we see support has built up.
The momentum we see now will probably lead in a pullback before the potential massive run-up to the Centerline.
💡 If the trading God gives me a pullback, I am willingly risk my 0.5% in this trade to make at least 4x more. 🦊
Happy new week to all §8-)
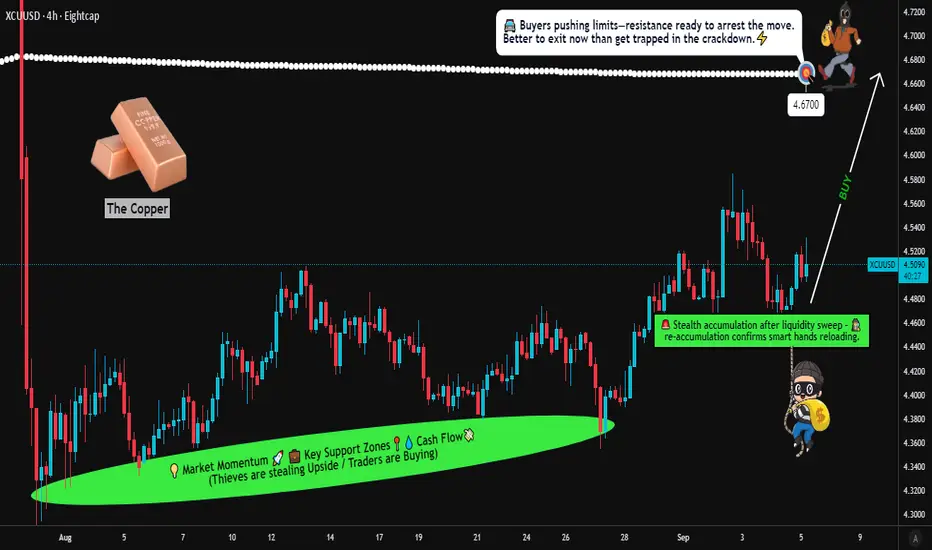
Copper vs Dollar | Institutional vs Retail Sentiment Analysis🔥 XCU/USD – Copper vs U.S Dollar | Thief Money-Making Plan (Swing/Scalping Trade)
🎯 Plan & Thief Entry Style
Bias: Bullish ✅ (Re-Accumulation Buy Setup)
Entry Style: Thief strategy = multiple limit order layers 🧩
Suggested Layers: (4.4600) 🟢 | (4.4700) 🟢 | (4.4800) 🟢 | (4.4900) 🟢 | (4.5000) 🟢
You can always increase limit layers depending on your own strategy.
Stop Loss (Thief SL): 4.4200 ⚠️
Ladies & Gentlemen (Thief OG’s) — always adjust SL to your own plan & risk appetite.
Target Zone: 4.6700 🎯
Resistance + overbought zone + possible trap → steal the money & escape! 🏃💰
📊 XCU/USD Market Snapshot (Copper vs U.S Dollar) – Sept 5, 2025
Real-Time Change: -0.8% 🔻
Retail Sentiment: 45% Long 😊 | 55% Short 😟
Institutional Sentiment: 60% Long 🚀 | 40% Short 🛑
➡️ Retail leaning bearish, while institutions show cautious optimism.
😨💰 Fear & Greed Index
Score: 48/100 (Neutral) ⚖️
Market mood balanced → no extreme fear/greed at the moment.
📊 Fundamental Score – 6/10
Stable global copper demand ✅
Risks: US economic slowdown ❌ & weaker China industrial output ⚙️
Key Watch: industrial production data + trade policy shifts
🌍 Macro Score – 5.5/10
US Dollar strength 🦅
Global PMI data + US jobs report 🏭
Tariff talks & supply chain risks add uncertainty
🐂🐻 Overall Market Outlook
Neutral ➡️ Slightly Bullish ⚖️➡️🚀
Short-term pressure from USD strength 📉
Long-term supported by institutional buying & steady industrial demand 🏗️
Watch: US Nonfarm Payrolls + China economic updates 📡
🔎 Quick Take – Why This Thief Plan?
Copper is stable but under macro pressure.
Institutional flow is bullish compared to retail → signal of hidden strength.
Neutral sentiment = less volatility now, but data events may unlock momentum.
Swing/Scalp opportunities exist with layered buy entries → thief escape at 4.6700! 💰
📌 Related Pairs to Watch
OANDA:XAUUSD (Gold)
OANDA:XAGUSD (Silver)
PEPPERSTONE:USDX (Dollar Index)
$CLUSD (Crude Oil)
✨ “If you find value in my analysis, a 👍 and 🚀 boost is much appreciated — it helps me share more setups with the community!”
#Copper #XCUUSD #Metals #Commodities #TradingView #SwingTrade #Scalping #Forex #ThiefStrategy #Layering #CommoditiesTrading #XAUUSD #XAGUSD #USDIndex #CrudeOil
Gap below… but copper’s breakout still in playCopper markets erupted higher this week following President Trump's proposal to impose a 50% tariff on copper imports. The price ripped from just above $5.20 to nearly $5.80 in a single 4-hour candle.
Now, copper could be forming a bullish flag or pennant on the 4-hour timeframe. After the vertical spike, price is consolidating in a tight, potentially downward-sloping channel between ~$5.45 and ~$5.60.
If confirmed with a clean breakout above the flag’s upper trendline - perhaps near $5.62—the next leg could project toward the previous high near $5.80
There’s also a gap below current price action, between $5.20 and $5.35, formed during the explosive move up. While gaps can act as support zones, they also tend to get revisited.

Copper1! at Best Support !!This is the 2 chart of Copper1! .
Chart 1 Analysis:
The stock is trading near a parallel channel support zone in the 880–890 range. This zone also aligns with the monthly pivot and weekly pivot support around 882–880. Additionally, the percentage fall is nearly complete near 885, further strengthening this level as a potential support zone.
Chart 2 Analysis:
On the monthly Heikin Ashi chart, support is observed near 864, while the weekly Heikin Ashi support lies around 880.6. By connecting key levels, it indicates that Copper may find support in the 880–885 zone.
Thank You !!

Bullish rise?COPPER has reacted off the resistance level which is an overlap support and could potentially rise from this level to our take profit.
Entry: 4.7862
Why we like it:
There is an overlap support level.
Stop loss: 4.7410
Why we like it:
There is a pullback support level.
Take profit: 4.8881
Why we like it:
There is a pullback resistance level.
Enjoying your TradingView experience? Review us!
Please be advised that the information presented on TradingView is provided to Vantage (‘Vantage Global Limited’, ‘we’) by a third-party provider (‘Everest Fortune Group’). Please be reminded that you are solely responsible for the trading decisions on your account. There is a very high degree of risk involved in trading. Any information and/or content is intended entirely for research, educational and informational purposes only and does not constitute investment or consultation advice or investment strategy. The information is not tailored to the investment needs of any specific person and therefore does not involve a consideration of any of the investment objectives, financial situation or needs of any viewer that may receive it. Kindly also note that past performance is not a reliable indicator of future results. Actual results may differ materially from those anticipated in forward-looking or past performance statements. We assume no liability as to the accuracy or completeness of any of the information and/or content provided herein and the Company cannot be held responsible for any omission, mistake nor for any loss or damage including without limitation to any loss of profit which may arise from reliance on any information supplied by Everest Fortune Group.

Bullish bounce?COPPER has bounced off the support level which is an overlap support and could rise from this level to our take profit.
Entry: 4.5751
Why we like it:
There is an overlap support level.
Stop loss: 4.4681
Why we like it:
There is a pullback support level.
Take profit: 4.8155
Why we like it:
There is a pullback resistance level that aligns with the 61.8% Fibonacci retracement.
Enjoying your TradingView experience? Review us!
Please be advised that the information presented on TradingView is provided to Vantage (‘Vantage Global Limited’, ‘we’) by a third-party provider (‘Everest Fortune Group’). Please be reminded that you are solely responsible for the trading decisions on your account. There is a very high degree of risk involved in trading. Any information and/or content is intended entirely for research, educational and informational purposes only and does not constitute investment or consultation advice or investment strategy. The information is not tailored to the investment needs of any specific person and therefore does not involve a consideration of any of the investment objectives, financial situation or needs of any viewer that may receive it. Kindly also note that past performance is not a reliable indicator of future results. Actual results may differ materially from those anticipated in forward-looking or past performance statements. We assume no liability as to the accuracy or completeness of any of the information and/or content provided herein and the Company cannot be held responsible for any omission, mistake nor for any loss or damage including without limitation to any loss of profit which may arise from reliance on any information supplied by Everest Fortune Group.

Potential bullish rise?COPPER has bounced off the support level which is an overlap support and could rise from this level to our take profit.
Entry: 4.5751
Why we like it:
There is an overlap support level.
Stop loss: 4.4681
Why we like it:
There is a pullback support level that is slightly above the 38.2% Fibonacci retracement.
Take profit: 4.8155
Why we like it:
There is a pullback resistance level that lines up with the 61.8% Fibonacci retracement.
Enjoying your TradingView experience? Review us!
Please be advised that the information presented on TradingView is provided to Vantage (‘Vantage Global Limited’, ‘we’) by a third-party provider (‘Everest Fortune Group’). Please be reminded that you are solely responsible for the trading decisions on your account. There is a very high degree of risk involved in trading. Any information and/or content is intended entirely for research, educational and informational purposes only and does not constitute investment or consultation advice or investment strategy. The information is not tailored to the investment needs of any specific person and therefore does not involve a consideration of any of the investment objectives, financial situation or needs of any viewer that may receive it. Kindly also note that past performance is not a reliable indicator of future results. Actual results may differ materially from those anticipated in forward-looking or past performance statements. We assume no liability as to the accuracy or completeness of any of the information and/or content provided herein and the Company cannot be held responsible for any omission, mistake nor for any loss or damage including without limitation to any loss of profit which may arise from reliance on any information supplied by Everest Fortune Group.

Potential bullish rise?COPPER has broken out of the resistance level which is a pullback resistance and could rise from this level to our take profit.
Entry: 4.4701
Why we like it:
There is a pullback resistance level.
Stop loss: 4.3024
Why we like it:
There is an overlap support level that lines up with the 50% Fibonacci retracement.
Take profit: 4.7893
Why we like it:
There is a pullback resistance level that is slightly below the 61.8% Fibonacci retracement.
Enjoying your TradingView experience? Review us!
Please be advised that the information presented on TradingView is provided to Vantage (‘Vantage Global Limited’, ‘we’) by a third-party provider (‘Everest Fortune Group’). Please be reminded that you are solely responsible for the trading decisions on your account. There is a very high degree of risk involved in trading. Any information and/or content is intended entirely for research, educational and informational purposes only and does not constitute investment or consultation advice or investment strategy. The information is not tailored to the investment needs of any specific person and therefore does not involve a consideration of any of the investment objectives, financial situation or needs of any viewer that may receive it. Kindly also note that past performance is not a reliable indicator of future results. Actual results may differ materially from those anticipated in forward-looking or past performance statements. We assume no liability as to the accuracy or completeness of any of the information and/or content provided herein and the Company cannot be held responsible for any omission, mistake nor for any loss or damage including without limitation to any loss of profit which may arise from reliance on any information supplied by Everest Fortune Group.
