Copper Long SetupCopper Long Setup
Entry: $3.4989
TP & RR: $3.6094 (3.47)
Stop Loss: $3.4671
REASONS FOR THE TRADE
Opening a long order at a support level. As simple as that. The Stop Loss is set below the previous low and the Take Profit is at the lower trendline from the triangle that we broke down from. The market Flow indicator is printing a divergence on the 4h chart, so I believe the price should start trending up. I will be quick to trial the stop loss if the price indeed goes up. This is one of those trades that can go wrong very quickly and I don't want to give up profits.
Coppersignals

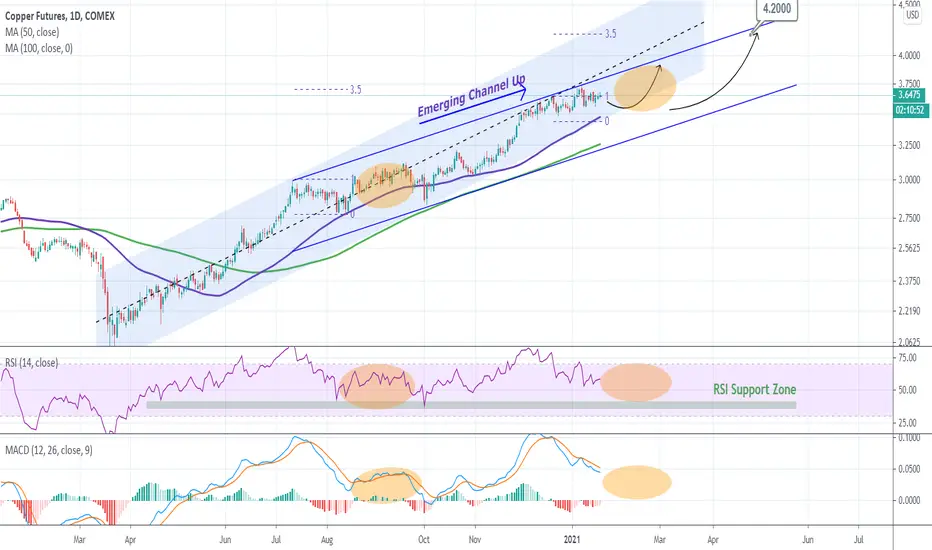
COPPER showing strength. Buy opportunity.Pattern: Channel Up on 1D.
Signal: Buy as the RSI and MACD are approaching their Support levels, while the 1D MA50 (blue trend-line) is closing in.
Target: 4.200 (the 3.5 Fibonacci extension).
** Please support this idea with your likes and comments, it is the best way to keep it relevant and support me. **
--------------------------------------------------------------------------------------------------------
!! Donations via TradingView coins also help me a great deal at posting more free trading content and signals here !!
🎉 👍 Shout-out to TradingShot's 💰 top TradingView Coin donor 💰 this week ==> Astael
--------------------------------------------------------------------------------------------------------
COPPER -Volatility inbound Most likely will rise (70%) chance, volatility inbound is guaranteed.
Asian stock markets rising fast = Copper demand can grow
Dollar issues = Copper can rise
= fundamentals are for Copper to rise, hence I am buying

COPPER - Approaching our first Take Profit LevelI like to set at least 4 take profit levels). Trading becomes really difficult unless you can have the power of patience and the power of taking profits gradually.
This way:
- you don't close in profit too early (oh fuck, i mad 200$ but if i had kept i could had made 2,000$)
- you do take profits along the way ensuring you make something (best trading habit)
- you can change the stop loss at entry (zero risk, you can also calculate the spreads and swaps and do it perfectly)
- if the market reverses against you after at least 1 of the 4 take profit levels has been checked you are guaranteed some profit. Which is still a winner
- you manage to finally create those long-lasting good trades that you opened 2 months ago but they still making you money
Patience is key, Planning is essential, Taking Profit gradually is the Winning Recipe.
ps. there is another element here. To correct your trades early and follow what the chart says. I had to change from sell to buy and I did that efficiently, which makes me happy.

Reversal play #metalsSelling copper here with a stop at 3.7500. After the failed breakout attempt last week I think the metal could reverse lower toward the bottom of the range- 3.4780. Inflation is certainty a topic that is widely discussed and copper has been a big part of the story, but in the near term the rate of change (22 days) has slowed and it is still below the most recent range high after a failed breakout attempt.

COPPER Don't miss the 2 year bull runA very important long-term pattern was just formed on Copper. On the 1M time-frame, the MA50 (blue line) and the MA100 (green line) have formed a Golden Cross. Last time that happened was in August 2004. Copper rose by +370% from the MA100 break-out level.
The Cycle seems to be repeated as the Golden Cross has come after the price Double Bottomed last March (2020). Same with the November 2001 Double Bottom. Additionally, the LMACD is replicating the exact same sequence.
For me Copper is a dip buy action on every 1M candle from now on.
** Please support this idea with your likes and comments, it is the best way to keep it relevant and support me. **
--------------------------------------------------------------------------------------------------------
!! Donations via TradingView coins also help me a great deal at posting more free trading content and signals here !!
🎉 👍 Shout-out to TradingShot's 💰 top TradingView Coin donor 💰 this week ==> TradingView
--------------------------------------------------------------------------------------------------------

COPPER- Offering us a second chance to SELLThis is our small chart for Copper.
As you can see from previous ideas we were able to sell it at a perfect time right on the mega-resistance . That level is a massive barrier that Copper will find great difficulty breaking.
The take profits are on our previous charts

COPPER - What a lovely morning ☕We called it, it happened.
Price hit the Mega-Resistance and bounced back down, already down 1,4% today. That was personally my biggest trade in value yesterday and it paid off. Stop losses are now at entry and risk is zero but the potential reward is huge, with several take profit levels in mind.
Technical analysis never lies.

COPPER- Our first 3 (of 5 ) take profit levelsWe take profit gradually, always.
Find on the chart our first 3 take profit levels
ps. it takes 1 take profit level for us to secure some profit and then have the stop loss at zero (entry) to secure a guaranteed profit. Try to do the same and your trading will become better. 💌

COPPER- Time for us to SELL We have been waiting for this alarm notification (i guess you know that tradingview can send you alarm notifications) for over a month now.
Well here we go: Time for us to sell Copper now

COPPER - (Almost) time to SELLcopper- approaching a major resistance level (the ALL TIME RESISTANCE LEVEL)
We will start opening some short positions here today but carefully because it still has room to rise another 2,5% before dropping massively

#Copper -New High #XCUUSD #Emobility First positive signal from copper.
New annual high was reached today.
Maybe primary wave 1 of cycle wave III is established.
Best regards from Hanover, Lower Saxony
Stefan Bode


Copper Daily; Still a Massive SHORT! - And has been since ...... since this post:
and this post:
and this post:
... and so on.
Many of you asked "what is our single largest current position?". That's easy: Short Copper. (and WTI Crude)

Copper Buy / Sell Based on FIBO / GANN Buy at 518.70 stop loss 516.80 Target 522.75 / 532
Fibonacci and Gann always rocks support us follow us and research with us

Copper Buy / Sell Based on FIBO / Gann - INTRADAYAs per my analysis Copper is on Buy Trend So buy near 509.30 Stop loss at 508.20 and expected targets 513.10 / 517.60
Expecting time to trigger our buy entry is 4 PM . If today"s high is safe before our entry .
Gann And Fibonacci Always rocks Follow us and support us and help us to grow


Copper MCX Positional strategyStrategy sell between 460-470
Sl above 476 closing basis
for targets 440 and below

Inverted Ascending Scallop ComparisonComparison of TOTAL2 and Copper
Similarities can be seen in the formation of a scallop
This may lead to a bullish C wave breakout on copper
I identify this structure as 'weak' due to its lacking of a strong double bottom and slight downward slope, however it is a good chart pattern for accumulation.

Copper Futures (HG1!) DailyDates in the future with the greatest probability for a price high or price low

Copper Futures (HG1!) MonthlyDates in the future with the greatest probability for a rice high or price low

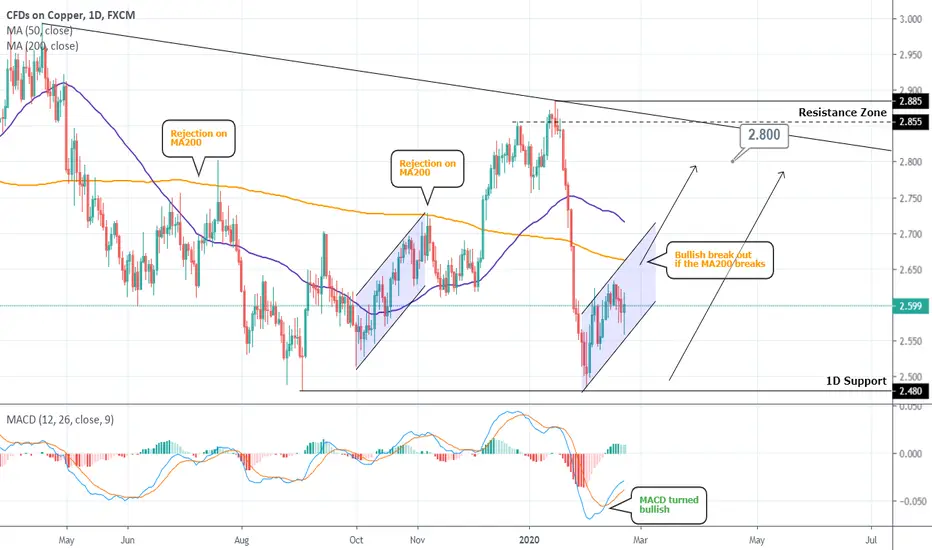
COPPER Buy SignalPattern: Channel Up on 1D.
Signal: Bullish if the price breaks the 1D MA200 or if it tests 2.500 again.
Target: 2.800 (right below the Resistance Zone).
Recent successful signal on Copper:
Copper: First Corrective Wave TargetIn "Copper Tempest" (see related ideas), I analyzed the macro-view on Copper. Now it's time to act.
My trade starts from 2.8462 with final target of 2.8125 (end of first corrective wave). Stop Loss set at 2.8537.
Disclosure: My ideas contain statements and projections based on assumptions on capital markets, and therefore inherently subject to numerous risks and uncertainties.
Before buying or selling any stock you should do your own research and reach your own conclusion or consult a financial advisor. Investing includes risks, including loss of principal.
I am not a financial advisor.
