Corn CFD Outlook: Institutional Breakout Setup Explained🌽 CORN VS DOLLAR: BULLISH MOMENTUM CONFIRMED | Swing/Day Trade Opportunity
📊 MARKET OVERVIEW
Asset: CORN Futures (ZCH26) / USD
Current Price: $446.40 (Dec 23, 2025)
Market Status: ✅ Simple Moving Average Breakout Confirmed
Trade Type: Swing / Day Trade
Signal: 🟢 BULLISH SETUP ACTIVE
🎯 TRADE PLAN: "THIEF STRATEGY"
Entry Strategy - Layered Limit Orders (Multiple Entry Points)
The "Thief Strategy" uses multiple limit buy orders to average into positions at different price levels:
Suggested Layer Entries:
🔹 Layer 1: $444 (Current support zone)
🔹 Layer 2: $446 (Mid-range entry)
🔹 Layer 3: $448 (Breakout confirmation)
Note: You can increase/decrease layers based on your capital allocation and risk tolerance
Alternative: ✅ ANY PRICE LEVEL ENTRY - Current market allows flexible entry as breakout is confirmed
🛡️ RISK MANAGEMENT
Stop Loss (SL):
Thief OG's SL: $442
⚠️ IMPORTANT DISCLAIMER: Dear Traders (Thief OG's) - I am NOT recommending you set only my SL. This is YOUR trade, adjust your stop loss based on YOUR strategy, risk tolerance, and account size. Trade at your own risk.
💰 PROFIT TARGETS
Primary Target:
Target Price: $458
Rationale: Simple Moving Average acts as a strong resistance level (police barricade). Potential overbought conditions + trap formations suggest TAKE PROFITS at this level.
⚠️ IMPORTANT DISCLAIMER: Dear Traders (Thief OG's) - I am NOT recommending you set only my TP. Take profits at YOUR own discretion based on your trading plan. Make money, secure money at YOUR OWN RISK.
📈 CORRELATED PAIRS TO WATCH
Agricultural Complex:
ZW (Wheat) - Current: $514.38 (+1.06%) ↗️
Grains correlation - watch for sector strength
ZS (Soybeans) - Current: $1,053.55 ↘️
Inverse correlation - weakness supports corn demand
ZO (Oats) - Monitor for broader grain sentiment
Dollar Index:
DXY (US Dollar Index) - Current: 97.93 ↘️
KEY INVERSE CORRELATION: Weaker dollar = bullish for commodities
Dollar at October 2025 lows supports corn rally
Energy:
CL (Crude Oil) - Watch ethanol production correlation
🌍 FUNDAMENTAL FACTORS (LATEST)
✅ BULLISH CATALYSTS:
1. Supply-Demand Dynamics (USDA WASDE Dec 2025):
📉 US corn ending stocks reduced to 2.029 billion bushels (-125 million bushels)
📈 Exports raised to 3.2 billion bushels (RECORD HIGH)
✅ Strong export pace exceeding 2024 records
2. Export Demand Surge:
US export sales reaching record levels to Mexico, Colombia and other buyers
Outstanding US sales and inspections pointing to faster shipments
Recent sales: 186,000 MT to unknown destinations
3. Ethanol Production at ALL-TIME HIGHS:
US ethanol output rose to record weekly levels
Increased feedstock demand tightening available supplies
4. Dollar Weakness:
DXY fell to 97.93 on December 23, 2025, down 9.49% over the last 12 months
Weaker USD makes US corn more competitive globally
5. Supply Chain Issues:
Ukrainian shipments running below a year ago because of harvest and logistical delays
Prompt physical supplies tightened outside the US
6. Brazilian Factors:
Brazilian sellers withholding inventory focusing on planting
Creates near-term supply gaps favoring US exports
⚠️ RISK FACTORS TO MONITOR:
1. Federal Reserve Policy:
Markets pricing in two quarter-point rate reductions in 2026
Affects dollar direction and commodity flows
2. China Purchase Commitments:
Monitor China's soybean purchases (affects corn indirectly)
Trade policy uncertainty with new administration
3. South American Weather:
Brazilian corn planting 97% complete
Watch for production updates (Jan 2026 WASDE)
4. Technical Resistance:
Price approaching June 2025 highs around $450
Strong resistance zone requires momentum confirmation
📊 UPCOMING ECONOMIC EVENTS TO WATCH:
USDA WASDE Report - January 12, 2026 ⭐
Weekly Export Sales - Every Thursday
CFTC Commitment of Traders - Weekly Friday releases
Fed Policy Decisions - Monitor rate cut timing
Brazilian Crop Progress - Ongoing through Q1 2026
💡 TRADING STRATEGY SUMMARY:
✅ Setup Type: Bullish SMA breakout with fundamental support
✅ Entry Method: Layered limit orders OR current market price
✅ Risk/Reward: Favorable with tight stop vs. extended target
✅ Timeframe: Swing trade (multi-day) or day trade (intraday moves)
✅ Confirmation: Export data + dollar weakness + supply tightening
⚠️ FINAL DISCLAIMER:
This analysis is for educational purposes only. I am NOT providing financial advice or recommendations. Every trader must:
✅ Conduct their own due diligence
✅ Use proper position sizing for their account
✅ Set stop losses based on their risk tolerance
✅ Take profits according to their trading plan
✅ TRADE AT YOUR OWN RISK
Past performance does not guarantee future results.
🔔 ENGAGEMENT:
👍 LIKE if you found this analysis helpful!
💬 COMMENT your thoughts and trade setups below
📊 FOLLOW for more commodity market analysis
Let's make profitable trades together, Thief OG's! 🚀
Cornfutures

CORN Bulls in Control? Retest Pullback Confirms Trend Bias🌽 CORN Institutional Edge Plan (Swing/Day Trade Setup)
🔍 Market Context
CORN (CFD on US Corn Futures) is showing signs of bullish momentum after testing a key resistance area. Institutional order flow hints at accumulation in the mid-420s region — a potential pullback zone before continuation higher.
🧭 Thief Strategy Plan — Layered Entries
This setup follows the “Thief Strategy”, a layered entry approach using multiple buy limit orders to capture volatility and improve average entry cost.
📈 Layered Buy Zones:
1️⃣ 428
2️⃣ 430
3️⃣ 432
(Traders may extend layers based on risk appetite and confirmation signals.)
🛑 Protective Stop (Thief SL): Around 424
🎯 Profit Zone (Thief TP): Around 445
🧠 Plan Insight
Expecting a resistance retest pullback to confirm the bullish structure.
Momentum aligns with higher-timeframe bias after institutional demand emerged near 420s.
Targets align with overbought resistance and prior liquidity traps — best to secure profits and protect gains as price nears 445.
💡 Note: Each trader should manage risk independently. This setup is educational only — showing how to structure a layered “Thief-style” plan, not a recommendation to buy/sell.
🔗 Correlated Assets to Watch
OANDA:WHEATUSD – Often mirrors agricultural flow shifts.
$SOYBEANUSD – Moves inversely at times; watch for divergence.
TVC:DXY – A stronger dollar can pressure commodity prices.
OANDA:SPX500USD – Risk appetite correlation; strong equities can support commodity demand.
🕵️♂️ Thief’s Key Notes
Dear Ladies & Gentlemen (Thief OG’s) — this plan shows how I structure entries, not where you should trade.
You can make money — then take money — at your own risk.
Manage your own stop-loss, target, and position sizing like a pro.
✨ “If you find value in my analysis, a 👍 and 🚀 boost is much appreciated — it helps me share more setups with the community!”
📜 Disclaimer:
This is a Thief-style trading strategy created just for fun and educational purposes.
Not financial advice. Trade responsibly.
#CORN #Commodities #Futures #InstitutionalTrading #SwingTrade #DayTrading #LayeredEntries #ThiefStrategy #SmartMoney #PriceAction #CommodityMarket #Agriculture #DXY #WHEAT #SOYBEAN #TradingView #ThiefTrader

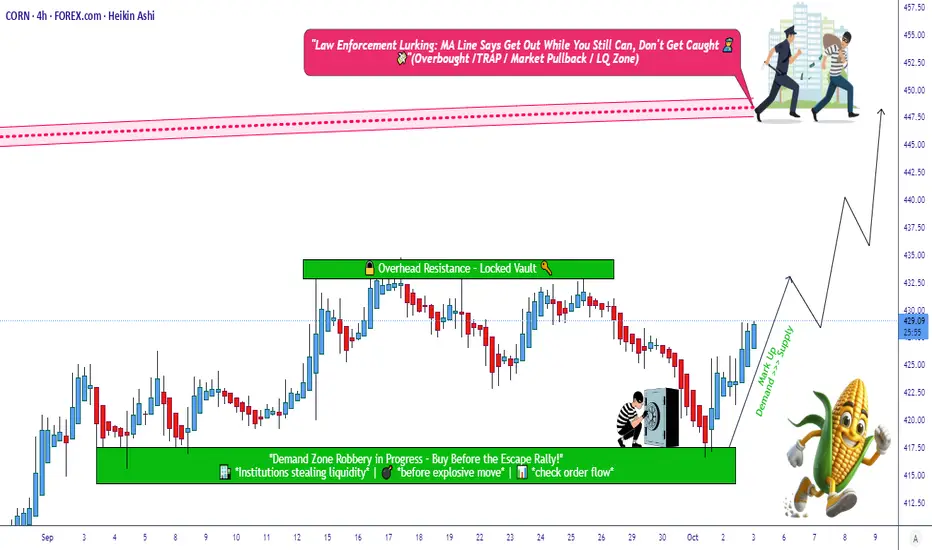
Corn Agro Market Strategy Map – Bullish Path Ahead!🚜🌽 CORN Agro Commodities Wealth Strategy Map (Swing/Day Trade)
📌 Plan: Bullish (Swing + Day Trade Setup)
✅ Market sentiment favors bullish bias in CORN.
🎯 Swing/Day traders can look for upside continuation until resistance zones.
🎯 Entry Plan (Layering Style Method)
🔑 You can enter at any price, but pullbacks are safer.
Layered Buy Limit Orders (multi-entry strategy):
🟢 417
🟢 420
🟢 422
🟢 425
🟢 427
📌 You can extend or add more layers depending on your personal risk appetite.
🛡️ Stop Loss (Protective Exit)
🚨 Thief SL is placed at 415.
📝 Note: This is my personal style. You can set your own SL depending on your strategy & risk comfort.
🎯 Target Levels (Profit Booking)
🏁 447 → Suggested take-profit zone.
🚔 450 = “Police Barricade” → Acts as a strong resistance + potential trap + overbought zone.
💡 Best practice: Exit at 447 before the heavy resistance wall to lock in profits.
🗣️ Important Note for Readers (Thief OG’s 🕶️)
🙏 This is not financial advice.
⚡ You are free to set your own TP/SL.
📌 I share my strategy map — you manage your own risk.
🏦 Market is open to everyone → take profits in your own style, at your own risk.
🔍 Key Insights & Market Correlations
🌾 Agro Commodity Correlations:
CORN often moves in relation to CAPITALCOM:WHEAT and $SOYBEAN.
Soft commodities like PEPPERSTONE:COFFEE can also reflect agro market sentiment.
💵 Currency Link (Dollar Impact):
TVC:DXY (US Dollar Index) plays a key role.
Stronger dollar = bearish pressure on commodities.
📈 Indices & Risk Sentiment:
Global equities ( CAPITALCOM:US30 , SP:SPX , NASDAQ:NDX ) indirectly influence commodities via sentiment.
⚡ Energy Connection:
NSE:OIL & FX:NGAS affect input costs → higher energy = higher agro costs.
Farmers & supply chains react, impacting commodity pricing.
📊 Related Pairs to Watch
🌽 CAPITALCOM:CORN
🌾 CAPITALCOM:WHEAT
CAPITALCOM:SOYBEAN
☕ PEPPERSTONE:COFFEE
🛢️ NSE:OIL
💵 TVC:DXY
📊 CAPITALCOM:US30 / SP:SPX / NASDAQ:NDX
✨ “If you find value in my analysis, a 👍 and 🚀 boost is much appreciated — it helps me share more setups with the community!”
⚠️ Disclaimer: This is a thief-style trading strategy, designed for fun and community sharing. Not financial advice. Please trade responsibly and at your own risk.
#CORN #AgroCommodities #SwingTrade #DayTrading #TradingStrategy #LayeringStrategy #MarketAnalysis #WHEAT #SOYBEAN #COFFEE #DXY #US30 #SPX #Commodities
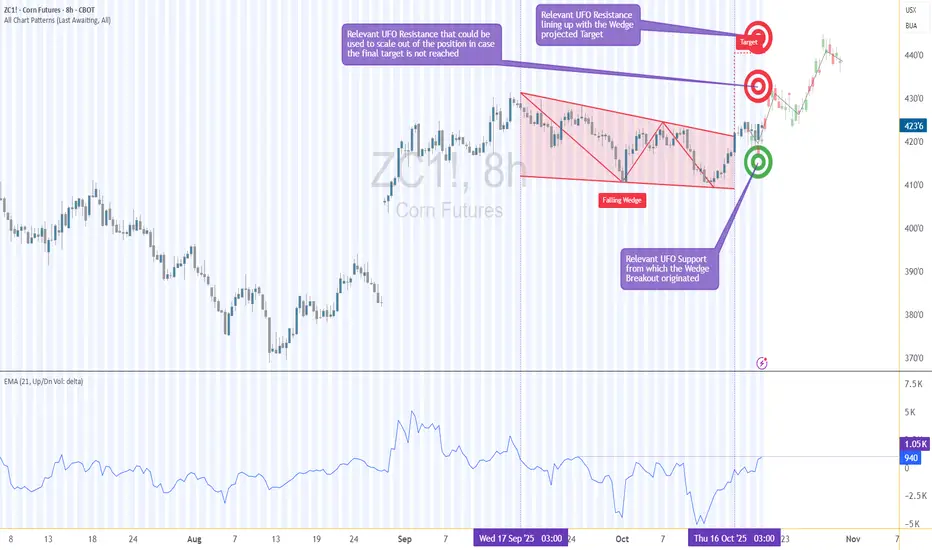
Breakout or Fake-Out — Corn’s Price Action Under the Microscope1. When Breakouts Lie
Few things in trading are more exciting than a clean breakout. But for every breakout that soars, there’s another that fakes out and traps eager traders.
Corn Futures (ZC) on the 8-hour chart just gave us that classic test — a breakout from a falling wedge that has traders asking: Is this the real thing, or another false alarm?
The pattern looks textbook. Price compressed lower within a wedge and broke above its upper trendline. However, the true strength of any breakout lies not in the pattern itself, but in the story told by volume and order flow. That’s what we’ll unpack in this article — using ZC (Corn Futures) and MZC (Micro Corn Futures) as our guide.
2. The Falling Wedge in Focus
Falling wedges often represent market exhaustion, where selling pressure slows and buyers quietly begin to accumulate positions. On the Corn Futures 8-hour chart, price has indeed pushed beyond the wedge’s descending resistance line — the visual signal that usually excites breakout traders.
But structure alone doesn’t make a sustainable move. Beneath the surface, the UFO support and resistance levels — zones of UnFilled Orders — provide the invisible scaffolding that can support or reject price movement.
In this case:
Support Zone: 418–411
Resistance Levels: 430 and 442
These areas represent pending potential new support and resistance areas where buy and sell orders that can act as launchpads or barriers. The key is to see how the market interacts with them while volume builds or fades.
3. The Volume Delta Story
Here’s where things get interesting.
Volume Delta — the difference between buy and sell volume — shows us who’s winning the tug-of-war between buyers and sellers.
During the wedge formation, the maximum delta reached +1.05K, indicating meaningful buying activity despite the downtrend. But as the breakout unfolded, delta turned slightly negative. In plain terms, fewer new buyers are stepping in — and without new buying energy, breakouts often lose traction.
That’s a classic setup for a potential fake-out: price pokes above the wedge, but order flow doesn’t confirm. This mismatch between technical breakout and volume delta is often the canary in the coal mine for fading momentum.
4. The Trade Logic — Let the Market Come to You
Instead of chasing the breakout, the smarter play here could be to wait for the market to revisit demand/support.
Why? Because that’s where new volume tends to enter — where pending buy orders (the UFOs) become filled, strengthening the delta and giving the move fresh fuel.
A potential plan might look like this:
Entry: 418 (within support)
Stop-Loss: 411 (below the zone)
Target 1: 430 (first resistance, partial exit)
Target 2: 442 (final resistance, full exit)
This setup maintains a clear reward-to-risk ratio above 3:1, assuming disciplined execution and volatility-adjusted sizing. It’s not about prediction — it’s about preparation. Waiting for retracement allows participation in a confirmed move, rather than reacting to emotional excitement at the breakout.
5. Contract Specifications & Margin Requirements
Understanding your instrument is as important as reading your chart.
Here’s what traders should know about these CME-listed Corn contracts:
ZC – Corn Futures (Standard Contract)
Contract Size: 5,000 bushels
Tick Size: ¼ cent per bushel (0.0025) → Tick Value = $12.50
Approx. Margin: Around $1,000 USD, varying by broker and volatility
MZC – Micro Corn Futures
Contract Size: 500 bushels (1/10th of ZC)
Tick Size: ½ cent per bushel (0.0050) → Tick Value = $2.50
Approx. Margin: Around $100 USD, varying by broker and subject to market conditions
Micro contracts allow smaller-scale traders to apply the same analysis and structure as the full-size contract, but with controlled risk exposure — a major advantage for capital management.
6. When New Volume is Injected in the Market
Think of Volume Delta as a glance in the rear-view mirror — it tells us what’s already been filled. On the other hand, analyzing support and resistance levels with the idea of where new unfilled orders might come in helps us prepare to enter trades just before momentum potentially reactivates.
When both are combined:
Rising delta confirms a healthier follow-through on breakouts.
Negative delta near resistance warns of a likely fading move.
Key support and resistance zones show where resting orders could inject new volume.
7. Risk Management — Protect Before You Project
Every solid trade plan starts with a stop.
For this setup, a logical stop below 411 ensures protection if the wedge breakout fails completely.
Scaling out at 430 reduces exposure early, locking gains in case the move stalls.
Always size positions relative to account equity and volatility — the most underrated edge in trading is survival.
The best traders don’t just hunt profits — they hunt consistency. Managing risk transforms a potentially stressful market environment into a structured decision process.
8. CME Context & Final Thoughts
Both ZC and MZC are cornerstone agricultural contracts traded on the CME Group’s CBOT exchange, giving traders exposure to one of the world’s most economically significant commodities.
While the setup we’ve explored is a case study, the takeaway extends beyond Corn:
Breakouts need participation. Volume confirms conviction. Key support and resistance levels reveal intention.
In markets where fake-outs are common, aligning technical structure, order flow, and patient trade planning gives traders the clearest edge of all — confidence grounded in data, not emotion.
When charting futures, the data provided could be delayed. Traders working with the ticker symbols discussed in this idea may prefer to use CME Group real-time data plan on TradingView: www.tradingview.com - This consideration is particularly important for shorter-term traders, whereas it may be less critical for those focused on longer-term trading strategies.
General Disclaimer:
The trade ideas presented herein are solely for illustrative purposes forming a part of a case study intended to demonstrate key principles in risk management within the context of the specific market scenarios discussed. These ideas are not to be interpreted as investment recommendations or financial advice. They do not endorse or promote any specific trading strategies, financial products, or services. The information provided is based on data believed to be reliable; however, its accuracy or completeness cannot be guaranteed. Trading in financial markets involves risks, including the potential loss of principal. Each individual should conduct their own research and consult with professional financial advisors before making any investment decisions. The author or publisher of this content bears no responsibility for any actions taken based on the information provided or for any resultant financial or other losses.
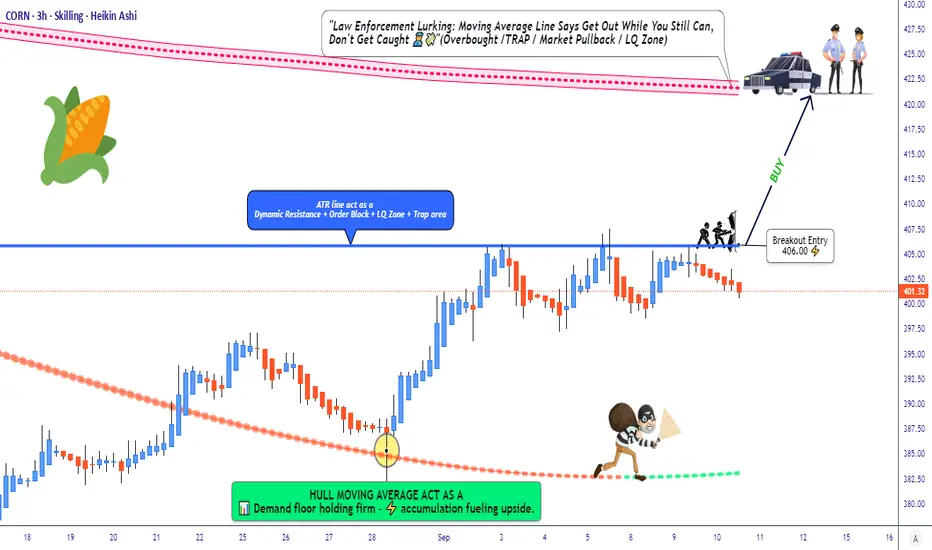
CORN Setup: Is This The Bullish Breakout We've Been Waiting For?🌽 CORN CFD | Money Heist Plan 🎭 (Swing / Day Trade)
🔑 Trading Plan (Thief Style Strategy)
Entry (Breakout Trigger): 📈 406.00 — when candle breaks ATR resistance, bullish plan activates.
Layering Entries (Thief Method):
Buy Limit Layers: 400.0 | 402.0 | 405.0 | 407.0 | 410.0 (flexible — adjust/add more based on breakout confirmation).
Layering helps manage entries & average position smartly.
Stop Loss (Thief’s Safety Lock): @ 395.00 🛑 after breakout trigger.
⚠️ Adjust SL based on your own risk tolerance.
Target (Escape Point): 🎯 421.00
Resistance zone + overbought condition = “police barricade” (take profits before getting trapped).
🌍 Why This Plan? | Thief Technical + Macro/Fundamental Mix
📊 Technical Edge
ATR breakout level at 406.00 ⚡
Momentum build-up near resistance, potential squeeze if volume spikes.
Layered entries provide risk-managed exposure.
🌽 CORN Market Data (10 Sep 2025)
Daily Change: -1.05% 🔴
Monthly Performance: +3.13% 🟢
Yearly Performance: -1.90% 🔴
👥 Investor Sentiment
Retail: 45% Long 😊 | 55% Short 😟 (slightly bearish bias).
Institutions: Net short 91,487 contracts 🏦 (hedging against oversupply).
😨 Fear & Greed Index
Score: 51/100 (Neutral 😐)
Balance between fear (supply risks) vs greed (demand resilience).
📉 Fundamentals & Macro Score
Supply Side
Record US production: 16.7B bushels 🟢
Brazil’s harvest adds oversupply pressure 🔴
Crop diseases (Tar Spot & Southern Rust) hurting yields 🔴
Demand Side
Exports YTD: +46.8% 🌍
Ethanol production: 1.105M barrels/day ⛽ (+30k WoW) 🟢
Tariff risks (China/Mexico) could slow trade 🔴
Macro Score: 6/10 → Moderately Bullish
🎯 Market Outlook Summary
Bull Case (Long) ✅
Strong exports (+28.6% YTD)
Biofuel/ethanol demand supporting floor
Technical rebound chances
Bear Case (Short) ❌
Record harvests (US/Brazil/Ukraine) = oversupply
Institutions scaling up shorts
Global glut risks
📌 Outlook Bias: Bearish-to-Neutral 🐻⚖️
Short-term pressure from supply glut, but demand stabilizes downside.
📌 Key Takeaways for Traders
Breakout Watch: 406.00 🚨
Layered Entry: Manage risk via staggered buys.
Target Zone: 421.00 (book profits before trap).
Macro Mix: Demand solid but supply risks dominate.
Watch List: CAPITALCOM:CORN , CBOT:ZS1! (Soybeans), CBOT:ZW1! (Wheat), CBOT:ZC1! (Corn Futures)
🔗 Pairs to Watch (in USD)
AMEX:SOYB (Soybeans CFD): Moves in lockstep with CORN due to shared ag trends.
AMEX:WEAT (Wheat CFD): Grains often trend together—keep an eye out!
TVC:USOIL : Influences ethanol demand, impacting CORN indirectly.
TVC:DXY (US Dollar Index): A rising USD could pressure commodity prices.
✨ “If you find value in my analysis, a 👍 and 🚀 boost is much appreciated — it helps me share more setups with the community!”
#CORN #Commodities #SwingTrade #DayTrade #ThiefStrategy #MoneyHeistPlan #Futures #LayeringStrategy #BreakoutTrading #Agriculture #Ethanol #TradingCommunity
Long Corn📌 When is Corn in High Demand & How Does It Cycle Internationally?
Corn demand follows a seasonal and geographical cycle based on harvest seasons, global weather patterns, livestock feed demand, and ethanol production. Smart traders can rotate between corn-producing nations and their related stocks to profit from month-to-month price cycles.
🔹 1. When is Corn Demand Highest? (Bullish for Corn Prices & Stocks)
✅ Q3-Q4 (August – November) → U.S. Harvest Season & Export Surge
The U.S. is the largest corn producer (~35% of global supply).
After harvest, exports peak as major buyers (China, Mexico, Japan) purchase new supplies.
Corn prices tend to be highest in August-October before harvest completion.
📌 Example:
August 2021: Drought fears + high ethanol demand pushed corn to $7.50 per bushel.
✅ Q1-Q2 (January – June) → South American Corn Season (Brazil & Argentina)
Brazil (2nd largest producer) harvests corn in March-May (Safrinha season).
Argentina’s harvest peaks between February-April.
If South America faces droughts or floods, corn prices spike.
📌 Example:
2023: Argentina’s corn suffered drought → Global corn prices rallied 20%.
✅ Year-Round Demand Drivers:
1️⃣ Livestock Feed Demand (Peaks in Winter) → Q4-Q1 Boost
Cattle, poultry, and pork require corn-based feed.
High demand in winter months (Q4-Q1) when animals need extra feed.
2️⃣ Ethanol Demand (Peaks in Summer) → Q2-Q3 Boost
40% of U.S. corn is used for ethanol production.
Gasoline demand peaks in summer, boosting ethanol & corn demand.
📌 Example:
2022: Ethanol demand surge → Corn hit $8 per bushel in summer.
🔹 2. How Corn Production Cycles from Nation to Nation (Month-to-Month Trade Strategy)
Corn rotates in a global cycle, allowing traders to switch from one producer to another month by month.
Month Primary Corn Producer Trade Focus (Buy Stocks/ETFs)
Jan-Feb Argentina 🇦🇷 (Early Harvest) Buy AGRO (Adecoagro), CRESY (Cresud)
Mar-Apr Argentina 🇦🇷 & Brazil 🇧🇷 (Peak Harvest) Buy BG (Bunge), ADM (Archer Daniels Midland)
May-Jun Brazil 🇧🇷 (Safrinha Harvest) Buy BG (Bunge), AGRO (Adecoagro)
Jul-Aug U.S. 🇺🇸 (Growing Season – Weather Risk) Buy CORN ETF, CARGILL (Private), ADM
Sep-Oct U.S. 🇺🇸 (Harvest Season) Buy MOS (Mosaic), NTR (Nutrien – Fertilizer)
Nov-Dec U.S. 🇺🇸 & South America 🇦🇷🇧🇷 (Planting) Buy DE (John Deere), AGCO (Agricultural Equipment)
📌 Example:
May 2023: Brazil’s Safrinha crop had record output → Bunge (BG) stock surged 15%.
🔹 3. Best Corn Producer Stocks to Trade Internationally
To profit from corn’s cyclic production, traders should rotate investments between these key stocks:
🌎 U.S. Corn-Related Stocks
✅ Archer Daniels Midland (ADM) – Major global corn trader.
✅ Bunge (BG) – Leading U.S. exporter, strong in Brazil.
✅ Mosaic (MOS) – Fertilizer supplier (benefits from rising corn planting).
✅ Nutrien (NTR) – Largest global supplier of potash (key for corn yields).
📌 Best Time to Buy: July-October (U.S. Harvest & Peak Demand).
🌎 Brazil & Argentina Corn Stocks
✅ Adecoagro (AGRO) – Argentinian agriculture firm (corn & ethanol).
✅ Cresud (CRESY) – Major Argentinian farmland owner (corn, soy).
✅ São Martinho (SMTO3.SA) – Brazilian corn & sugarcane giant.
✅ Bunge (BG) – Strong presence in Brazil’s corn & soybean markets.
📌 Best Time to Buy: January-June (South American Harvest & Exports).
🌎 Fertilizer & Agricultural Machinery Stocks
✅ John Deere (DE) – Sells farming equipment for corn production.
✅ AGCO (AGCO) – Provides tractors & grain equipment.
✅ CF Industries (CF) – Top nitrogen fertilizer supplier for corn.
📌 Best Time to Buy: November-February (Planting Season).
📌 Conclusion: Best Corn Trading Strategy
✅ Buy U.S. Corn Stocks (ADM, BG, MOS) from July to October (Harvest & Ethanol Demand).
✅ Buy South American Corn Stocks (AGRO, CRESY, BG) from January to June (Brazil & Argentina Harvest).
✅ Rotate into Fertilizer & Equipment Stocks (DE, AGCO, CF) in November-February (Corn Planting Season).
Seasonality:
Corn futures have been noted to perform better during the months of January, February, April, May, October, November, and December than during the months of July, August, and September (Summer).
Agriculture futures offer a vast array of hedging and speculative opportunities, and Corn is one of the most highly traded commodities globally. Also known as maize, corn is widely cultivated in countless varieties throughout the world. Corn futures trading requires in-depth knowledge of the commodity, as well as a thoroughly researched futures strategy.
The corn market is, of course, heavily dependent on the corn yield and harvest. According to information available on the web, the World Agricultural Supply and Demand Estimate (WASDE) publishes an estimated crop yield of corn and this obviously makes a huge impact on the price of corn. The organization makes a pretty good forecast of the crops.
Corn Strategy:
Trading Rules
Long corn futures at the close of March.
Close the long position and sell short at the close of May.
Cover the short position and go long at the close of September.
Close the long position and sell short at the close of February.
Note: Longing is easier than shorting.
News:
The factors that move the corn market include weather conditions in the major growing regions and key corn production and supply reports, such as the USDA World Agricultural Supply and Demand Estimate (WASDE) Report, the USDA Prospective Planting Report, Grain Stocks Reports, and Crop Production Reports. Another factor is the lower demand from China.

CORN Heist: Steal Short Profits Before Bulls React!🚨 CORN HEIST ALERT: Bearish Raid Ahead! 🚨 Swipe the Loot Before Cops Arrive! 🌽🔻
🌟 Attention, Market Bandits & Profit Pirates! 🌟
🔥 Thief Trading Intel Report 🔥
The 🌽 CORN CFD market is setting up for a bearish heist—time to short-swipe the loot before the bulls rally their defenses! Police barricade (resistance) is holding strong, but oversold conditions + consolidation hint at a trend reversal trap. High-risk, high-reward—just how we like it!
🎯 Heist Strategy (Swing/Day Trade)
Entry (Bearish Raid) 🏴☠️
"Vault’s unlocked! Swipe shorts at any price—OR set sell limits *near 15M/30M pullbacks for a cleaner steal!"*
Stop Loss (Escape Route) 🛑
Thief’s SL at nearest 4H swing high (4.170)—adjust based on your risk tolerance & lot size.
Pro Tip: Tighten SL if trading multiple orders!
Target (Profit Escape) 🎯
3.920 (or bail early if cops (bulls) show up!)
🌽 Market Snapshot: Why CORN is Ripe for a Raid
Neutral trend leaning bearish—consolidation breakout likely!
Key Drivers:
Macro pressure (USD strength, crop reports)
COT data hinting at big players positioning short
Seasonal trends favoring downside
Want full intel? 🔍 Check COT reports & intermarket analysis!
🚨 Trading Alerts (Avoid the Cops!)
News = Volatility Trap! 📰🚔
Avoid new trades during high-impact news.
Trailing stops to lock profits on running heists!
💥 Boost This Heist! 💥
"Like & boost this idea to fuel our next raid! More steals = more profits for the gang! 🏴☠️💰
Stay tuned—another heist drops soon! 🚀🤝
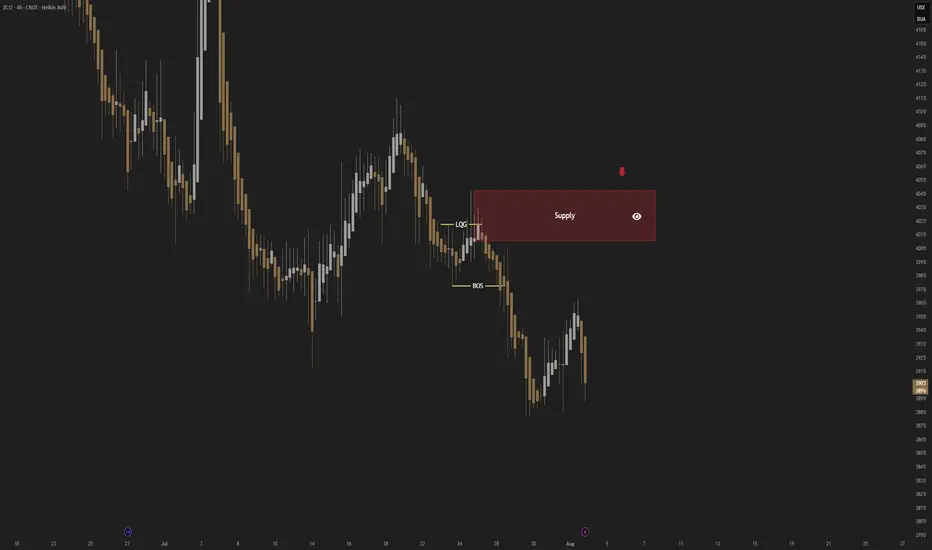
CORN; Heikin Ashi Trade Idea📈 Hey Traders!
Here’s a fresh outlook from my trading desk. If you’ve been following me for a while, you already know my approach:
🧩 I trade Supply & Demand zones using Heikin Ashi chart on the 4H timeframe.
🧠 I keep it mechanical and clean — no messy charts, no guessing games.
❌ No trendlines, no fixed sessions, no patterns, no indicator overload.
❌ No overanalyzing market structure or imbalances.
❌ No scalping, and no need to be glued to the screen.
✅ I trade exclusively with limit orders, so it’s more of a set-and-forget style.
✅ This means more freedom, less screen time, and a focus on quality setups.
✅ Just a simplified, structured plan and a calm mindset.
💬 Let’s Talk:
💡Do you trade supply & demand too ?
💡What’s your go-to timeframe ?
💡Ever tried Heikin Ashi ?
📩 Got questions about my strategy or setup? Drop them below — ask me anything, I’m here to share.
Let’s grow together and keep it simple. 👊
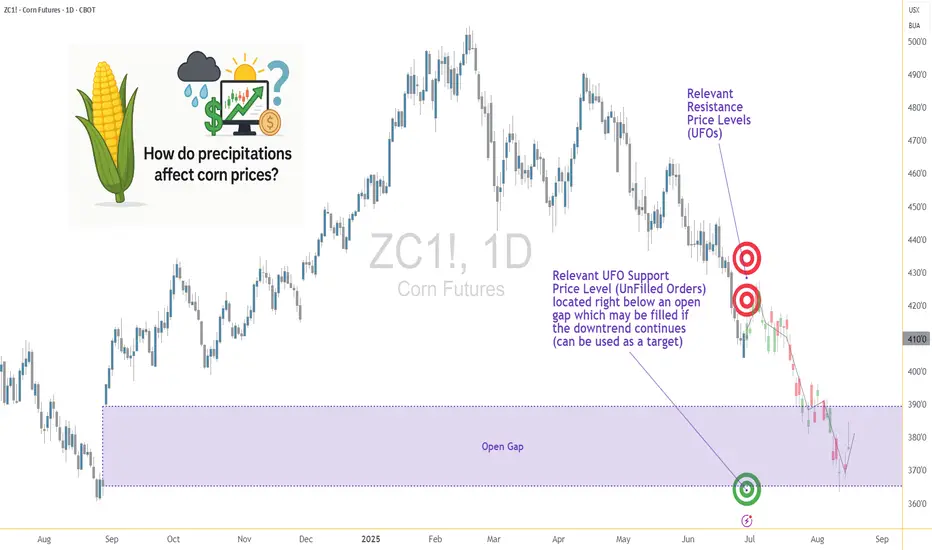
Weather and Corn: Understanding the Precipitation Factor1. Introduction: Rain, Grain, and Market Chain Reactions
In the world of agricultural commodities, few forces carry as much weight as weather — and when it comes to corn, precipitation is paramount. Unlike temperature, which can have nuanced and sometimes ambiguous effects depending on the growth stage, rainfall exerts a more direct and consistent influence on crop performance. For traders, understanding the role of rainfall in shaping market sentiment and price behavior isn't just an agricultural curiosity — it's a trading edge.
This article unpacks the relationship between weekly rainfall levels and corn futures prices. By leveraging normalized weather data and historical returns from Corn Futures (ZC), we aim to translate weather signals into actionable market insights. Whether you're managing large agricultural positions or exploring micro futures like MZC, precipitation patterns can provide vital context for your trades.
2. Corn’s Moisture Dependency
Corn is not just sensitive to water — it thrives or suffers because of it. From the moment seeds are planted, the crop enters a delicate dance with precipitation. Too little moisture during the early stages can impair root development. Too much during germination may lead to rot. And during pollination — particularly the tasseling and silking stages — insufficient rainfall can cause the plant to abort kernels, drastically reducing yield.
On the other hand, excessive rainfall isn't necessarily beneficial either. Prolonged wet periods can saturate soil, hinder nutrient uptake, and encourage fungal diseases. Farmers in the U.S. Corn Belt — particularly in states like Iowa, Illinois, and Nebraska — know this well. A single unexpected weather shift in these regions can send ripple effects across global markets, causing speculators to reassess their positions.
For traders, these weather events aren’t just environmental footnotes — they are catalysts that influence prices, volatility, and risk sentiment. And while annual production is important, it's the week-to-week rhythm of the growing season where short-term trades are born.
3. Our Data-Driven Approach: Weekly Rainfall and Corn Returns
To understand how rainfall impacts price, we collected and analyzed decades of historical weather and futures data, aligning weekly precipitation totals from major corn-growing regions with weekly returns from Corn Futures (ZC).
The weather data was normalized using percentiles for each location and week of the year. We then assigned each weekly observation to one of three precipitation categories:
Low rainfall (<25th percentile)
Normal rainfall (25th–75th percentile)
High rainfall (>75th percentile)
We then calculated the weekly percent change in corn futures prices and matched each return to the rainfall category for that week. The result was a dataset that let us measure not just general trends but statistically significant shifts in market behavior based on weather. One key finding stood out: the difference in returns between low-rainfall and high-rainfall weeks was highly significant, with a p-value of approximately 0.0006.
4. What the Numbers Tell Us
The results are striking. During low-rainfall weeks, corn futures often posted higher average returns, suggesting that the market responds to early signs of drought with anticipatory price rallies. Traders and institutions appear to adjust positions quickly when weather models hint at below-normal moisture during key growth stages.
In contrast, high-rainfall weeks displayed lower returns on average — and greater variability. While rain is essential, excess moisture raises fears of waterlogging, planting delays, and quality issues at harvest. The futures market, ever forward-looking, seems to price in both optimism and concern depending on the volume of rain.
Boxplots of these weekly returns reinforce the pattern: drier-than-usual weeks tend to tilt bullish, while wetter periods introduce uncertainty. For discretionary and algorithmic traders alike, this insight opens the door to strategies that incorporate weather forecasts into entry, exit, and risk models.
📊 Boxplot Chart: Weekly corn futures returns plotted against precipitation category (low, normal, high). This visual helps traders grasp how price behavior shifts under varying rainfall conditions.
5. Strategy: How Traders Can Position Themselves
With the clear statistical link between rainfall extremes and price behavior in corn futures, the logical next step is applying this insight to real-world trading. One straightforward approach is to incorporate weather forecast models into your weekly market prep. If a key growing region is expected to receive below-normal rainfall, that could serve as a signal for a potential bullish bias in the upcoming trading sessions.
This doesn’t mean blindly buying futures on dry weeks, but rather layering this data into a broader trading thesis. For example, traders could combine weather signals with volume surges, technical breakouts, or news sentiment to form confluence-based setups. On the risk management side, understanding how price behaves during extreme weather periods can inform smarter stop-loss placements, position sizing, or even the use of option strategies to protect against unexpected reversals.
Additionally, this information becomes particularly valuable during the planting and pollination seasons, when the corn crop is most vulnerable and the market reacts most strongly. Knowing the historical patterns of price behavior in those weeks — and aligning them with current forecast data — offers a clear edge that fundamental and technical analysis alone may not reveal.
🗺️ Global Corn Map Screenshot: A world map highlighting major corn-growing regions with weather overlay. This helps illustrate the geographic variability in rainfall and how it intersects with key production zones.
6. Corn Futures Contracts: Speculating with Flexibility
For traders looking to act on this kind of seasonal weather intelligence, CME Group provides two practical tools: the standard-size Corn Futures contract (ZC) and the Micro Corn Futures contract (MZC).
Here are some quick key points to remember:
Tick size for ZC is ¼ cent (0.0025) per bushel, equating to $12.50 per tick.
For MZC, each tick is 0.0050 equating to $2.50 per tick.
Standard ZC initial margin is approximately $1,000 and MZC margins are around $100 per contract, though this can vary by broker.
Micro contracts are ideal for those who want exposure to corn prices without the capital intensity of full-size contracts. They’re especially helpful for weather-based trades, where your thesis may rely on shorter holding periods, rapid scaling, or position hedging.
7. Conclusion: Rain’s Role in the Corn Trade
Precipitation isn’t just a farmer’s concern — it’s a trader’s opportunity. Our analysis shows that weather data, especially rainfall, has a statistically significant relationship with corn futures prices. By normalizing historical precipitation data and matching it to weekly returns, we uncovered a clear pattern: drought stress tends to lift prices, while excessive moisture creates volatility and downside risk.
For futures traders, understanding this dynamic adds another layer to market analysis.
As part of a broader series, this article is just one piece of a puzzle that spans multiple commodities and weather variables. Stay tuned for our upcoming releases, where we’ll continue exploring how nature’s forces shape the futures markets.
When charting futures, the data provided could be delayed. Traders working with the ticker symbols discussed in this idea may prefer to use CME Group real-time data plan on TradingView: www.tradingview.com - This consideration is particularly important for shorter-term traders, whereas it may be less critical for those focused on longer-term trading strategies.
General Disclaimer:
The trade ideas presented herein are solely for illustrative purposes forming a part of a case study intended to demonstrate key principles in risk management within the context of the specific market scenarios discussed. These ideas are not to be interpreted as investment recommendations or financial advice. They do not endorse or promote any specific trading strategies, financial products, or services. The information provided is based on data believed to be reliable; however, its accuracy or completeness cannot be guaranteed. Trading in financial markets involves risks, including the potential loss of principal. Each individual should conduct their own research and consult with professional financial advisors before making any investment decisions. The author or publisher of this content bears no responsibility for any actions taken based on the information provided or for any resultant financial or other losses.
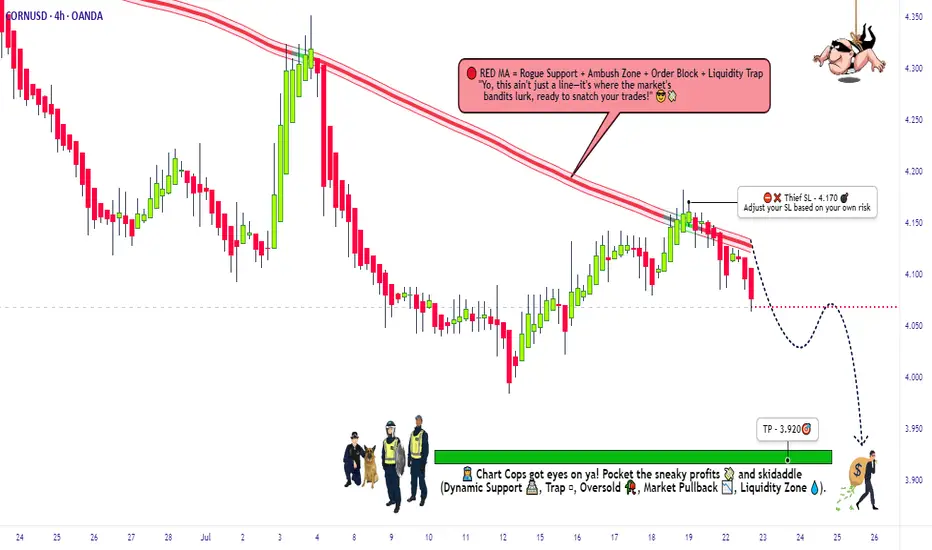
THE GREAT CORN GRAB! (Bearish CFD Heist)🌽 THE CORN HEIST: Bearish Raid Plan (Swing/Day Trade) 🚨💰
🌟 Attention, Market Robbers & Money Makers! 🌟
(Hola! Oi! Bonjour! Hallo! Marhaba!)
🔥 Based on the ruthless Thief Trading Style (TA + FA), we’re plotting a bearish heist on the CORN Commodities CFD Market! Time to short like a bandit and escape with profits before the bulls catch us! 🏴☠️💸
🎯 MASTER HEIST PLAN (BEARISH RAID)
Entry Point (Sell Limit / Market):
"The vault is open—swipe the bearish loot at any price!"
🔹 *For safer heists, set sell limits near pullbacks (15M/30M).*
Stop Loss (Escape Route):
📌 Thief SL at nearest swing high (1D timeframe) – 4.4000
📌 Adjust SL based on risk, lot size, & multiple orders.
Profit Target (Escape Before Cops Arrive):
🎯 4.1000 (or exit early if the trap snaps shut!)
🌽 MARKET TREND: NEUTRAL (BEARISH OPPORTUNITY!)
Consolidation zone = Thief’s playground!
Oversold? Maybe. But the real trap is where bullish robbers get slaughtered.
High risk = High reward—only for cold-blooded traders!
📡 FUNDAMENTAL INTEL (DON’T SKIP THIS!)
🔗 Get full reports (COT, Macro, Seasonals, Sentiment, Intermarket Analysis) in our bio0!
🚨 TRADING ALERT: NEWS = DANGER ZONE!
❌ Avoid new trades during news!
🔐 Use trailing stops to lock profits & escape alive!
💥 BOOST THIS HEIST! (HELP US ROB THE MARKET!)
🔥 Hit LIKE & FOLLOW to strengthen our robbery squad!
💸 More heists = More profits. Stay tuned for the next raid!
🐱👤 See you in the shadows, bandits! 🤑🚀

ZCU25 CORN... It ALWAYS comes down to cornAND I'M BACK AND DUMBER THAN EVER
Listen up Honkies, this trade has a 93% probability based on the historical data over the last 30 years. So I bet Muhammad my 3rd ex-wife and a half of my second step child. The reason this trade works is easy! We all have felt and understand FUD (Fear, Uncertainty, and Doubt) and how the market reacts, I understood this on my second ex-wife when she got a boyfriend. So in late June pollination season occurs with corn and the yield is unknown for the next year, this is a very simple way of looking at the agricultural industry and how the market corrects. The trade is set up in two stages in order to maximize profit. The first stage, with the FUD in pollination season typically results in a 15-20% drop, I split the difference at 17% lets make it easier than my first divorce. This usually occurs around June 26th and can extend to July 17th. Around July 15th to the 20th the projected yield is shared and the market recorrects to the upside as the numbers represented due to the FUD don't represent the price action in the futures market, and because the futures market is speculatory (Adult Gambling) the degens will pump the contracts up looking for a quick buck like my third wife. Now in order to not go broke while you're trying to buy your ex wife's boyfriend's son a new car, you need to hedge the contract in a calendar spread aka intra-commodity spread, so do the opposite in combination on the march 2026 corn contract as the maintance is lower and the price action isn't there due to open interest in the market, so let that contract ride if it goes against you. SO! you short the ZCU25 while longing the ZCH26, then offset the contracts when direction changes and long ZCU25 and short ZCH26, it's as easy as 1,2,8. Had to repost this forgot the Tags my bad.
"all I need is one trade to pay all the alimony for this year."
-KewlKat

Weather and Corn: A Deep Dive into Temperature Impact1. Introduction: Corn and Climate – An Inseparable Relationship
For traders navigating the corn futures market, weather isn't just a background noise—it's a market mover. Few agricultural commodities are as sensitive to environmental variables as corn, especially temperature. Corn is grown across vast regions, and its development is directly tied to how hot or cold the season plays out. This makes weather not just a topic of interest but a core input in any corn trader’s playbook.
In this article, we go beyond conventional wisdom. Instead of simply assuming “hotter equals bullish,” we bring data into the equation—weather data normalized by percentile, matched with price returns on CME Group's corn futures. The results? Useful for anyone trading ZC or MZC contracts.
2. How Temperature Affects Corn Physiology and Yields
At the biological level, corn thrives best in temperatures between 77°F (25°C) and 91°F (33°C) during its growth stages. During pollination—a critical yield-defining window—extreme heat (especially above 95°F / 35°C) can cause irreversible damage. When hot weather coincides with drought, the impact on yields can be catastrophic.
Historical drought years like 2012 and 1988 serve as powerful examples. In 2012, persistent heat and dryness across the US Midwest led to a national yield drop of over 25%, sending futures skyrocketing. But heat doesn't always spell disaster. Timing matters. A heat wave in early June may have little impact. That same wave during tasseling in July? Major consequences.
3. The Market Mechanism: How Traders Respond to Temperature Surprises
Markets are forward-looking. Futures prices don’t just reflect today’s weather—they reflect expectations. A dry June may already be priced in by the time USDA issues its report. This dynamic creates an interesting challenge for traders: separating noise from signal.
During July and August—the critical reproductive phase—temperature updates from NOAA and private forecasters often trigger major moves. Rumors of an incoming heat dome? Corn futures might gap up overnight. But if it fizzles out, retracements can be just as dramatic. Traders who rely on headlines without considering what’s already priced in are often late to the move.
4. Our Analysis: What the Data Reveals About Corn and Temperature
To cut through the fog, we performed a percentile-based analysis using decades of weather and price data. Rather than looking at raw temperatures, we classified each week into temperature “categories”:
Low Temperature Weeks: Bottom 25% of the historical distribution
Normal Temperature Weeks: Middle 50%
High Temperature Weeks: Top 25%
We then analyzed weekly percentage returns for the corn futures contract (ZC) in each category. The outcome? On average, high-temperature weeks showed higher volatility—but not always higher returns. In fact, the data revealed that some extreme heat periods were already fully priced in, limiting upside.
5. Statistically Significant or Not? T-Tests and Interpretation
To test whether the temperature categories had statistically significant impacts on weekly returns, we ran a t-test comparing the “Low” vs. “High” temperature groups. The result: highly significant. Corn returns during high-temperature weeks were, on average, notably different than those during cooler weeks, with a p-value far below 0.01 (4.10854357245787E-13).
This tells us that traders can't ignore temperature anomalies. Extreme heat does more than influence the narrative—it materially shifts price behavior. That said, the direction of this shift isn't always bullish. Sometimes, high heat correlates with selling, especially if it’s viewed as destructive beyond repair.
6. Strategic Takeaways for Corn Traders
Traders can use this information in several ways:
Anticipatory Positioning: Use temperature forecasts to adjust exposure ahead of key USDA reports.
Risk Management: Understand that volatility spikes in extreme temperature conditions and plan stops accordingly.
Calendar Sensitivity: Prioritize weather signals more heavily in July than in May, when crops are less vulnerable.
Combining weather percentile models with weekly return expectations can elevate a trader’s edge beyond gut feel.
7. CME Group Corn Futures and Micro Corn Contracts
Corn traders have options when it comes to accessing this market. The flagship ZC futures contract from CME Group represents 5,000 bushels of corn and is widely used by commercial hedgers and speculators alike. For those seeking more precision or lower capital requirements, the recently launched Micro Corn Futures (MZC) represent just 1/10th the size.
This fractional sizing makes temperature-driven strategies more accessible to retail traders, allowing them to deploy seasonal or event-based trades without excessive risk exposure.
Here are some quick key points to remember:
Tick size for ZC is ¼ cent (0.0025) per bushel, equating to $12.50 per tick.
For MZC, each tick is 0.0050 equating to $2.50 per tick.
Standard ZC initial margin is approximately $1,000 and MZC margins are around $100 per contract, though this can vary by broker.
8. Wrapping Up: Temperature's Role in a Complex Equation
While temperature is a key driver in corn futures, it doesn't act in isolation. Precipitation, global demand, currency fluctuations, and government policies also play crucial roles. However, by quantifying the impact of extreme temperatures, traders gain a potential edge in anticipating market behavior.
Future articles will expand this framework to include precipitation, international weather events, and multi-variable models.
This article is part of a broader series exploring how weather impacts the corn, wheat, and soybean futures markets. Stay tuned for the next release, which builds directly on these insights.
When charting futures, the data provided could be delayed. Traders working with the ticker symbols discussed in this idea may prefer to use CME Group real-time data plan on TradingView: www.tradingview.com - This consideration is particularly important for shorter-term traders, whereas it may be less critical for those focused on longer-term trading strategies.
General Disclaimer:
The trade ideas presented herein are solely for illustrative purposes forming a part of a case study intended to demonstrate key principles in risk management within the context of the specific market scenarios discussed. These ideas are not to be interpreted as investment recommendations or financial advice. They do not endorse or promote any specific trading strategies, financial products, or services. The information provided is based on data believed to be reliable; however, its accuracy or completeness cannot be guaranteed. Trading in financial markets involves risks, including the potential loss of principal. Each individual should conduct their own research and consult with professional financial advisors before making any investment decisions. The author or publisher of this content bears no responsibility for any actions taken based on the information provided or for any resultant financial or other losses.

Shady CORN Scheme: Bullish Plot or Market Trap?🌟 Ultimate CORN Heist Strategy: Swing Trade Plan 🌟
Greetings, Wealth Chasers & Market Mavericks! 🤑💸
Ready to pull off a legendary heist in the 🌽 CORN Commodities CFD Market? Our Thief Trading Style blends sharp technicals and fundamentals to craft a high-octane plan for massive gains. Follow the strategy below, stick to the chart, and aim to cash out near the high-risk Red Resistance Zone—an electrified level where overbought conditions, consolidation, or trend reversals could spark traps from bearish bandits. Let’s lock in profits and treat ourselves to the spoils! 💪🎉
📈 Entry Plan: Launch the Heist! 🚀
Wait for a breakout above the Moving Average at 4.5800 to ignite your long entry—bullish riches are calling!
Option 1: Set Buy Stop Orders just above the MA for breakout confirmation.
Option 2: Place Buy Limit Orders on a pullback to the most recent swing low/high within a 15- or 30-minute timeframe.
📢 Pro Tip: Set an alert on your chart to catch the breakout in real-time! ⏰
🛑 Stop Loss: Protect Your Loot! 🔒
For Buy Stop Orders, place your Stop Loss after the breakout confirms to avoid premature exits.
Thief SL Recommendation: Set at the recent swing low on the 4H timeframe (4.4300) for day/swing trades.
Adjust SL based on your risk tolerance, lot size, and number of open orders—play it smart! ⚠️
Feeling rebellious? Set your SL wherever you dare, but don’t blame us if the market bites back! 😎🔥
🎯 Target: Grab the Gold! 🏴☠️
Aim for 4.8000—take partial profits or exit fully before hitting this level.
Scalpers: Stick to long-side scalps. Got deep pockets? Jump in now. Otherwise, join swing traders for the full heist.
Use a trailing Stop Loss to lock in gains and keep your money safe. 💰
🌽 CORN Market Outlook: Why This Heist Works 🌟
The CORN CFD market is currently neutral but shows strong bullish potential, driven by:
📰 Fundamentals: Check macroeconomic data, COT reports, geopolitical events, and news sentiment for a full picture.
📊 Intermarket & Seasonal Analysis: Aligns with favorable positioning and future trend targets.
⚠️ Trading Alert: News & Position Management 🚨
Avoid new trades during major news releases to dodge volatility spikes.
Use trailing Stop Loss orders to secure profits and protect open positions.
Stay updated via reliable sources like Investing.com for real-time news impacting CORN prices.
💥 Boost the Heist! 🚀
Support our Thief Trading Style by hitting the Boost Button to amplify our robbery squad’s strength! 💪 Together, we’ll swipe profits effortlessly every day. Stay tuned for the next heist plan—more riches await! 🤑🐱👤
Let’s make this CORN heist legendary! 🌽💸🎉

The Golden Grain: Trading Corn in Global Markets🟡 1. Introduction
Corn isn’t just something you eat off the cob at a summer barbecue — it’s one of the most widely traded agricultural commodities in the world. Behind every kernel lies a powerful story of food security, global trade, biofuels, and speculative capital.
Whether you’re a farmer managing risk, a trader chasing macro trends, or simply curious about how weather affects global prices, corn futures sit at the crossroads of agriculture and finance. In this article, we’ll explore what makes corn a global economic driver, how it behaves as a futures product, and what traders need to know to approach the corn market intelligently.
🌎 2. Where Corn Grows: Global Powerhouses
Corn is cultivated on every continent except Antarctica, but a handful of countries dominate production and exports.
United States – By far the largest producer and exporter. The “Corn Belt” — spanning Iowa, Illinois, Indiana, Nebraska, and parts of Ohio and Missouri — produces the majority of U.S. corn. U.S. exports also set global benchmarks for pricing.
Brazil & Argentina – These two South American powerhouses are crucial to the global corn supply, especially during the Northern Hemisphere’s off-season.
China – Though a top producer, China consumes most of its own supply and has become a key importer during deficit years.
Corn is typically planted in the U.S. between late April and early June and harvested from September through November. In Brazil, two crops per year are common — including the important safrinha (second crop), harvested mid-year.
Understanding where and when corn is grown is vital. Weather disruptions in any of these regions can ripple through the futures market within hours — or even minutes.
💹 3. Corn as a Futures Market Power Player
Corn is one of the most liquid agricultural futures markets in the world, traded primarily on the CME Group’s CBOT (Chicago Board of Trade). It attracts a diverse set of participants:
Producers and Commercials: Farmers, ethanol refiners, and food manufacturers use corn futures to hedge price risk.
Speculators and Funds: Hedge funds and retail traders speculate on corn price direction, volatility, and seasonal patterns.
Arbitrageurs and Spreads: Traders bet on relative price differences between contracts (e.g., old crop vs. new crop spreads).
The deep liquidity and relatively low tick size make corn accessible, but its price is highly sensitive to weather, government reports (like WASDE), and international trade policies.
🏗️ 4. CME Group Corn Futures: What You Can Trade
The CME Group offers both standard and micro-sized contracts for corn. Here’s a quick overview:
o Standard Corn
Ticker: ZC
Size = 5,000 bushels
Tick = 0.0025 = $12.50
Margin = ~$1,050
o Micro Corn
Ticker: XC
Size = 1,000 bushels
Tick = 0.0050 = $2.50
Margin = ~$105
⚠️ Always confirm margin requirements with your broker. They change with market volatility and exchange updates.
The availability of micro corn contracts has opened the door for smaller traders to manage risk or test strategies without over-leveraging.
📊 5. Historical Price Behavior & Seasonality
Corn is deeply seasonal — and so is its price action.
During planting season (April–May), traders watch weekly USDA crop progress reports and early weather forecasts like hawks. A wet spring can delay planting, leading to tighter supply expectations and early price spikes.
Then comes pollination (July) — the most critical stage. This is when heatwaves or drought can do serious damage to yield potential. If temperatures are unusually high or rainfall is scarce during this window, markets often react with urgency, bidding up futures prices in anticipation of reduced output.
By harvest (September–November), prices often stabilize — especially if production matches expectations. But early frost, wind storms, or excessive rain during harvest can still trigger sharp volatility.
Many experienced traders overlay weather models, soil moisture maps, and historical USDA data to anticipate season-driven price shifts.
Even international factors play a role. For example, when Brazil’s safrinha crop suffers a drought, global corn supply tightens — impacting CME prices even though the crop is thousands of miles away.
🧠 6. What Every New Trader Should Know
If you’re new to corn trading, here are some key principles:
Watch the Weather: It’s not optional. Daily forecasts, drought monitors, and precipitation anomalies can move markets. NOAA, Open-Meteo, and private ag weather services are your friends.
Know the Reports: The WASDE report (World Agricultural Supply and Demand Estimates), USDA Crop Progress, and Prospective Plantings reports can shake up pricing more than you might expect — even if changes seem small.
Mind the Time of Year: Seasonality affects liquidity, volatility, and trader behavior. March–August tends to be the most active period.
Understand Global Demand: The U.S. exports a huge portion of its crop — with China, Mexico, and Japan as major buyers. A tariff tweak or surprise Chinese cancellation can cause wild price swings.
🛠️ Good corn trading is 50% strategy, 50% meteorology.
🧭 This article is part of a broader educational series exploring the relationship between agricultural commodities and weather patterns. In the upcoming pieces, we’ll dive deeper into how temperature and precipitation affect corn, wheat, and soybeans — with real data, charts, and trading insights.
📅 Watch for the next release: “Breadbasket Basics: Trading Wheat Futures.”
When charting futures, the data provided could be delayed. Traders working with the ticker symbols discussed in this idea may prefer to use CME Group real-time data plan on TradingView: www.tradingview.com - This consideration is particularly important for shorter-term traders, whereas it may be less critical for those focused on longer-term trading strategies.
General Disclaimer:
The trade ideas presented herein are solely for illustrative purposes forming a part of a case study intended to demonstrate key principles in risk management within the context of the specific market scenarios discussed. These ideas are not to be interpreted as investment recommendations or financial advice. They do not endorse or promote any specific trading strategies, financial products, or services. The information provided is based on data believed to be reliable; however, its accuracy or completeness cannot be guaranteed. Trading in financial markets involves risks, including the potential loss of principal. Each individual should conduct their own research and consult with professional financial advisors before making any investment decisions. The author or publisher of this content bears no responsibility for any actions taken based on the information provided or for any resultant financial or other losses.

crypto is crypto, but do you need to buy corn? - If the trend line breaks, this is the beginning of a bullish trend.
- a Formulated is Golden Cross Moving Average
- the reason for the rise in corn prices is the decrease in the EU corn harvest in 2024/25. This is the third consecutive year of poor harvest.
If you have anything to add, please write in the comments.

Behind the Curtain: Economic Indicators Shaping Corn Futures1: Introduction
Corn Futures (ZC), traded on the CME, play a vital role in global markets, particularly in the agriculture and food industries. As a commodity with widespread applications, Corn Futures are influenced by a multitude of factors, ranging from seasonal weather patterns to broader economic trends. Understanding these influences is critical for traders seeking to navigate the market effectively.
In this article, we leverage machine learning, specifically a Random Forest Regressor, to identify key economic indicators that have historically correlated with Corn Futures' price changes. By analyzing daily, weekly, and monthly timeframes, we aim to provide a clearer picture of how these indicators potentially shape market behavior and offer actionable insights for traders.
The findings are presented through visual graphs highlighting the top economic indicators across different timeframes. These insights can help traders fine-tune their strategies, whether for short-term speculation or long-term investment.
2: Understanding the Key Economic Indicators
Economic indicators provide a glimpse into various facets of the economy, influencing commodity markets such as Corn Futures. Using the Random Forest model, the following indicators emerged as significant for Corn Futures on different timeframes:
Daily Timeframe:
Oil Import Price Index: Reflects the cost of importing crude oil, impacting energy costs in agriculture, such as fuel for equipment and transportation.
Durable Goods Orders: Tracks demand for goods expected to last three years or more, often signaling broader economic activity that can influence commodity demand.
Natural Gas Prices: Critical for the production of fertilizers, which directly impacts corn farming costs.
Weekly Timeframe:
China GDP Growth Rate: Indicates global demand trends, as China is a major consumer of agricultural products.
Housing Starts: Reflects construction activity, indirectly influencing economic stability and consumer behavior.
Corporate Bond Spread (BAA - 10Y): A measure of credit risk that can signal changes in business investment and economic uncertainty.
Monthly Timeframe:
Retail Sales (YoY): Gauges consumer spending trends, a crucial driver of demand for corn-based products.
Initial Jobless Claims: Acts as a measure of labor market health, influencing disposable income and consumption patterns.
Nonfarm Productivity: Indicates economic efficiency and growth, impacting broader market trends.
By understanding these indicators, traders can interpret their implications on Corn Futures more effectively.
3: How to Use This Information
The timeframes for these indicators provide unique perspectives for different trading styles:
Daily Traders: Indicators like the Oil Import Price Index and Natural Gas Prices, which are highly sensitive to short-term changes, are valuable for high-frequency trading strategies. Daily traders can monitor these to anticipate intraday price movements in Corn Futures.
Swing Traders (Weekly): Weekly indicators, such as the China GDP Growth Rate or Housing Starts, help identify intermediate-term trends. Swing traders can align their positions with these macroeconomic signals for trades lasting several days or weeks.
Long-Term Traders (Monthly): Monthly indicators, such as Retail Sales and Nonfarm Productivity, provide insights into overarching economic trends. Long-term traders can use these to assess demand-side factors impacting Corn Futures over extended periods.
Additionally, traders can enhance their strategies by overlaying these indicators with seasonal patterns in Corn Futures, as weather-related supply shifts often coincide with economic factors.
4: Applications for Risk Management
Understanding the relationship between economic indicators and Corn Futures also plays a critical role in risk management. Here are several ways to apply these insights:
Refining Entry and Exit Points: By correlating Corn Futures with specific indicators, traders can potentially time their entries and exits more effectively. For example, a sharp rise in the Oil Import Price Index might signal increased production costs, potentially pressuring corn prices downward.
Diversifying Trading Strategies: Leveraging daily, weekly, and monthly indicators allows traders to adapt their strategies across timeframes. Short-term volatility from energy prices can complement long-term stability signals from broader economic metrics like GDP Growth.
Mitigating Uncertainty: Tracking indicators such as Corporate Bond Spreads can provide early warnings of economic instability, helping traders hedge their Corn Futures positions with other assets or options.
Seasonal Hedging: Combining indicator-based insights with seasonal trends in Corn Futures can enhance risk-adjusted returns. For instance, aligning hedging strategies with both economic and weather-related factors could reduce downside exposure.
5: Conclusion
The analysis highlights how diverse economic indicators shape Corn Futures prices across multiple timeframes. From daily volatility influenced by energy costs to long-term trends driven by consumer spending and productivity, each indicator provides unique insights into market dynamics.
Traders can use this framework not only for Corn Futures but also for other commodities, enabling a more data-driven approach to trading. The combination of machine learning and economic analysis presents opportunities to refine strategies and improve outcomes in the competitive world of futures trading.
Stay tuned for the next article in this series, where we delve into another futures market and its relationship with key economic indicators.
When charting futures, the data provided could be delayed. Traders working with the ticker symbols discussed in this idea may prefer to use CME Group real-time data plan on TradingView: www.tradingview.com - This consideration is particularly important for shorter-term traders, whereas it may be less critical for those focused on longer-term trading strategies.
General Disclaimer:
The trade ideas presented herein are solely for illustrative purposes forming a part of a case study intended to demonstrate key principles in risk management within the context of the specific market scenarios discussed. These ideas are not to be interpreted as investment recommendations or financial advice. They do not endorse or promote any specific trading strategies, financial products, or services. The information provided is based on data believed to be reliable; however, its accuracy or completeness cannot be guaranteed. Trading in financial markets involves risks, including the potential loss of principal. Each individual should conduct their own research and consult with professional financial advisors before making any investment decisions. The author or publisher of this content bears no responsibility for any actions taken based on the information provided or for any resultant financial or other losses.

The Fed Signals Commodity TrendThe Fed signals that the commodity trend may be moving higher. In the latest FOMC meeting, the Fed lowered rates by a quarter point.
Contrary to the expectations of many analysts who anticipated more cuts in 2025, they signaled only two rate cuts next year, reflecting greater caution about the pace of further reductions in borrowing costs.
So, how is this being interpreted as an indication that the commodity trend may be moving higher?
Corn Futures & Options
Ticker: ZC
Minimum fluctuation:
1/4 of one cent (0.0025) per bushel = $12.50
Disclaimer:
• What presented here is not a recommendation, please consult your licensed broker.
• Our mission is to create lateral thinking skills for every investor and trader, knowing when to take a calculated risk with market uncertainty and a bolder risk when opportunity arises.
CME Real-time Market Data help identify trading set-ups in real-time and express my market views. If you have futures in your trading portfolio, you can check out on CME Group data plans available that suit your trading needs www.tradingview.com

The Corn Comeback: How High Will it Go!??🌽 Corn CBOT:ZC1!
Macro timeframe is showing strength.
The weekly RSI is back above the 50 EQ.
Last weekly candle closed with a bullish range expansion and engulfing bar. Now price has retraced and we are currently standing at the ideal re-entry point.
Entry market buy and dca now towards the stop.
Stop: $409
Target: $475

Bullish time in CORN ahead \o/You can see here the CBOT:ZC1! price displayed in a line chart. After reaching its high in early 2022, the bears took control, driving the price down significantly until now.
The factors in play are as following:
Seasonality: Corn prices have historically shown strength from December through March, aligning with planting and crop cycles. This seasonal trend could provide a solid backdrop for a potential price recovery. (highlighted in green on the chart)
Interest Rates: We’ve reached a pivotal moment in the Federal Reserve's interest rate cycle. The rate hikes that began in March 2022 coincided with the start of the bearish trend, while recent rate cuts in September 2024 may support a rebound in commodity prices, including corn. This shift in monetary policy could act as a bullish catalyst for corn and other commodities. (highlighted in orange on this chart)
Technical Indicators: For additional confirmation, one could wait for a bullish crossover of the moving averages (a golden cross). Such a cross would reinforce the technical setup and definitively signal the onset of a new bull market in corn.
With these factors in play, corn could be setting up for a strong rally in the months ahead.

Corn Reversal: Classical 5 bar trend confirmed!Corn CBOT:ZC1! is showing signs of a reversal, and it has confirmed the following:
The daily trend was activated at yesterday's close, with enough momentum to push above 450.
The weekly trend is also active, following a classic five-bar trend pattern, indicating a strong reversal signal.
Once it reclaims 433, it should quickly move toward the first target of 466.
If everything aligns as expected, it could aim for a break of the current trend. For now, it’s important to take it level by level.

Options Blueprint Series [Advanced]: Reverse Time Iron Condors1. Introduction
In today’s advanced options trading discussion, we introduce a unique structure—"Reverse Time Iron Condors"—using Corn Futures Options (ZCH2025). This sophisticated strategy leverages options with different expiration dates, allowing traders to position themselves for a potential market move in the mid-term.
The Corn market has recently shown signs of slowing momentum, as indicated by technical indicators such as ADX (Average Directional Index) and RSI (Relative Strength Index) applied to ADX. Our analysis shows that RSI applied to ADX is oversold, and RSI is approaching a key crossover signal that could confirm an increase in volatility. Given this setup, the Reverse Diagonal Iron Condor (a.k.a. Reverse Time Iron Condor) structure aligns well with the market’s current conditions over two expiration cycles.
CME Product Specs (Corn Futures ZCH2025)
Contract Size: 5,000 bushels per contract.
Tick Size: 1/4 cent per bushel (0.0025), or $12.50 per tick.
Required Margin: USD $1,200 per contract at the time of producing this article.
2. Market Setup & Analysis
To understand why the Reverse Time Iron Condor is suitable for Corn Futures right now, let’s delve into the technical picture:
ADX Analysis: Corn Futures’ Daily ADX has been dropping, indicating weakening momentum. This signals a period of consolidation, where price volatility remains low.
RSI of ADX: By applying the RSI to the ADX values, we notice that ADX is now oversold, suggesting that momentum could soon pick up.
RSI Crossover: The RSI is nearing a crossover above its moving average, confirming that a new impulse in momentum would be in the process of potentially occur. This technical picture suggests the market could stay in a low-volatility phase for now but break out in the near future.
Based on this technical setup, the strategy we present is to capitalize on the short-term consolidation while preparing for a potential breakout, using the Reverse Diagonal Iron Condor structure.
3. Strategy Breakdown: Reverse Diagonal Iron Condor
The Reverse Diagonal Iron Condor is a unique options structure where you sell longer-term options and buy shorter-term options. This setup generates a negative theta position, meaning time decay works slightly against the trader. However, the strategy compensates for this through positive gamma, which accelerates the delta as the underlying market moves, especially during a breakout. This combination allows the position to profit from a sharp move in either direction, with relatively limited cost.
For this trade on Corn Futures (ZCH2025), the structure is as follows:
Sell 450 Call (21 Feb 2025), Buy 455 Call (27 Dec 2024): This creates a short diagonal call spread, where the February short call decays slowly due to the longer expiration, and the December long call acts as a short-term hedge against an early rise in prices.
Sell 410 Put (21 Feb 2025), Buy 405 Put (27 Dec 2024): Similarly, this forms a short diagonal put spread. The February short put is subject to less time decay, while the December long put protects against a sharp downward move before its expiration.
Key Mechanics:
Time Decay (Theta): Although the trade has negative theta, the impact of time decay is relatively small because the February options decay slowly due to their longer-term expiration.
Gamma and Delta: The positive gamma in this position means that if a breakout occurs before the December expiration, the delta will increase significantly, making the trade more sensitive to price changes. This could more than offset the negative theta, allowing the trade to capture large gains from a significant price move.
Objective:
The goal is for Corn prices to experience an impulsive move (either up or down) before the December 2024 expiration of the long legs, allowing the positive gamma to boost the position’s delta. If this breakout occurs, the potential profits from the price move will likely surpass the small losses due to time decay. The structure is ideal for markets in consolidation that may be on the verge of a volatility surge, as the falling ADX and oversold RSI suggest.
This strategy is particularly well-suited for Corn Futures (ZCH2025), given the current technical setup, where a near-term consolidation phase might be followed by an explosive move in either direction. The success of this trade relies on a timely breakout occurring before the December expiration, after which the position may need adjustment to manage risk.
4. Risk Profile at Initial Setup
The initial risk profile for this trade reminds us of an Iron Condor risk profile, with the best case being a range-bound corn market between 410 and 450.
Important Consideration: This risk profile does not reflect the final outcome because the trade spans two different options cycles. The December options will expire first, which means adjustments may be necessary after that expiration to maintain protection.
Note on Options Simulation Tool:
It's important to mention that the options simulation tool provided by TradingView is currently still in its beta stage. While it offers useful insights for analyzing and visualizing options strategies, traders should be aware that certain features may be limited, and results might not always reflect all real-world conditions. For a more comprehensive analysis, it is recommended to complement the simulation with other tools such as the Options Strategy Simulator available in the CME Group website.
5. Optional Trade Management After December Expiration
Once the December 2024 long options expire, you will face two possible scenarios. In both cases, managing the February 2025 short options is crucial:
o Scenario 1: Corn Prices Remain Range-Bound:
If Corn futures continue to trade within the 450-410 range, the December long options will expire worthless.
In this case, the strategy shifts to managing the February short options, which will benefit from time decay. Monitor the market closely and consider whether to buy new protection for the remaining February short options.
o Scenario 2: Corn Prices Break Out:
If Corn futures break above 450 or below 410 prior to the December expiration, the February short options could expose the position to significant risk if we allow them to expire.
One potential action is to purchase new long options within the range (for example, buy the 445 call and the 415 put using 21 February 2025 expiration). While many other actions could be valid, a common and probably the simplest approach could be to close all legs in time for a likely profit at this moment.
6. Risk Management
Effective risk management is essential in any options strategy, especially one as advanced as a Reverse Diagonal Iron Condor. Below are key points to ensure this trade stays within your risk tolerance:
o Position Sizing:
Given the complexity of this trade, ensure that the size of your position fits within your overall risk management plan. Avoid over-leveraging, as unexpected price movements can lead to significant losses once the December long options expire.
o Monitor Key Levels:
Keep an eye on the 450 strike (resistance) and 410 strike (support). If Corn breaks these levels early in the trade, consider closing the position or making adjustments.
o Volatility Management:
The success of this trade hinges on an increase in market momentum.
7. Conclusion
The Reverse Diagonal Iron Condor is an advanced options strategy where the long positions have a shorter expiration than the short positions, creating a negative theta position. Instead of benefiting from time decay as in a traditional Iron Condor, this strategy is designed to take advantage of expected volatility increases over time. By selling longer-term options and buying shorter-term options, traders are positioning themselves for a volatility breakout or significant price movement before the near-term options expire.
In this setup, time decay has a limited negative impact on the position, but the key advantage lies in the positive gamma. This means that if a breakout occurs, the position’s delta will accelerate, potentially outpacing the slight negative effect of theta. Traders should closely monitor the December expiration, as the success of the trade hinges on the anticipated large move happening before this date. This structure is particularly well-suited for Corn Futures (ZCH2025), given the falling ADX and RSI, which suggest a potential momentum shift. The strategy is designed to benefit from a significant price move with limited cost, assuming the breakout occurs within the timeframe of the December long options.
When charting futures, the data provided could be delayed. Traders working with the ticker symbols discussed in this idea may prefer to use CME Group real-time data plan on TradingView: www.tradingview.com - This consideration is particularly important for shorter-term traders, whereas it may be less critical for those focused on longer-term trading strategies.
General Disclaimer:
The trade ideas presented herein are solely for illustrative purposes forming a part of a case study intended to demonstrate key principles in risk management within the context of the specific market scenarios discussed. These ideas are not to be interpreted as investment recommendations or financial advice. They do not endorse or promote any specific trading strategies, financial products, or services. The information provided is based on data believed to be reliable; however, its accuracy or completeness cannot be guaranteed. Trading in financial markets involves risks, including the potential loss of principal. Each individual should conduct their own research and consult with professional financial advisors before making any investment decisions. The author or publisher of this content bears no responsibility for any actions taken based on the information provided or for any resultant financial or other losses.

Options Blueprint Series: Cost Efficient Skip Strike ButterflyUnderstanding Skip Strike Butterfly
The Skip Strike Butterfly strategy is a unique and cost-effective options trading strategy that builds upon the traditional butterfly spread. This strategy involves buying and selling options at different strike prices to create a position with limited risk and potential for profit. Unlike the traditional butterfly spread, the Skip Strike Butterfly "skips" a strike price, which reduces the overall cost of the trade while maintaining a similar payoff profile.
Benefits:
Cost Efficiency: Lower upfront cost compared to traditional butterfly spreads.
Limited Risk: The maximum risk is limited to the net premium paid for the strategy.
Profit Potential: Potential for significant returns if the underlying asset moves within the expected range.
Understanding the mechanics of the Skip Strike Butterfly strategy can provide traders with a versatile tool for navigating market conditions when trading Corn Futures. This strategy allows traders to participate in market movements with a well-defined risk and reward profile, making it an attractive option for those looking to optimize their trading costs.
Strategy Setup
Setting up the Skip Strike Butterfly strategy for Corn Futures involves selecting the appropriate strike prices and expiration dates. Here, we detail the steps to configure this strategy effectively.
Steps to Set Up the Skip Strike Butterfly:
1. Select the Expiration Date:
Choose an expiration date that aligns with your market outlook and trading plan. Ensure you select an expiration that provides enough time for the expected price movement to occur.
2. Determine the Strike Prices:
Identify the current price of Corn Futures.
Typically, use calls for bullish setups and puts for bearish setups.
Buy one in-the-money (ITM) option.
Sell two at-the-money (OTM) options using a strike located near to where the trade target price is.
Skip one or multiple strikes and buy one further out-of-the-money (OTM) option.
3. Calculate the Cost:
Calculate the net premium paid for the strategy by considering the premiums of each option involved. The net cost is generally lower due to the skipped strike price.
4. Establish the Payoff Structure:
The maximum profit is realized if the price of Corn Futures closes at the middle strike at expiration.
The maximum loss is limited to the net premium paid for the strategy.
Application to Corn Futures
Analyzing the current market conditions for Corn Futures is crucial before implementing the Skip Strike Butterfly strategy. Let's examine the market and set up a trade based on recent data and trends.
Market Analysis:
Current Price: Corn Futures are trading at 456'6 per contract.
Market Trend: The market has shown moderate volatility with a tendency to hover around the 450 level.
Technicals: Recently, buy UnFilled Orders (UFOs) have formed around the 450 level, indicating strong buying interest and potential support at this price. On the other hand, sell UFOs are positioned much higher, around the 490 level, suggesting limited selling pressure in the immediate range and opening the door for a directional move with a potentially strong reward-to-risk ratio.
Setting Up the Trade:
Based on our analysis, we will implement the Skip Strike Butterfly strategy as follows:
Current Price of Corn Futures: 456'6
Expiration Date: 74 days from today.
Strike Prices and Premiums:
Buy 1 ITM Call: Strike Price 450, Premium 27.25
Sell 2 ATM Calls: Strike Price 480, Premium 16 each
Buy 1 OTM Call: Strike Price 540, Premium 6
Net Premium Paid: 27.25 (buy) - 32 (sell) + 6 (buy) = 1.25 points = $62.5 (Point Value is $50/point)
Source: Options chain available at www.tradingview.com
Trade Execution:
Entry Price: The trade is entered at 1.25 points, making it highly cost-efficient.
Target Price: The optimal scenario is for Corn Futures to close at 480 at expiration, where the maximum profit is realized.
Break-Even Points: Calculate the break-even points to ensure clarity on potential losses or gains. For this setup, the break-even points are 451.25 and 508.75.
Risk: In the worst-case scenario, this trade could incur a loss of 31.25 points if Corn Futures surpasses the upper break-even point. Conversely, a minor loss of 1.25 points would occur if Corn Futures falls below the lower break-even point.
Source: Risk profile graph available at www.tradingview.com
Risk Management
Risk management is a critical aspect of any trading strategy, and it is especially important when trading options like the Skip Strike Butterfly. Effective risk management helps protect against unexpected market movements and ensures that losses are minimized while maximizing potential gains.
Importance of Risk Management:
Limit Losses: By setting clear stop-loss levels, traders can limit the amount of capital at risk and prevent large losses.
Preserve Capital: Protecting trading capital is essential for long-term success. Effective risk management allows traders to stay in the game even after a series of losing trades.
Emotional Control: Having a risk management plan helps traders stick to their strategy and avoid emotional decisions driven by market volatility.
Maximize Gains: Proper risk management enables traders to capitalize on profitable opportunities while keeping losses in check.
Techniques for Managing Risk with Skip Strike Butterfly:
1. Stop-Loss Orders:
Set stop-loss orders at predetermined price levels to automatically exit the trade if the market moves against you.
2. Position Sizing:
Only allocate a small percentage of your trading capital to any single trade. This helps to mitigate the impact of any one trade on your overall portfolio.
3. Diversification:
Diversify your trading strategies and instruments to spread risk across different markets and reduce the impact of adverse movements in any one asset.
4. Hedging:
Use other options strategies to hedge your positions. For example, buying protective puts can limit downside risk if the market moves significantly against your position.
5. Regular Monitoring:
Continuously monitor the market and your positions. Be prepared to adjust your strategy or exit the trade if market conditions change.
Conclusion
The Skip Strike Butterfly strategy offers a cost-efficient and flexible approach for trading Corn Futures. By strategically setting up options at different strike prices while skipping an intermediate strike, traders can reduce the cost of the trade while maintaining a similar payoff structure to a traditional butterfly spread. This strategy is particularly useful in markets exhibiting limited price movements, making it ideal for the current conditions in Corn Futures.
Key Takeaways:
Cost Efficiency: The Skip Strike Butterfly reduces the upfront cost of entering a trade, providing a significant advantage over traditional butterfly spreads.
Limited Risk: With a well-defined risk profile, this strategy ensures that losses are capped at the net premium paid.
Profit Potential: Although the maximum profit is achieved if the underlying asset closes at the middle strike price, the strategy still offers substantial profit opportunities within a specific price range.
Risk Management: Implementing robust risk management techniques is essential for success. Utilizing stop-loss orders, managing position sizes, diversifying strategies, and regular market monitoring can help protect trading capital and maximize gains.
When trading options and employing strategies like the Skip Strike Butterfly, it is crucial to stay disciplined and adhere to your trading plan. Always ensure that your risk management measures are in place to navigate market uncertainties effectively.
When charting futures, the data provided could be delayed. Traders working with the ticker symbols discussed in this idea may prefer to use CME Group real-time data plan on TradingView: www.tradingview.com This consideration is particularly important for shorter-term traders, whereas it may be less critical for those focused on longer-term trading strategies.
General Disclaimer:
The trade ideas presented herein are solely for illustrative purposes forming a part of a case study intended to demonstrate key principles in risk management within the context of the specific market scenarios discussed. These ideas are not to be interpreted as investment recommendations or financial advice. They do not endorse or promote any specific trading strategies, financial products, or services. The information provided is based on data believed to be reliable; however, its accuracy or completeness cannot be guaranteed. Trading in financial markets involves risks, including the potential loss of principal. Each individual should conduct their own research and consult with professional financial advisors before making any investment decisions. The author or publisher of this content bears no responsibility for any actions taken based on the information provided or for any resultant financial or other losses.

Options Blueprint Series: Debit Spreads - Precision InvestingIntroduction to Options on Corn Futures
Corn Futures are one of the staple commodities traded on the Chicago Board of Trade (CBOT), representing a critical component of the agricultural sector's financial instruments. Each Corn Futures contract is standardized to 5,000 bushels, and the price is quoted in USD-cents per bushel.
Contract Specifications:
Point Value: 1/4 of one cent (0.0025) per bushel = $12.50.
Margins: Trading on margin allows traders to leverage positions while only needing to cover a fraction of the total contract value. For Corn Futures, the initial margin requirement is set by the CME Group and varies based on market volatility: Currently $1,300 per contract at the time of this publication.
Options trading introduces another layer of complexity and opportunity. Debit spreads involve purchasing one option and selling another, which helps manage the overall cost of entering the market.
Margin for Debit Spreads:
The margin for debit spreads typically reflects the premium paid for the long position minus any premium received from the short position. This results in a significantly lower margin requirement compared to trading the underlying futures contract outright. (In the below example the net premium paid for the spread is 7.26 points = $363, which is significantly lower than $1,300).
Understanding Debit Spreads
Debit spreads are a sophisticated options trading strategy utilized primarily to achieve a targeted investment outcome while managing risk exposure. They are constructed by purchasing an option (call or put) while simultaneously selling another option of the same type (call or put) but with a different strike price, within the same expiration period. The aim is to reduce the net cost of the position, as the premium received from the sold option offsets part of the cost incurred from the bought option.
Mechanics of Debit Spreads:
Long Position: You buy an option that you expect to increase in value as the market moves in your favor.
Short Position: You sell another option with a higher strike (in the case of a call spread) or a lower strike (in the case of a put spread). This option is expected to expire worthless or decrease in value, offsetting the cost of the long position.
Advantages of Using Debit Spreads:
Defined Risk: The maximum loss on a debit spread is limited to the net premium paid plus transaction costs. This makes it easier to manage risk, especially in volatile markets.
Potential for Profit: Although the profit potential is capped at the difference between the strike prices minus the net debit paid, these spreads can still offer attractive returns relative to the risk undertaken.
Lower Cost of Entry: Compared to buying a single option, spreads typically require a lower upfront investment, making them accessible to a wider range of traders.
This strategic application is what we'll explore next in the context of Corn Futures, where market conditions suggest a potential breakout.
Application in Corn Futures
For traders looking to harness the volatility in the agricultural sector, especially in commodities like corn, debit spreads can be a precision tool for structured trading. Given the current trading range of Corn Futures, with prices oscillating between 424 cents and 448 cents per bushel for a number of weeks, a strategic setup can be envisioned aiming for an upward breakout towards 471 cents, a resistance level indicated by Sell UnFilled Orders (UFOs).
Strategy Implementation with Debit Spreads:
Long Call Option: Buying a call option with a strike price near the lower end of the current range (450) positions traders to benefit from potential upward movements. Premium paid is 10.39 ($519.5)
Short Call Option: Simultaneously, selling a call option with a strike price at 475 cents caps the maximum profit but significantly reduces the cost of entering the trade. This strike is chosen because it aligns closely with the expected UFO resistance level, enhancing the probability of the short option expiring worthless. Premium received is 3.13 ($156.5).
The net cost of the spread ($519.5 - $156.5 = $363) represents the total risk. We are using the CME Group Options Calculator in order to generate fair value prices and Greeks for any options on futures contracts.
Setting up the Trade
To potentially capitalize on the anticipated market movement for Corn Futures, our debit spread strategy will involve a detailed setup of options trades based on specific strike prices that align with market expectations and technical analysis. This step-by-step guide will provide clarity on how to effectively enter and manage this options strategy.
Trade Details:
Long Call Option: Buy a call option with a strike price of 450. This option is chosen as it is near the current upper boundary of the trading range, providing a favorable entry point as we anticipate a breakout.
Short Call Option: Sell a call option with a strike price of 475. This strike is selected based on its proximity to the identified resistance level at 471, suggesting a high likelihood that the price may not exceed this level before expiration.
Cost and Profit Analysis:
Net Premium Paid: $363 as discussed above.
Break-even Point: Long strike price (450) plus the net premium paid = 457.26.
Maximum Profit: The maximum profit for this debit spread is capped at the difference between the two strike prices minus the net premium paid = 475 – 450 – 7.26 = 17.74 = $887.
Maximum Loss: The maximum risk is limited to the net premium paid.
Risk Management
By entering a debit spread, traders not only define their maximum risk but also set clear targets for profitability based on established market thresholds. This methodical approach ensures that even if the anticipated price movement does not fully materialize, the financial exposure remains controlled.
Risk Management Techniques:
Position Sizing: Determine the appropriate size of the position based on overall portfolio risk and individual risk tolerance.
Stop-Loss Orders: Although the maximum loss is capped by the nature of the debit spread (the net premium paid), stop-loss orders can be used if the underlying asset moves against the trader.
Rolling the Spread: If market conditions change or the initial price target is reached earlier than expected, consider 'rolling' the spread.
Adjusting the Trade:
If the price of Corn Futures approaches the short strike price (475) faster than anticipated, and market sentiment indicates further upward potential, the short call option can be bought back while a new higher strike call can be sold. This adjustment aims to extend the profitable range of the spread without increasing the original risk by much.
Conversely, if the price seems unlikely to reach the 450 mark, reassess the viability of keeping the spread open. It may be prudent to close the position early to preserve capital if fundamental market factors have shifted negatively.
Importance of Continuous Monitoring:
Regularly monitor market conditions, including factors like weather reports, agricultural policies, and economic indicators that significantly impact corn prices.
Stay updated with technical analysis charts and adjust strategies according to new resistance and support levels identified.
Effective risk management not only protects from downside risk but also enhances the potential for profitability by adapting to changing market conditions.
Conclusion
The strategic use of debit spreads in Corn Futures options trading offers a balanced approach to leverage market opportunities while maintaining strict control over potential risks.
Recap of Key Points:
Corn Options on Futures: Understanding the contract specifics is crucial for informed trading decisions.
Debit Spreads: These allow traders to benefit from expected price movements with reduced upfront costs and limited risk.
Trade Setup: Focused on a potential breakout from the 448-424 range aiming towards 471, utilizing 450 and 475 strikes for the long and short calls respectively.
Risk Management: Emphasizes the importance of position sizing, potential use of stop-loss orders, and the flexibility to adjust or roll the spread according to market changes.
When charting futures, the data provided could be delayed. Traders working with the ticker symbols discussed in this idea may prefer to use CME Group real-time data plan on TradingView: www.tradingview.com This consideration is particularly important for shorter-term traders, whereas it may be less critical for those focused on longer-term trading strategies.
General Disclaimer:
The trade ideas presented herein are solely for illustrative purposes forming a part of a case study intended to demonstrate key principles in risk management within the context of the specific market scenarios discussed. These ideas are not to be interpreted as investment recommendations or financial advice. They do not endorse or promote any specific trading strategies, financial products, or services. The information provided is based on data believed to be reliable; however, its accuracy or completeness cannot be guaranteed. Trading in financial markets involves risks, including the potential loss of principal. Each individual should conduct their own research and consult with professional financial advisors before making any investment decisions. The author or publisher of this content bears no responsibility for any actions taken based on the information provided or for any resultant financial or other losses.
