CORN Bulls in Control? Retest Pullback Confirms Trend Bias🌽 CORN Institutional Edge Plan (Swing/Day Trade Setup)
🔍 Market Context
CORN (CFD on US Corn Futures) is showing signs of bullish momentum after testing a key resistance area. Institutional order flow hints at accumulation in the mid-420s region — a potential pullback zone before continuation higher.
🧭 Thief Strategy Plan — Layered Entries
This setup follows the “Thief Strategy”, a layered entry approach using multiple buy limit orders to capture volatility and improve average entry cost.
📈 Layered Buy Zones:
1️⃣ 428
2️⃣ 430
3️⃣ 432
(Traders may extend layers based on risk appetite and confirmation signals.)
🛑 Protective Stop (Thief SL): Around 424
🎯 Profit Zone (Thief TP): Around 445
🧠 Plan Insight
Expecting a resistance retest pullback to confirm the bullish structure.
Momentum aligns with higher-timeframe bias after institutional demand emerged near 420s.
Targets align with overbought resistance and prior liquidity traps — best to secure profits and protect gains as price nears 445.
💡 Note: Each trader should manage risk independently. This setup is educational only — showing how to structure a layered “Thief-style” plan, not a recommendation to buy/sell.
🔗 Correlated Assets to Watch
OANDA:WHEATUSD – Often mirrors agricultural flow shifts.
$SOYBEANUSD – Moves inversely at times; watch for divergence.
TVC:DXY – A stronger dollar can pressure commodity prices.
OANDA:SPX500USD – Risk appetite correlation; strong equities can support commodity demand.
🕵️♂️ Thief’s Key Notes
Dear Ladies & Gentlemen (Thief OG’s) — this plan shows how I structure entries, not where you should trade.
You can make money — then take money — at your own risk.
Manage your own stop-loss, target, and position sizing like a pro.
✨ “If you find value in my analysis, a 👍 and 🚀 boost is much appreciated — it helps me share more setups with the community!”
📜 Disclaimer:
This is a Thief-style trading strategy created just for fun and educational purposes.
Not financial advice. Trade responsibly.
#CORN #Commodities #Futures #InstitutionalTrading #SwingTrade #DayTrading #LayeredEntries #ThiefStrategy #SmartMoney #PriceAction #CommodityMarket #Agriculture #DXY #WHEAT #SOYBEAN #TradingView #ThiefTrader
Cornfuturesforecast

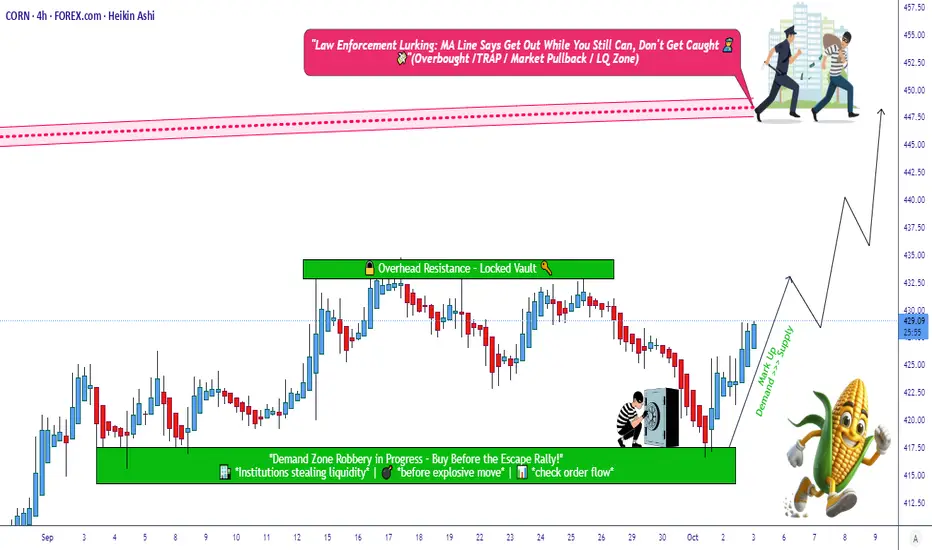
Corn Agro Market Strategy Map – Bullish Path Ahead!🚜🌽 CORN Agro Commodities Wealth Strategy Map (Swing/Day Trade)
📌 Plan: Bullish (Swing + Day Trade Setup)
✅ Market sentiment favors bullish bias in CORN.
🎯 Swing/Day traders can look for upside continuation until resistance zones.
🎯 Entry Plan (Layering Style Method)
🔑 You can enter at any price, but pullbacks are safer.
Layered Buy Limit Orders (multi-entry strategy):
🟢 417
🟢 420
🟢 422
🟢 425
🟢 427
📌 You can extend or add more layers depending on your personal risk appetite.
🛡️ Stop Loss (Protective Exit)
🚨 Thief SL is placed at 415.
📝 Note: This is my personal style. You can set your own SL depending on your strategy & risk comfort.
🎯 Target Levels (Profit Booking)
🏁 447 → Suggested take-profit zone.
🚔 450 = “Police Barricade” → Acts as a strong resistance + potential trap + overbought zone.
💡 Best practice: Exit at 447 before the heavy resistance wall to lock in profits.
🗣️ Important Note for Readers (Thief OG’s 🕶️)
🙏 This is not financial advice.
⚡ You are free to set your own TP/SL.
📌 I share my strategy map — you manage your own risk.
🏦 Market is open to everyone → take profits in your own style, at your own risk.
🔍 Key Insights & Market Correlations
🌾 Agro Commodity Correlations:
CORN often moves in relation to CAPITALCOM:WHEAT and $SOYBEAN.
Soft commodities like PEPPERSTONE:COFFEE can also reflect agro market sentiment.
💵 Currency Link (Dollar Impact):
TVC:DXY (US Dollar Index) plays a key role.
Stronger dollar = bearish pressure on commodities.
📈 Indices & Risk Sentiment:
Global equities ( CAPITALCOM:US30 , SP:SPX , NASDAQ:NDX ) indirectly influence commodities via sentiment.
⚡ Energy Connection:
NSE:OIL & FX:NGAS affect input costs → higher energy = higher agro costs.
Farmers & supply chains react, impacting commodity pricing.
📊 Related Pairs to Watch
🌽 CAPITALCOM:CORN
🌾 CAPITALCOM:WHEAT
CAPITALCOM:SOYBEAN
☕ PEPPERSTONE:COFFEE
🛢️ NSE:OIL
💵 TVC:DXY
📊 CAPITALCOM:US30 / SP:SPX / NASDAQ:NDX
✨ “If you find value in my analysis, a 👍 and 🚀 boost is much appreciated — it helps me share more setups with the community!”
⚠️ Disclaimer: This is a thief-style trading strategy, designed for fun and community sharing. Not financial advice. Please trade responsibly and at your own risk.
#CORN #AgroCommodities #SwingTrade #DayTrading #TradingStrategy #LayeringStrategy #MarketAnalysis #WHEAT #SOYBEAN #COFFEE #DXY #US30 #SPX #Commodities
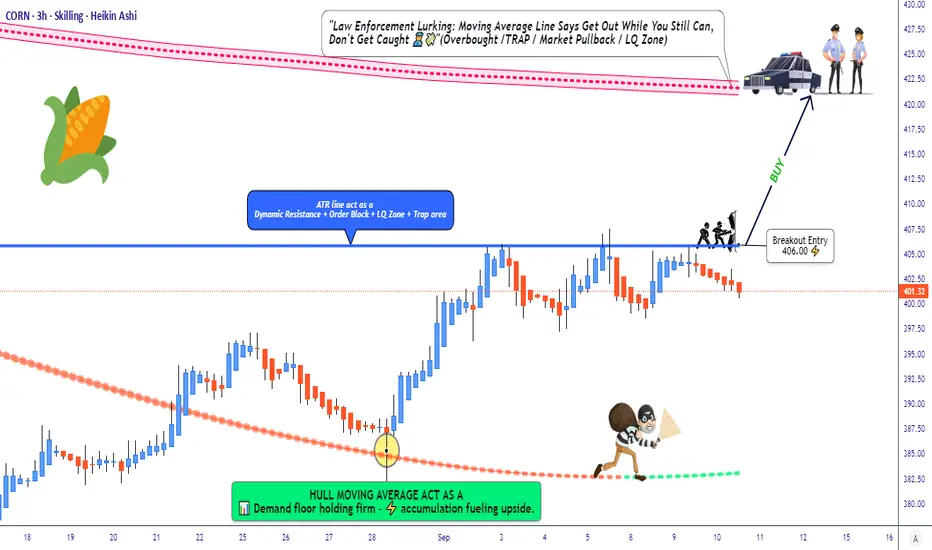
CORN Setup: Is This The Bullish Breakout We've Been Waiting For?🌽 CORN CFD | Money Heist Plan 🎭 (Swing / Day Trade)
🔑 Trading Plan (Thief Style Strategy)
Entry (Breakout Trigger): 📈 406.00 — when candle breaks ATR resistance, bullish plan activates.
Layering Entries (Thief Method):
Buy Limit Layers: 400.0 | 402.0 | 405.0 | 407.0 | 410.0 (flexible — adjust/add more based on breakout confirmation).
Layering helps manage entries & average position smartly.
Stop Loss (Thief’s Safety Lock): @ 395.00 🛑 after breakout trigger.
⚠️ Adjust SL based on your own risk tolerance.
Target (Escape Point): 🎯 421.00
Resistance zone + overbought condition = “police barricade” (take profits before getting trapped).
🌍 Why This Plan? | Thief Technical + Macro/Fundamental Mix
📊 Technical Edge
ATR breakout level at 406.00 ⚡
Momentum build-up near resistance, potential squeeze if volume spikes.
Layered entries provide risk-managed exposure.
🌽 CORN Market Data (10 Sep 2025)
Daily Change: -1.05% 🔴
Monthly Performance: +3.13% 🟢
Yearly Performance: -1.90% 🔴
👥 Investor Sentiment
Retail: 45% Long 😊 | 55% Short 😟 (slightly bearish bias).
Institutions: Net short 91,487 contracts 🏦 (hedging against oversupply).
😨 Fear & Greed Index
Score: 51/100 (Neutral 😐)
Balance between fear (supply risks) vs greed (demand resilience).
📉 Fundamentals & Macro Score
Supply Side
Record US production: 16.7B bushels 🟢
Brazil’s harvest adds oversupply pressure 🔴
Crop diseases (Tar Spot & Southern Rust) hurting yields 🔴
Demand Side
Exports YTD: +46.8% 🌍
Ethanol production: 1.105M barrels/day ⛽ (+30k WoW) 🟢
Tariff risks (China/Mexico) could slow trade 🔴
Macro Score: 6/10 → Moderately Bullish
🎯 Market Outlook Summary
Bull Case (Long) ✅
Strong exports (+28.6% YTD)
Biofuel/ethanol demand supporting floor
Technical rebound chances
Bear Case (Short) ❌
Record harvests (US/Brazil/Ukraine) = oversupply
Institutions scaling up shorts
Global glut risks
📌 Outlook Bias: Bearish-to-Neutral 🐻⚖️
Short-term pressure from supply glut, but demand stabilizes downside.
📌 Key Takeaways for Traders
Breakout Watch: 406.00 🚨
Layered Entry: Manage risk via staggered buys.
Target Zone: 421.00 (book profits before trap).
Macro Mix: Demand solid but supply risks dominate.
Watch List: CAPITALCOM:CORN , CBOT:ZS1! (Soybeans), CBOT:ZW1! (Wheat), CBOT:ZC1! (Corn Futures)
🔗 Pairs to Watch (in USD)
AMEX:SOYB (Soybeans CFD): Moves in lockstep with CORN due to shared ag trends.
AMEX:WEAT (Wheat CFD): Grains often trend together—keep an eye out!
TVC:USOIL : Influences ethanol demand, impacting CORN indirectly.
TVC:DXY (US Dollar Index): A rising USD could pressure commodity prices.
✨ “If you find value in my analysis, a 👍 and 🚀 boost is much appreciated — it helps me share more setups with the community!”
#CORN #Commodities #SwingTrade #DayTrade #ThiefStrategy #MoneyHeistPlan #Futures #LayeringStrategy #BreakoutTrading #Agriculture #Ethanol #TradingCommunity
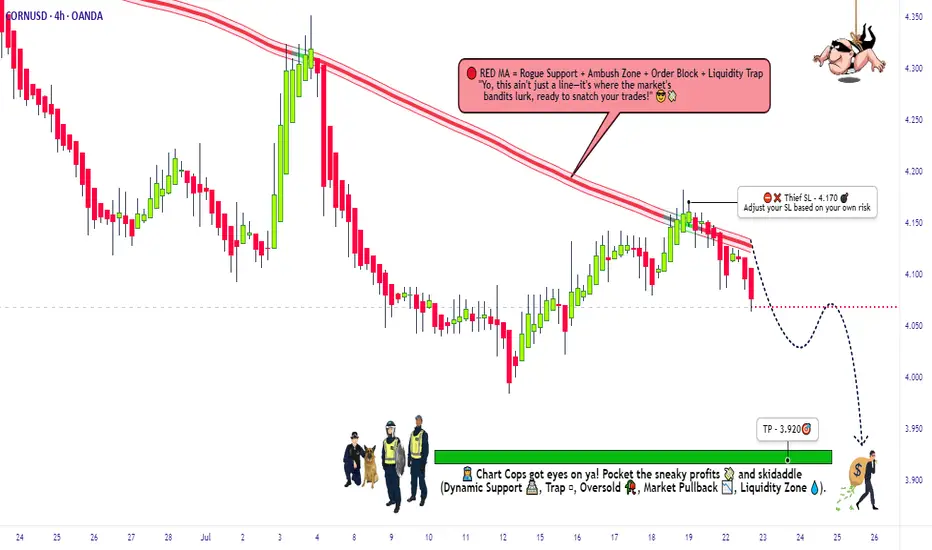
CORN Heist: Steal Short Profits Before Bulls React!🚨 CORN HEIST ALERT: Bearish Raid Ahead! 🚨 Swipe the Loot Before Cops Arrive! 🌽🔻
🌟 Attention, Market Bandits & Profit Pirates! 🌟
🔥 Thief Trading Intel Report 🔥
The 🌽 CORN CFD market is setting up for a bearish heist—time to short-swipe the loot before the bulls rally their defenses! Police barricade (resistance) is holding strong, but oversold conditions + consolidation hint at a trend reversal trap. High-risk, high-reward—just how we like it!
🎯 Heist Strategy (Swing/Day Trade)
Entry (Bearish Raid) 🏴☠️
"Vault’s unlocked! Swipe shorts at any price—OR set sell limits *near 15M/30M pullbacks for a cleaner steal!"*
Stop Loss (Escape Route) 🛑
Thief’s SL at nearest 4H swing high (4.170)—adjust based on your risk tolerance & lot size.
Pro Tip: Tighten SL if trading multiple orders!
Target (Profit Escape) 🎯
3.920 (or bail early if cops (bulls) show up!)
🌽 Market Snapshot: Why CORN is Ripe for a Raid
Neutral trend leaning bearish—consolidation breakout likely!
Key Drivers:
Macro pressure (USD strength, crop reports)
COT data hinting at big players positioning short
Seasonal trends favoring downside
Want full intel? 🔍 Check COT reports & intermarket analysis!
🚨 Trading Alerts (Avoid the Cops!)
News = Volatility Trap! 📰🚔
Avoid new trades during high-impact news.
Trailing stops to lock profits on running heists!
💥 Boost This Heist! 💥
"Like & boost this idea to fuel our next raid! More steals = more profits for the gang! 🏴☠️💰
Stay tuned—another heist drops soon! 🚀🤝
THE GREAT CORN GRAB! (Bearish CFD Heist)🌽 THE CORN HEIST: Bearish Raid Plan (Swing/Day Trade) 🚨💰
🌟 Attention, Market Robbers & Money Makers! 🌟
(Hola! Oi! Bonjour! Hallo! Marhaba!)
🔥 Based on the ruthless Thief Trading Style (TA + FA), we’re plotting a bearish heist on the CORN Commodities CFD Market! Time to short like a bandit and escape with profits before the bulls catch us! 🏴☠️💸
🎯 MASTER HEIST PLAN (BEARISH RAID)
Entry Point (Sell Limit / Market):
"The vault is open—swipe the bearish loot at any price!"
🔹 *For safer heists, set sell limits near pullbacks (15M/30M).*
Stop Loss (Escape Route):
📌 Thief SL at nearest swing high (1D timeframe) – 4.4000
📌 Adjust SL based on risk, lot size, & multiple orders.
Profit Target (Escape Before Cops Arrive):
🎯 4.1000 (or exit early if the trap snaps shut!)
🌽 MARKET TREND: NEUTRAL (BEARISH OPPORTUNITY!)
Consolidation zone = Thief’s playground!
Oversold? Maybe. But the real trap is where bullish robbers get slaughtered.
High risk = High reward—only for cold-blooded traders!
📡 FUNDAMENTAL INTEL (DON’T SKIP THIS!)
🔗 Get full reports (COT, Macro, Seasonals, Sentiment, Intermarket Analysis) in our bio0!
🚨 TRADING ALERT: NEWS = DANGER ZONE!
❌ Avoid new trades during news!
🔐 Use trailing stops to lock profits & escape alive!
💥 BOOST THIS HEIST! (HELP US ROB THE MARKET!)
🔥 Hit LIKE & FOLLOW to strengthen our robbery squad!
💸 More heists = More profits. Stay tuned for the next raid!
🐱👤 See you in the shadows, bandits! 🤑🚀

crypto is crypto, but do you need to buy corn? - If the trend line breaks, this is the beginning of a bullish trend.
- a Formulated is Golden Cross Moving Average
- the reason for the rise in corn prices is the decrease in the EU corn harvest in 2024/25. This is the third consecutive year of poor harvest.
If you have anything to add, please write in the comments.

Corn prepares for a bullish move🤘As described here - I'm planning to catch the breakout. Let's see if this plays out as I think. In any case - I wish you a good 2023 with lots of good trades. ;)

🌾CORN - BitCorn is Back🌽🌮🍿Last year we bought because of inflation.
This year things are even more serious, there is a war between Russia and Ukraine.
Column: Concerns rise over Black Sea spring crops amid Russia-Ukraine war: www.reuters.com
Looks like Fajitas and Tacos🌮, Kellogs frosties 🐯 and other cereal , corn on the cob 🌽, even go ''pop'' in the cinema🍿 might become expensier. On a more serious note, poverty will hit some and food will become a luxury for some.
Sad but true. Scary...
May logic prevail,
the FXPROFESSOR 🌾

$ZC Corn Futures Medium To Long Term Analysis #cornfutures Traders, This is the analysis of Corn Futures ZC.
1. Price made structure break which means more down side is expected
2. But the price can go back up perform
a. Sell Order Collection
b. Stop Loss Collection
c. Retest few levels
3. We currently have a wedge pattern which getting squeezed. A break below will push it to the lower FCP zone.
4. A break above can go to upper FCP zone which is very powerful and can have better sell orders. From there a short based on a confirmation will make more sense. This short then can be held for a longer period of time (if conditions are favorable) as the market structure has been broken (BOS) mentioned in the point 1.
Trade what you see and ignore any hypes. Stay objective.
Rules:
1. Never trade too much
2. Never trade without a confirmation
3. Never rely on signals, do your own analysis and research too
✅ If you found this idea useful, hit the like button, subscribe and share it in other trading forums.
✅ Follow me for future ideas, trade set ups and the updates of this analysis
✅ Don't hesitate to share your ideas, comments, opinions and questions.
Take care and trade well
-Vik
____________________________________________________
📌 DISCLAIMER
The content on this analysis is subject to change at any time without notice, and is provided for the sole purpose of education only.
Not a financial advice or signal. Please make your own independent investment decisions.
____________________________________________________

CORN - Time to Buy AgainAt this stage I have the confirmation to buy in again. Not much to say, just look at the previous ideas for the fundamentals.
Trends and patterns in grain auctions, local meat production and corn production are all indicative of stronger grain demand by China in the coming years, reported S&P Global Platts.
reference

Gotta Love Your CORN flakes, Tony 🐯Corn baby, CORN!!!
We have talked about Bitcorn, since Corn has been rising faster than Bitcoin.
We talked about pop-Corn and watching Corn rising like Superman
Well, it's time to stock up on your Kellogs people. This Price is going to 900 (check our previous idea below)
the CornProfessor
ps. this is my favorite breakfast: www.kelloggs.co.uk Thank you Tony, you make my mornings Corny and my trades profitable, I Love you Tiger

Corn Price has reached to its highest level since 2014Ascending channel in weekly chart is going to be broken soon, since RSI is 75, and RSI divergence has formed, technically we expect to see the price in lower levels soon but fundamentally it is still likely to go up to the end of march. But I doubt price goes up more than 600 since Argentina is going to terminate its export ban since the coming week and COVID-19 cases are going down gradually either in USA or China.

Corn: A Potential Fade Approaching Corn seems to be in the final stage of a bullish run here. In terms of % gain, it is almost at the psychological 100% increase area from Mar'20 low. Short risk exposure is becoming more risky at these levels. With another push higher, some decent supply inflows are expected.

Corn’s Fib Objective for Reached at Seasonal Low?Grains tend to hit their seasonal lows here in early May, as we get into the critical May-June growing season. On the daily chart, corn has traded down from it’s 460’0 highs of last year, using a 50% HWB short at 402’2 to make the run down to it’s Fib objective of 316’6. With price and timing lining up for a bottom here, we are looking for 50% Half Way Back longs and are starting to see the “green shoots” of a rising market here, with a short-term long objectives of 327’6. Further upside will be necessary to challenge the new HWB short, setting up at 351’6, which is likely over the next couple of months. So, look to be long Corn, especially from prices close to the 310’0 level. And look to sell in the 351’6 - 363’5 area on a bounce into the HWB short area.

CORN FUTURES (ZC1!) MonthlyDates in the future with the greatest probability for a price high or price low.
The Djinn Predictive Indicators are simple mathematical equations. Once an equation is given to Siri the algorithm provides the future price swing date. Djinn Indicators work on all charts, for any asset category and in all time frames. Occasionally a Djinn Predictive Indicator will miss its prediction date by one candlestick. If multiple Djinn prediction dates are missed and are plowed through by same color Henikin Ashi candles the asset is being "reset". The "reset" is complete when Henikin Ashi candles are back in sync with Djinn price high or low prediction dates.
One way the Djinn Indicator is used to enter and exit trades:
For best results trade in the direction of the trend.
The Linear Regression channel is used to determine trend direction. The Linear Regression is set at 2 -2 30.
When a green Henikin Ashi candle intersects with the linear regression upper deviation line (green line) and both indicators intersect with a Djinn prediction date a sell is triggered.
When a red Henikin Ashi candle intersects with the linear regression lower deviation line (red line) and both indicators intersect with a Djinn prediction date a buy is triggered.
This trading strategy works on daily, weekly and Monthly Djinn Predictive charts.
This is not trading advice. Trade at your own risk.
