Corn CFD Outlook: Institutional Breakout Setup Explained🌽 CORN VS DOLLAR: BULLISH MOMENTUM CONFIRMED | Swing/Day Trade Opportunity
📊 MARKET OVERVIEW
Asset: CORN Futures (ZCH26) / USD
Current Price: $446.40 (Dec 23, 2025)
Market Status: ✅ Simple Moving Average Breakout Confirmed
Trade Type: Swing / Day Trade
Signal: 🟢 BULLISH SETUP ACTIVE
🎯 TRADE PLAN: "THIEF STRATEGY"
Entry Strategy - Layered Limit Orders (Multiple Entry Points)
The "Thief Strategy" uses multiple limit buy orders to average into positions at different price levels:
Suggested Layer Entries:
🔹 Layer 1: $444 (Current support zone)
🔹 Layer 2: $446 (Mid-range entry)
🔹 Layer 3: $448 (Breakout confirmation)
Note: You can increase/decrease layers based on your capital allocation and risk tolerance
Alternative: ✅ ANY PRICE LEVEL ENTRY - Current market allows flexible entry as breakout is confirmed
🛡️ RISK MANAGEMENT
Stop Loss (SL):
Thief OG's SL: $442
⚠️ IMPORTANT DISCLAIMER: Dear Traders (Thief OG's) - I am NOT recommending you set only my SL. This is YOUR trade, adjust your stop loss based on YOUR strategy, risk tolerance, and account size. Trade at your own risk.
💰 PROFIT TARGETS
Primary Target:
Target Price: $458
Rationale: Simple Moving Average acts as a strong resistance level (police barricade). Potential overbought conditions + trap formations suggest TAKE PROFITS at this level.
⚠️ IMPORTANT DISCLAIMER: Dear Traders (Thief OG's) - I am NOT recommending you set only my TP. Take profits at YOUR own discretion based on your trading plan. Make money, secure money at YOUR OWN RISK.
📈 CORRELATED PAIRS TO WATCH
Agricultural Complex:
ZW (Wheat) - Current: $514.38 (+1.06%) ↗️
Grains correlation - watch for sector strength
ZS (Soybeans) - Current: $1,053.55 ↘️
Inverse correlation - weakness supports corn demand
ZO (Oats) - Monitor for broader grain sentiment
Dollar Index:
DXY (US Dollar Index) - Current: 97.93 ↘️
KEY INVERSE CORRELATION: Weaker dollar = bullish for commodities
Dollar at October 2025 lows supports corn rally
Energy:
CL (Crude Oil) - Watch ethanol production correlation
🌍 FUNDAMENTAL FACTORS (LATEST)
✅ BULLISH CATALYSTS:
1. Supply-Demand Dynamics (USDA WASDE Dec 2025):
📉 US corn ending stocks reduced to 2.029 billion bushels (-125 million bushels)
📈 Exports raised to 3.2 billion bushels (RECORD HIGH)
✅ Strong export pace exceeding 2024 records
2. Export Demand Surge:
US export sales reaching record levels to Mexico, Colombia and other buyers
Outstanding US sales and inspections pointing to faster shipments
Recent sales: 186,000 MT to unknown destinations
3. Ethanol Production at ALL-TIME HIGHS:
US ethanol output rose to record weekly levels
Increased feedstock demand tightening available supplies
4. Dollar Weakness:
DXY fell to 97.93 on December 23, 2025, down 9.49% over the last 12 months
Weaker USD makes US corn more competitive globally
5. Supply Chain Issues:
Ukrainian shipments running below a year ago because of harvest and logistical delays
Prompt physical supplies tightened outside the US
6. Brazilian Factors:
Brazilian sellers withholding inventory focusing on planting
Creates near-term supply gaps favoring US exports
⚠️ RISK FACTORS TO MONITOR:
1. Federal Reserve Policy:
Markets pricing in two quarter-point rate reductions in 2026
Affects dollar direction and commodity flows
2. China Purchase Commitments:
Monitor China's soybean purchases (affects corn indirectly)
Trade policy uncertainty with new administration
3. South American Weather:
Brazilian corn planting 97% complete
Watch for production updates (Jan 2026 WASDE)
4. Technical Resistance:
Price approaching June 2025 highs around $450
Strong resistance zone requires momentum confirmation
📊 UPCOMING ECONOMIC EVENTS TO WATCH:
USDA WASDE Report - January 12, 2026 ⭐
Weekly Export Sales - Every Thursday
CFTC Commitment of Traders - Weekly Friday releases
Fed Policy Decisions - Monitor rate cut timing
Brazilian Crop Progress - Ongoing through Q1 2026
💡 TRADING STRATEGY SUMMARY:
✅ Setup Type: Bullish SMA breakout with fundamental support
✅ Entry Method: Layered limit orders OR current market price
✅ Risk/Reward: Favorable with tight stop vs. extended target
✅ Timeframe: Swing trade (multi-day) or day trade (intraday moves)
✅ Confirmation: Export data + dollar weakness + supply tightening
⚠️ FINAL DISCLAIMER:
This analysis is for educational purposes only. I am NOT providing financial advice or recommendations. Every trader must:
✅ Conduct their own due diligence
✅ Use proper position sizing for their account
✅ Set stop losses based on their risk tolerance
✅ Take profits according to their trading plan
✅ TRADE AT YOUR OWN RISK
Past performance does not guarantee future results.
🔔 ENGAGEMENT:
👍 LIKE if you found this analysis helpful!
💬 COMMENT your thoughts and trade setups below
📊 FOLLOW for more commodity market analysis
Let's make profitable trades together, Thief OG's! 🚀
Cornlong

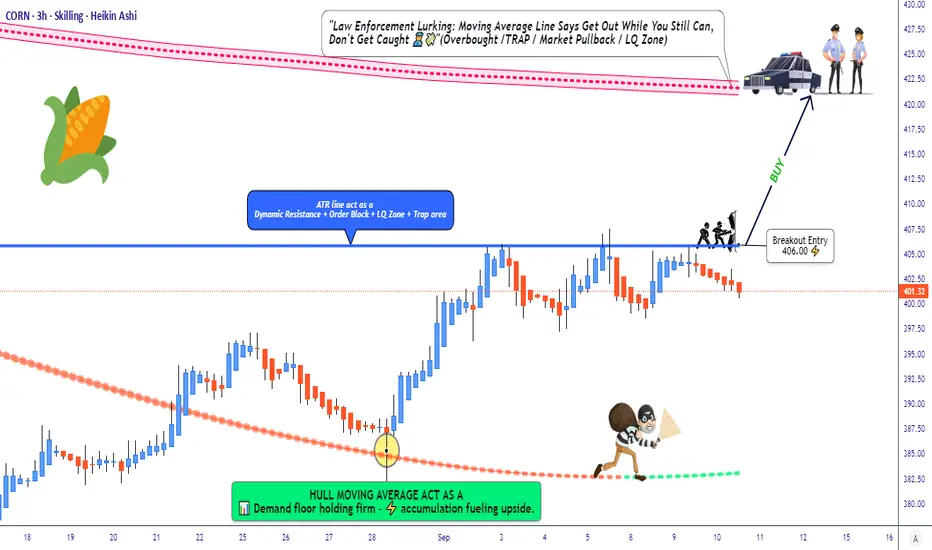
CORN Setup: Is This The Bullish Breakout We've Been Waiting For?🌽 CORN CFD | Money Heist Plan 🎭 (Swing / Day Trade)
🔑 Trading Plan (Thief Style Strategy)
Entry (Breakout Trigger): 📈 406.00 — when candle breaks ATR resistance, bullish plan activates.
Layering Entries (Thief Method):
Buy Limit Layers: 400.0 | 402.0 | 405.0 | 407.0 | 410.0 (flexible — adjust/add more based on breakout confirmation).
Layering helps manage entries & average position smartly.
Stop Loss (Thief’s Safety Lock): @ 395.00 🛑 after breakout trigger.
⚠️ Adjust SL based on your own risk tolerance.
Target (Escape Point): 🎯 421.00
Resistance zone + overbought condition = “police barricade” (take profits before getting trapped).
🌍 Why This Plan? | Thief Technical + Macro/Fundamental Mix
📊 Technical Edge
ATR breakout level at 406.00 ⚡
Momentum build-up near resistance, potential squeeze if volume spikes.
Layered entries provide risk-managed exposure.
🌽 CORN Market Data (10 Sep 2025)
Daily Change: -1.05% 🔴
Monthly Performance: +3.13% 🟢
Yearly Performance: -1.90% 🔴
👥 Investor Sentiment
Retail: 45% Long 😊 | 55% Short 😟 (slightly bearish bias).
Institutions: Net short 91,487 contracts 🏦 (hedging against oversupply).
😨 Fear & Greed Index
Score: 51/100 (Neutral 😐)
Balance between fear (supply risks) vs greed (demand resilience).
📉 Fundamentals & Macro Score
Supply Side
Record US production: 16.7B bushels 🟢
Brazil’s harvest adds oversupply pressure 🔴
Crop diseases (Tar Spot & Southern Rust) hurting yields 🔴
Demand Side
Exports YTD: +46.8% 🌍
Ethanol production: 1.105M barrels/day ⛽ (+30k WoW) 🟢
Tariff risks (China/Mexico) could slow trade 🔴
Macro Score: 6/10 → Moderately Bullish
🎯 Market Outlook Summary
Bull Case (Long) ✅
Strong exports (+28.6% YTD)
Biofuel/ethanol demand supporting floor
Technical rebound chances
Bear Case (Short) ❌
Record harvests (US/Brazil/Ukraine) = oversupply
Institutions scaling up shorts
Global glut risks
📌 Outlook Bias: Bearish-to-Neutral 🐻⚖️
Short-term pressure from supply glut, but demand stabilizes downside.
📌 Key Takeaways for Traders
Breakout Watch: 406.00 🚨
Layered Entry: Manage risk via staggered buys.
Target Zone: 421.00 (book profits before trap).
Macro Mix: Demand solid but supply risks dominate.
Watch List: CAPITALCOM:CORN , CBOT:ZS1! (Soybeans), CBOT:ZW1! (Wheat), CBOT:ZC1! (Corn Futures)
🔗 Pairs to Watch (in USD)
AMEX:SOYB (Soybeans CFD): Moves in lockstep with CORN due to shared ag trends.
AMEX:WEAT (Wheat CFD): Grains often trend together—keep an eye out!
TVC:USOIL : Influences ethanol demand, impacting CORN indirectly.
TVC:DXY (US Dollar Index): A rising USD could pressure commodity prices.
✨ “If you find value in my analysis, a 👍 and 🚀 boost is much appreciated — it helps me share more setups with the community!”
#CORN #Commodities #SwingTrade #DayTrade #ThiefStrategy #MoneyHeistPlan #Futures #LayeringStrategy #BreakoutTrading #Agriculture #Ethanol #TradingCommunity
CORN - Want some POP? Here it comes...maybe.Corn regained the orange Centerline.
Unfortunately I missed the retest.
But if we are lucky we get it again and then we can pull the trigger to get some nice crunchy Corn.
The Risk-Reward looks nice around the white Centerline.
BRB… off to the kitchen… 🌽🔥

#CORN 🟢 M5 LONG
Asset Long according to CFTC futures reports
In the zone of the Buyer of stock options
Global Imbalance Level M15
M5 imbalance
input: 5302 (on imbalance retest)
stop: 5252
tp-1: 5352
tp-2: 5450

CORN - Potential Upward MovementCORN replenishing at demand zone. It will likely bounce back up. Exit at supply zone.

corn (edible) zc1! | gap fillnice div loooking to confirm on 3d. tapped oversold. huge gap above.
think this could run up.

CORN LONG - Buy Entry - H4 ChartCORN LONG - Buy Entry - H4 Chart
Buy @ Market
Symbol: CORN
Timeframe: H4
Type: BUY
Entry Price: Buy @ Market
TP - BE - Resistance @ 774.91
TP - Resistance @ 802.92
Support @ 732.56

Mar 7, 22 Corn Pullback - Buy opp?In looking at Corn, you know that Crop Planting in the Ulraine is in less than 60 days. Who here thinks that that is actually going to happen with what's going on over there??
If they can't get their corn planted, there could be some supply issues. Add the shipping delays that the world is experiencing and the price could continue to go up. How high? Not sure. But last week corn was on a tear up. Today it is coming down some.
Maybe a Buy Order in around 720? I will keep watch to see how low it will go but 720 seems like a support level to me. Obviously if price crashes through it and moves down 700 would be the next logical support, and buying point.
Wheat has gone limit up for over 5 days now - Corn went crazy last week and today is in a pullback. I don't know for sure, but I believe over the next month, Corn will continue to go up. I just want to get in on a pullback and ride price up so that's what I'm looking for.
Stay safe.
Heiko

ZC long above 590 $Big chance for breaking key level for corn.
I will buy instrument only with low volatility higher our price and with Stopp loss not more than 1,5$.
Good luck :)


We broke out of the trend - Buy opportunity CornWe broke out of the negative trend line, backed up by higher low's indicated by the yellow increasing trendline, and a higher local high.
For sharp entry:
Wait for retracement till the horizontal line which acted as S/R recently, or wait till it retraces till the trendline.
For strong conviction:
Market order to get the length since it seems a new trend has started.
Take length with your own preferred SL/TP.
Trading is not about copying but about forming your own opinion.

CORN FUTURES (ZC1!) DailyDates in the future with the greatest probability for a price high or price low.
The Djinn Predictive Indicators are simple mathematical equations. Once an equation is given to Siri the algorithm provides the future price swing date. Djinn Indicators work on all charts, for any asset category and in all time frames. Occasionally a Djinn Predictive Indicator will miss its prediction date by one candlestick. If multiple Djinn prediction dates are missed and are plowed through by same color Henikin Ashi candles the asset is being "reset". The "reset" is complete when Henikin Ashi candles are back in sync with Djinn price high or low prediction dates.
One way the Djinn Indicator is used to enter and exit trades:
For best results trade in the direction of the trend.
The Linear Regression channel is used to determine trend direction. The Linear Regression is set at 2 -2 30.
When a green Henikin Ashi candle intersects with the linear regression upper deviation line (green line) and both indicators intersect with a Djinn prediction date a sell is triggered.
When a red Henikin Ashi candle intersects with the linear regression lower deviation line (red line) and both indicators intersect with a Djinn prediction date a buy is triggered.
This trading strategy works on daily, weekly and Monthly Djinn Predictive charts.
This is not trading advice. Trade at your own risk.

CORN FUTURES (ZC1!) WeeklyDates in the future with the greatest probability for a price high or price low.
The Djinn Predictive Indicators are simple mathematical equations. Once an equation is given to Siri the algorithm provides the future price swing date. Djinn Indicators work on all charts, for any asset category and in all time frames. Occasionally a Djinn Predictive Indicator will miss its prediction date by one candlestick. If multiple Djinn prediction dates are missed and are plowed through by same color Henikin Ashi candles the asset is being "reset". The "reset" is complete when Henikin Ashi candles are back in sync with Djinn price high or low prediction dates.
One way the Djinn Indicator is used to enter and exit trades:
For best results trade in the direction of the trend.
The Linear Regression channel is used to determine trend direction. The Linear Regression is set at 2 -2 30.
When a green Henikin Ashi candle intersects with the linear regression upper deviation line (green line) and both indicators intersect with a Djinn prediction date a sell is triggered.
When a red Henikin Ashi candle intersects with the linear regression lower deviation line (red line) and both indicators intersect with a Djinn prediction date a buy is triggered.
This trading strategy works on daily, weekly and Monthly Djinn Predictive charts.
This is not trading advice. Trade at your own risk.

CORNUSD LONG TRADE - PRICE HAS RETESTED NOW GOING UPHey traders,
This is my analysis for Corn currently on the H1 charts.
We can see that corn was trading in this descending triangle pattern.
Price broke out then retested before holding strong.
MACD Bearish momentum also seems to be decreasing
Daily trade analysis and ideas:
Telegram: t.me
Facebook: www.facebook.com
Twitter: forex_dojo
Instagram: www.instagram.com
Website: www.forexshinobi.com
Tiktok: @forexshinobi
ForexShinobi
