DXY relative perf. to predict market tops.Using intermarket analysis. During expensive markets, demand for US dollar grows - and often it correlates with stock market tops. Step further - we can use intermarket analysis of DXY/SPX. Look for trend break out and Higher Lows in the structure. ✅
Correction

EURGBP Is Looking For A Larger RecoveryEURGBP Is Looking For A Larger Recovery with a complex correction from a technical point of view and by Elliott wave theory.
EURGBP has turned around strongly this year and even broke above the downward channel connected from the 2023 highs. This suggests that wave C has ended at the lower side of a very big triangle, and the pair could still be recovering within subwave D. It may eventually reach the upper side of the pattern around 0.89 within W-X-Y formation, where wave Y can now be in play; ideally it will reach higher prices soon with break out from current triangle.

XAUUSD: Bullish Reversal Setup From Triangle SupportHello everyone, here is my breakdown of the current Gold setup.
Market Analysis
Gold (XAUUSD) continues to trade within a larger bullish market structure, maintaining higher lows above its key ascending Trend Line. After a strong impulsive rally that pushed the price above the 4,200 resistance, the market faced rejection near the top of the Range and entered a corrective phase. This correction evolved into a triangle pattern, with price now testing the Triangle Support Line, aligning closely with the horizontal Support area around 4,020 – 4,000 — a historically important demand zone.
Currently, the price is consolidating near the lower boundary of this structure, showing early signs of stabilization. This region also coincides with the previous breakout point, adding further confluence for potential buyer interest.
My Scenario & Strategy
I expect the price to hold above the Triangle Support Line and form a bullish reversal structure, signaling that buyers are once again defending this level. A confirmed breakout above the Triangle Resistance Line would indicate renewed bullish momentum and a potential continuation of the overall uptrend.
My primary target zone lies around 4,215, where previous resistance and the upper range boundary converge. However, if the support near 4,000 fails to hold, it could trigger a deeper correction toward 3,950, where the next demand zone is located. This setup offers a favorable risk-to-reward opportunity for traders anticipating a rebound from a major technical confluence zone.
That's the setup I'm tracking. Thank you for your attention, and always manage your risk.

Gold Market Update: Correction Mode 3750/3500 USD possible🟡 Where We Are Right now
After ripping to fresh records, gold snapped hard — WSJ logged the steepest one-day loss in years last week and a follow-through weekly drop as longs unwound.
Analysts across Kitco and others frame this as a technical/positioning correction after a parabolic run, with a fight around the $4k handle and scope to probe $3,750 → $3,500 if selling persists.
Sentiment/flows flipped: GLD and other gold ETFs saw notable outflows into the selloff after heavy YTD inflows. That flow reversal is consistent with a near-term correction phase.
🔻 Why the Market Is Correcting Now
1️⃣ Positioning & Froth Unwinds
The rally attracted outsized speculative length; once momentum cracked, forced de-risking kicked in. WSJ called out “long unwind” dynamics; Kitco says the correction could persist for months as near-term drivers fade.
2️⃣ $4k Failed on First Retest; Technical Break Triggered Stops
Kitco flagged a “fight for $4k” with downside risk if that shelf gives. Once sub-4k prints hit, systematic sellers likely accelerated.
3️⃣ Flow Flip in ETFs
After massive 2025 inflows, GLD posted a sharp daily outflow during the drop — classic late-cycle reversal behavior for a momentum move.
4️⃣ Macro Balance Less Supportive at the Margin
Even with long-term tailwinds (deficits/geopolitics), the recent leg higher ran ahead of fundamentals. Kitco and others note easing physical tightness and cooling central-bank buying pace compared with earlier in the year, removing a key prop for spot.
⚙️ Near-Term Levels That Matter (Tactical)
$4,000 → Battle zone. Regaining and holding above turns near-term tone neutral.
$3,750 → First meaningful downside target; aligns with multiple analysts’ “healthy pullback” zone.
$3,500 → Deeper correction magnet if flows/positioning continue to bleed; widely discussed as a plausible washout level.
🔮 4–8 Week Catalyst Map (What Can Push Price)
🏛️ Macro / Policy
Treasury Quarterly Refunding (Nov 5): Mix/size guidance can sway the long-end, USD, and real yields — key for gold. A heavier bill tilt (and steady coupons) is less threatening than a surprise coupon ramp.
Fed Communication Cadence: With the Oct 28–29 FOMC just occurred, watch minutes (Nov 19) + any guidance shifts. A less-dovish tone or firmer real yields = near-term headwind; growth scares or easing bias = support.
US Data Prints: CPI/PCE, NFP, ISM — anything that re-prices the path of real rates. (Direction of real yields remains the single most important macro input.)
💰 Flows & Positioning
ETF Flows (GLD/IAU): Continued outflows would confirm distribution; a turn back to net inflows often leads price inflections.
COT Positioning: If spec length compresses materially, downside fuel diminishes — setting up a cleaner base. (Track weekly CFTC updates.)
🪙 Physical / Seasonal
India Demand (festive/wedding season) and China retail demand can stabilize spot if discounts narrow and premiums re-emerge, but Kitco notes near-term tightness has eased versus the squeeze earlier in the rally.
📈 Base Case Outlook (Next 4–8 Weeks)
Trend: We’re in a bull-market correction — momentum currently with sellers — inside a bigger, intact secular uptrend. WSJ + Kitco both frame it as a technical consolidation after a near-vertical ascent.
Range Expectation: $3,500–$4,100 with whipsaws around $4k. The market likely tests $3,750 and could overshoot to $3,500 on negative macro surprises or persistent outflows before attempting a higher-low base.
Bull Re-acceleration Triggers:
(a) USD/real-yield rollover post-Refunding/Fed minutes
(b) A visible reversal in ETF flows
(c) Stabilization in Asia physical premiums
(d) Fresh geopolitical shocks
Bear Extension Risks:
(a) Firmer real yields / stronger USD
(b) Deeper ETF outflows and CTA/systematic supply
(c) Evidence of slower central-bank demand than H1
(d) Soft physical uptake into dips
⚔️ Trade / Hedge Tactics
If Underweight/Flat:
Stagger bids $3,760 → $3,520, scale size smaller into weakness; insist on confirmation (stops above prior day’s high) before adding.
If Long From Higher:
Respect $3,750 — below it, tighten or partially hedge (short miners, long USD vs. FX beta, or buy short-dated puts) targeting $3,500 as a potential flush.
If Momentum Trader:
Let $4,000 decide regime. Sustained reclaims with rising on-balance volume/ETF creations = green light for a bounce to $4,080–$4,150; failure = fade rallies into $3,950–$3,980.
🧭 What I’m Watching Day-to-Day
1️⃣ Treasury refunding headlines (Nov 5) and term-premium reaction.
2️⃣ Fed minutes (Nov 19) and any shift in balance-of-risks language.
3️⃣ GLD/IAU flow tape (creations/redemptions).
4️⃣ Kitco/WSJ desk color on physical tightness and dealer inventories.

Is Nasdaq Set for a Pullback? | Fibonacci Resistance Zone ahead!In this video I map out the idea of the Nasdaq being over extended and on route to approaching a key Fibonacci resistance level 27000 ,
This may set up a potential correction in the week ahead."
This is a counter-trend setup within a larger uptrend, so risk management is key. I'm not calling a top to the entire rally, but rather a healthy pullback to bring in new buyers."
I demonstrate how i see the price action moving forward over the course of the month ahead with valuable insights.
Tools used in this video Standard Fib , Fib Expansion, Fib extension + Anchored vwap and Volume profile and TPO chart

Deeper Correction + Opportunities in DEC/JAN. based on VIXNot sure if VIX FUT can be a lead indicator. The pattern narrows end of year or new year (historical correlation w/ corrections).
//VIX FUT trending above 20 means high probability corrections.

BTCUSDT: Bounce from Support Could Ignite Rally Toward $114KHello everyone, here is my breakdown of the current Bitcoin setup.
Market Analysis
Bitcoin (BTCUSDT) has recently transitioned from a bearish phase to a bullish structure after breaking out of a prolonged downward channel. The market had been forming a sequence of lower highs and lower lows until it found strong demand in the support zone around 110,000. From there, price began consolidating, indicating that sellers were losing control.A decisive breakout from the channel marked the end of bearish pressure, and since then, BTC has been moving inside a new upward channel, forming higher highs and higher lows — a clear sign of bullish momentum returning.
Currently, the price is approaching the resistance zone near 113,600–114,000, which previously acted as a key supply area. The ongoing structure suggests that buyers are attempting to push through this level and confirm a breakout continuation.
My Scenario & Strategy
In my view, BTC may attempt to retest the local support area near 111,000 before resuming its move higher. A successful bounce from this level would confirm that the new upward channel remains intact and provide a favorable long opportunity targeting the 114,000–115,000 zone.
If price breaks and holds above this resistance zone, it will likely open the door for a stronger bullish continuation toward 118,000 and beyond.
However, if BTC fails to maintain the channel support, a temporary correction back to the 110,000 area could occur before the next upward impulse.
That's the setup I'm tracking. Thank you for your attention, and always manage your risk.

Generals Charge, Soldiers Stall: Reading Bearish Divergence1. Context: The Battle Line Between Large and Small Caps
This week’s futures landscape paints a striking contrast between leadership and hesitation. In the CME equity index universe, the large caps — ES (E-mini S&P 500), NQ (E-mini NASDAQ 100), and YM (E-mini Dow Jones) — advanced as a united front, all opening above their prior week’s highs. The market generals were charging confidently uphill.
Yet, on the same battlefield, the RTY (E-mini Russell 2000) lagged behind. The small caps failed to take out the prior week’s high and opened below the aggressive gaps that marked their larger counterparts. In trader terms, breadth was narrowing. In storyteller terms, the generals were calling “forward!” — but the soldiers weren’t following.
Such divergences in participation often mark transition zones in market psychology. When large caps push while small caps stall, it doesn’t necessarily mean the campaign is lost — but it does mean confidence among the broader troops is weakening.
2. Reading the Divergence: When Breadth Narrows
The relationship between large-cap and small-cap indices often reveals more than just price action — it exposes the structure of conviction. In sustained bullish environments, small caps tend to lead or at least confirm the move. Their participation signals that risk appetite is healthy across the field, not confined to the biggest names.
When that breadth fades, the advance becomes fragile. A rally driven only by mega-cap components (the generals) can stretch further, but with decreasing participation, it becomes increasingly vulnerable to shocks. Traders who watch intermarket behavior know this phenomenon as bearish divergence — higher highs in the generals, lower or flat highs in the soldiers.
From a practical standpoint, narrowing breadth implies that fewer sectors are carrying the index higher. In other words, the market’s engine is running on fewer cylinders. This is not a timing trigger on its own, but it is a powerful contextual clue suggesting that volatility could expand when the leadership stumbles.
3. Quantifying the Risk: Supports and Market Depth
Looking beneath price, Order Flow (UnFilled Orders) provides a sense of where liquidity may reside once the current rally pauses. Key UFO support zones, acting as potential demand clusters, reveal how far the market might travel before encountering fresh buy interest.
From this week’s open:
ES shows its next support roughly 5.26% below current levels.
NQ sits around 6.25% below.
YM’s cushion lies approximately 9.39% beneath.
RTY, however, faces a much deeper air pocket — the next notable UFO support sits nearly 13.99% lower.
This asymmetry is critical. If markets retreat, small caps have the most unprotected downside terrain before reaching meaningful support. In other words, the generals may fall back a few miles, but the soldiers could tumble down the hill.
These percentages don’t guarantee a move — they outline the potential amplitude of correction if risk-off flows accelerate. The deeper the distance to support, the larger the volatility zone beneath.
4. Strategic View: Large Caps Lead, but Are They Overextended?
The current setup puts traders in a classic tactical dilemma:
Are the generals inspiring a new advance, or are they overextended and exposed?
Two plausible scenarios emerge:
Continuation scenario: If the small caps (RTY) regain strength and take out their prior week’s high, the breadth gap could close. This would validate the generals’ move and reestablish a broad-based advance.
Correction scenario: If RTY continues to stall while ES, NQ, and YM fail to sustain their gaps, it would confirm a divergence-led weakening. A close back below prior week’s highs could trigger a retreat toward the support zones identified earlier.
The idea is not to predict a reversal, but to prepare a framework in case weakness unfolds.
5. Contract Overview: E-mini and Micro Versions
To analyze or engage these markets, traders can study both E-mini and Micro E-mini contracts listed on the CME. These contracts represent standardized ways to participate in U.S. equity index movements, but at different notional sizes.
E-mini contracts (ES, NQ, YM, RTY) are the long-standing institutional benchmark instruments that track major U.S. equity indices with efficient liquidity and tight spreads.
Micro E-mini contracts (MES, MNQ, MYM, M2K) provide the same exposure pattern at one-tenth the size, offering more granularity in risk management and flexibility for smaller accounts or precise hedging.
It’s important to understand that these futures allow directional and hedging applications without requiring ownership of the underlying equities. However, as with any leveraged product, margin requirements can amplify both gains and losses. Traders should familiarize themselves with margin-to-equity ratios and maintenance requirements before participation.
S&P 500 – ES / MES
Minimum tick: 0.25 points
Tick value: $12.50 (E-mini) | $1.25 (Micro)
Typical margin: ≈ $21K (E-mini) | ≈ $2.1K (Micro)
NASDAQ 100 – NQ / MNQ
Minimum tick: 0.25 points
Tick value: $5.00 (E-mini) | $0.50 (Micro)
Typical margin: ≈ $30K (E-mini) | ≈ $3.0K (Micro)
Dow Jones – YM / MYM
Minimum tick: 1 point
Tick value: $5.00 (E-mini) | $0.50 (Micro)
Typical margin: ≈ $13K (E-mini) | ≈ $1.3K (Micro)
Russell 2000 – RTY / M2K
Minimum tick: 0.10 points
Tick value: $5.00 (E-mini) | $0.50 (Micro)
Typical margin: ≈ $9K (E-mini) | ≈ $0.9K (Micro)
Please note that all margin requirements are approximate and may be adjusted.
6. Risk Management Spotlight
Breadth divergences can test patience and positioning discipline. Managing exposure becomes as important as analyzing the signal itself.
Here are three core reminders:
Position Sizing: Adjust to volatility. If the distance to the nearest support is wide, scale down accordingly to maintain a consistent risk percentage per trade.
Stop-Loss Discipline: Predetermine exit points based on technical invalidation, not emotion.
Capital Preservation: Capital is ammunition; running out of it limits participation when true opportunity returns.
In the end, risk management isn’t about avoiding loss; it’s about surviving long enough to thrive when clarity returns. When markets are divided between generals and soldiers, maintaining balance becomes a trader’s greatest edge.
7. Educational Takeaway
The “generals vs. soldiers” analogy reminds us that market structure is not just about price—it’s about participation. When large caps surge but small caps lag, it signals a potential exhaustion point in the broader advance. The healthiest rallies are those in which all troops move in sync.
For traders and investors, breadth divergences serve as an early-warning system, not a countdown clock. They encourage a review of exposure, tighter stop placement, and a shift toward risk-awareness rather than return-chasing.
At this stage, the technical setup across U.S. index futures reads like a fragile truce: ES, NQ, and YM maintain their gains above prior-week highs, while RTY still lingers below. Should the soldiers eventually follow, confidence could rebuild. But if the generals start retreating first, the path toward their UFO supports could unfold quickly.
The core takeaway: breadth divergences don’t predict timing—they illuminate imbalance. Recognizing that imbalance early allows traders to respond intelligently instead of react emotionally when volatility expands.
When charting futures, the data provided could be delayed. Traders working with the ticker symbols discussed in this idea may prefer to use CME Group real-time data plan on TradingView: www.tradingview.com - This consideration is particularly important for shorter-term traders, whereas it may be less critical for those focused on longer-term trading strategies.
General Disclaimer:
The trade ideas presented herein are solely for illustrative purposes forming a part of a case study intended to demonstrate key principles in risk management within the context of the specific market scenarios discussed. These ideas are not to be interpreted as investment recommendations or financial advice. They do not endorse or promote any specific trading strategies, financial products, or services. The information provided is based on data believed to be reliable; however, its accuracy or completeness cannot be guaranteed. Trading in financial markets involves risks, including the potential loss of principal. Each individual should conduct their own research and consult with professional financial advisors before making any investment decisions. The author or publisher of this content bears no responsibility for any actions taken based on the information provided or for any resultant financial or other losses.

US vs China: should we be worried?Another ''Buy the rumor''? What EVERY trader should have in mind amid US-China Trade talks:
1. Beijing balks at enforcement or verification terms
China could reject U.S.‑demanded mechanisms for monitoring compliance, such as agricultural purchase tracking or fentanyl control checkpoints.
Past talks collapsed over the same issue, the U.S. insisting on verification, China citing sovereignty .
If Beijing signals “framework only, no enforcement,” Washington may treat it as stalling and re‑activate the 155 % tariff threat for Nov 1 .
2. Rare‑earth or tech export retaliation
China still holds leverage through critical‑mineral exports. If it re‑tightens rare‑earth or semiconductor‑material shipments, Washington could impose new export controls on Chinese tech, reigniting escalation.
That “supply‑chain weaponization” was what caused the early‑October market sell‑off and would likely repeat—hurting metals, EV, and chip stocks first.
3. Unexpected Trump pivot under political pressure
Analysts warn that Trump tends to shift abruptly when domestic optics change.
A new social‑media statement accusing Beijing of backsliding could nullify the deal narrative overnight .
Morgan Stanley’s Mike Wilson noted that any such reversal could trigger a 10–15 % equity correction due to “positioning unwind and tariff risk repricing” .
4. National‑security or Taiwan language slips
The framework explicitly avoids defense issues, but if Trump or Xi reference Taiwan or South China Sea policy during press remarks, it could politicize the summit and freeze trade clauses .
5. Market complacency and over‑positioning
Even with a signed “mini‑deal,” markets may have already priced it in.
JPMorgan research warns that a “buy‑the‑rumor, sell‑the‑news” reaction is likely if investors had pre‑emptively rotated into cyclicals .
Thin liquidity plus leveraged optimism could amplify any disappointment.
Bottom line:
Unless both leaders explicitly confirm a tariff suspension and avoid new geopolitical flashpoints, markets remain only one headline away from reversal. The biggest red flags to watch this week are (1) a stalled verification clause, (2) talk of renewed tech or rare‑earth restrictions, or (3) Trump implying that tariffs will still “go forward pending review.” Any of these could instantly shift sentiment from optimism to a fresh wave of selling.
#trade #correction #economy #finance #us #china #tariff #bitcoin #crypto #stocks #equities #trading

Euro will likely Continue its Decline to 1.1560 pointsHello traders, I want share with you my opinion about Euro. The market for the Euro has seen a significant shift in its structure, following a 'fake breakout' above the 1.1780 Resistance Level which led to a new ATH near 1.1920. This reversal initiated a new bearish phase, with the price action for EURUSD now being contained within a downward wedge. Currently, after finding support near the bottom of this formation, the asset is in a corrective rally, approaching the descending resistance line of the wedge. In my mind, this rally is a corrective move that will fail upon testing the wedge's resistance. I expect that the price will complete its small upward movement and be rejected from this dynamic resistance. I think this rejection will confirm that sellers remain in control and will trigger the next major decline. Therefore, I have placed my TP at the 1.1560 level, targeting the major buyer zone at the bottom of the structure. Please share this idea with your friends and click Boost 🚀

Oklo slides to the downside - Watch for the next levels In this video I cover the next important levels for Oklo during what I perseve as being the start
of a correction after pushing up some 900% over the past 5 months .
Tools used Fibs, Pivots, TPO chart and Volume Profile

XAUUSD: Price can Drop to Support Zone and Break Trend LineHello everyone, here is my breakdown of the current Gold setup.
Market Analysis
Gold has been in a very strong uptrend, which accelerated after breaking out of a prior Upward Channel. This led to a new, steeper rally along a major Trend Line, culminating in a new All-Time High around the 4380 mark.
Currently, after reaching that peak, the price has completed a healthy correction back down to the main Trend Line, which also aligns with the Support zone at the 4250 level. The price has bounced from this area and is now attempting to rally again.
My Scenario & Strategy
My scenario is a bearish one, built on the idea that this second attempt to rally will fail to make a new high. I'm looking for this current rally to lose momentum as it approaches the prior ATH of 4380. The key signal for me would be a strong and clear rejection from that area, showing that buyers no longer have the strength to continue pushing the price higher.
Therefore, the strategy is to watch for this failure at the highs. A confirmed reversal would validate the short scenario and should lead to a decline that breaks the major ascending Trend Line. The primary target for this corrective move is 4205, which is inside the major Support zone.
That's the setup I'm tracking. Thank you for your attention, and always manage your risk.

XAUUSD: Correction Within Uptrend – Demand Zone in FocusHello, traders! The gold market (XAUUSD) continues to demonstrate strong bullish momentum within a clearly defined uptrend structure that has been developing for several weeks. The movement is characterized by a sequence of higher highs and higher lows, supported by a well-respected ascending trend line. Throughout this upward phase, we’ve observed multiple breakouts from short-term consolidation zones and corrections — each confirming the dominance of buyers. These breakouts, marked on the chart, acted as continuation signals that pushed price toward new local highs.
Currently, after reaching the 4,360.00 area, gold entered a corrective phase, forming a short-term retracement. This pullback brought the price back to the previously broken trend line and into the Demand Zone 2 (4,200–4,250) — an area that has repeatedly served as strong support for the market.
My scenario for the development, if sellers manage to push the price below the 4,200.00 level, the structure will temporarily weaken, and we may see a deeper correction toward the next Demand Zone 2 (4,100–3,950). This zone would then act as a potential re-accumulation area before buyers could regain control. At the same time, Demand Zone 1, located higher, continues to confirm the overall bullish context — showing that gold maintains its medium-term uptrend despite the current short-term correction. Manage your risk!

Euro can Continue its Rally After a Minor CorrectionHello traders, I want share with you my opinion about Euro. The market for the Euro has been through a highly complex series of structural shifts, transitioning from a prior upward channel into a well-defined downward channel. After multiple failed rallies and a final drop into the 1.1600 buyer zone, the price action for EURUSD has shown a significant reversal, breaking out of the downward channel and establishing a new short-term bullish momentum. Currently, after this strong breakout, the asset is undergoing a minor corrective phase. In my mind, this price action represents a healthy pullback before the next leg higher. I expect that the price will make a small dip to find support, likely retesting the broken channel structure from above. I think a confirmed bounce from this area will validate the bullish breakout and trigger a continuation of the rally. Therefore, I have placed my TP at the major 1.1780 Resistance Level, which aligns with the seller zone and represents a logical objective for this recovery. Please share this idea with your friends and click Boost 🚀
Disclaimer: As part of ThinkMarkets’ Influencer Program, I am sponsored to share and publish their charts in my analysis.

Bears Looking To "Correct" Price Gap on EJHere we can see OANDA:EURJPY after many attempts of testing the Rising Support as Support, has broken down below it suggesting not much Support may come from it!!
This comes after Price had made a series of events that would seem a Correction is at hand.
Once Price made the Low (Point A) @ 174.812, Bulls were unable to make a Higher High and settled for a Lower High (Point B) at the 50% Retracement Level @ 176.384.
With the Low being the Confirmation Point for the potential Correction, once Price is able to Break Down below, this will Validate the Set-Up and will generate Short Opportunities to take Price down to the next Support Level which happens to be at the 1.236 Extension of 172.508!

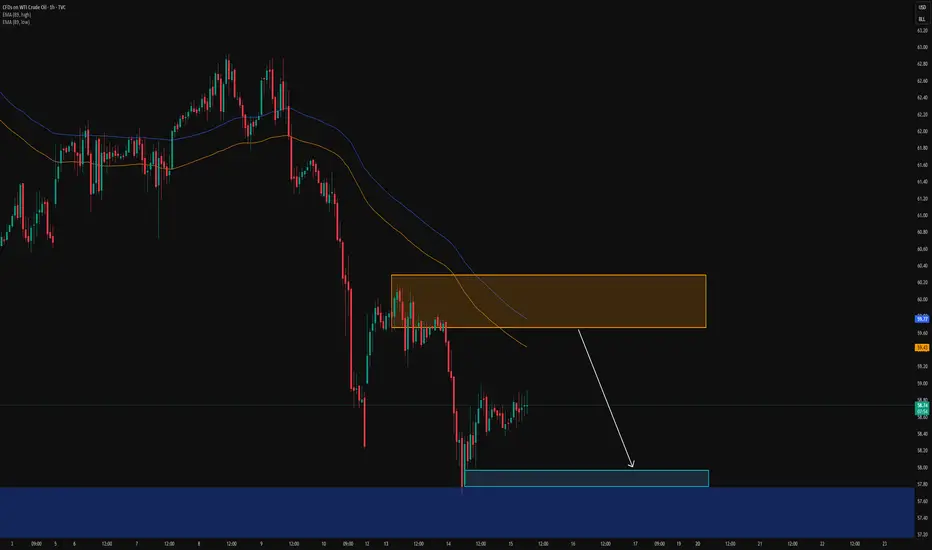
USOIL: Buy setups during higher-timeframe correctionOIL PRICE WEEKLY OUTLOOK
(Week of Oct 20-24, 2025)
Key Drivers & Risks
Updates in Supply, Demand, and Geopolitical News
EIA (week ending Oct 10): Crude inventories +3.5 million bbl; distillates −4.5 million bbl.
IEA OMR (Oct 2025): Upgraded global supply forecast: +3.0 mb/d in 2025 and +2.4 mb/d in 2026, while demand grows only ~0.7 mb/d per year ⇒ signaling a large surplus risk and downward pressure on prices.
OPEC (Oct 2025): Maintains demand growth outlook of +1.3 mb/d for 2025, but acknowledges a smaller deficit in 2026 as OPEC+ output rises; September production increased by ~630 kb/d.
Maritime risk in the Red Sea / Gulf of Aden: Over the weekend, a gas carrier reportedly caught fire following a possible attack off Yemen’s coast, leading to higher shipping risk premiums, though no major disruption to trade flows has been reported yet.
Watchlist for the Week Ahead
EIA Weekly Report (Oct 22): Focus on crude and distillate inventories, and any signs of policy or flow adjustments.
Maritime security updates in the Red Sea / Gulf of Aden / Strait of Hormuz — monitor frequency and severity of incidents.
China data: imports, refinery runs, and inventories — potential signals of stockpiling at lower price levels.
Any notable demand-side surprises (if any emerge).
Overall View
Oil prices are expected to gradually decline within a relatively narrow range of $70–$50 through mid-2026.
Short-term rebounds may occur due to low price levels and heightened transport risk headlines.
China’s potential restocking activity could provide limited demand-side support.
* Trend: assessed using at least three trend indicators, with market structure as the primary guide.
** Weak or Reversal Signals: Assessed based on one of our criteria for trend reversal signals.
*** Support/Resistance: Selected from multiple factors – static (Swing High, Swing Low, etc.), dynamic (EMA, MA, etc.), psychological (Fibonacci, RSI, etc.) – and determined based on the trader’s discretion.
**** Our advice takes into account all factors, including both fundamental and technical analysis. It is not intended as a profit target. We hope it can serve as a reference to help you trade more effectively. This advice is for informational purposes only and we assume no responsibility for any trading results based on it.
George Vann @ ZuperView
Gold can Fail its Rally and Fall Towards 4125Hello traders, I want share with you my opinion about Gold. The market for Gold has been through a highly complex and volatile phase after breaking down from its prior upward channel. This led to a significant fall into the support zone, followed by a strong recovery that has since pushed the price of XAU above a major ascending trend line. Currently, the asset is undergoing a corrective pull-back towards this broken trend line, setting the stage for what I believe is a critical test. In my mind, the price action is setting up a potential 'bull trap'. I expect that the price will first make a correction to the trend line, find support, and then attempt another rally. I think this rally will be exhaustive and will fail upon reaching the 4280 mark. A confirmed rejection from that peak would signal a major reversal. The subsequent decline should have enough momentum to break the major ascending trend line. Therefore, I have placed my TP for this reversal scenario at 4125. Please share this idea with your friends and click Boost 🚀
Disclaimer: As part of ThinkMarkets’ Influencer Program, I am sponsored to share and publish their charts in my analysis.

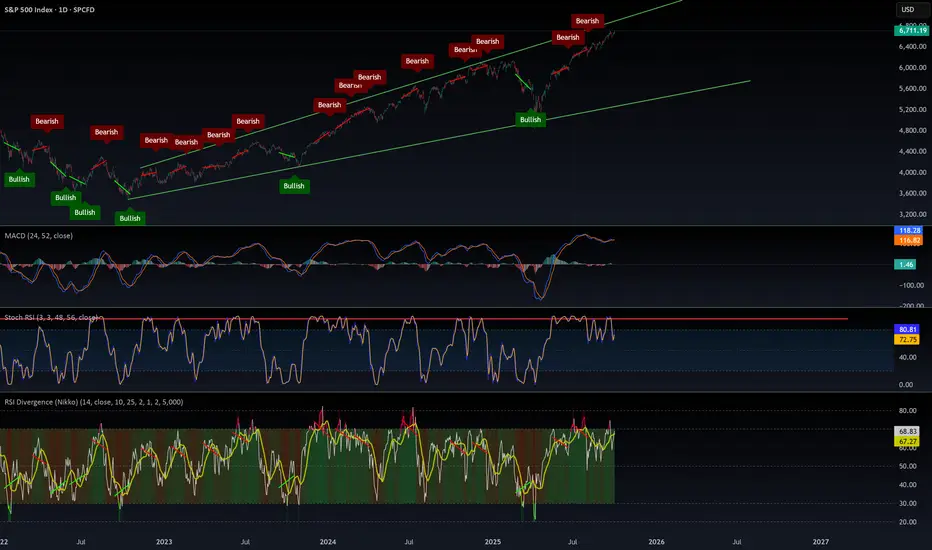
$SPX500 by all metrix this is overboughtMarkets can stay irrational longer than we can stay solvent. Right now, we’re at the top of this megaphone pattern, with everything extremely overbought in epic fashion.
⚠️ Caution: the odds of a serious correction are high — the chart points to a potential target around $5,650.
Sure, the madness can continue. The Fed can keep printing USD that pours into stocks instead of the real economy — until people are jobless, starving, and rioting for food.
📈 Enjoy the rally while it lasts, but use stop-losses. This market is dangerously overheated.
XAUUSD: Rally can Reach new ATH - $4520 pointsHello everyone, here is my breakdown of the current Gold setup.
Market Analysis
Gold has been in a very strong and complex uptrend. We saw the price break out of an initial range and then establish a major Trend Line that has guided it higher, breaking through key levels like Support 2 at 3670 and Support 1 at 4020.
Currently, the most significant event is that the price has broken out above its main Trend Line. After this powerful move, the market has entered a natural corrective phase and is pulling back towards this broken line for a classic retest. This is a critical area to watch.
My Scenario & Strategy
I'm looking for the price to complete its correction down to this main ascending trend line. The key signal for me would be a confirmed and strong bounce from this dynamic support, which would tell me the pullback is over and the primary trend is ready to accelerate.
Therefore, the strategy is to watch for this bounce. A successful defense of the trend line would validate the long scenario. My new target for the next impulsive wave higher is 4520, which would represent a new ATH.
That's the setup I'm tracking. Thank you for your attention, and always manage your risk.

BTCUSD: Pivot from Support level and Rally to $116KHello everyone, here is my breakdown of the current Bitcoin setup.
Market Analysis
From a broader perspective, after a powerful rally to a new All-Time High around 126000, the market for Bitcoin has entered a significant and complex corrective phase. This entire correction has been developing within the confines of a large triangle pattern, with price coiling between major support and resistance.
Currently, the price has rotated down and is now at a critical inflection point, testing the ascending support line of this multi-week triangle. This area also aligns with the major horizontal Support around the 110500 level, creating a strong confluence of support.
My Scenario & Strategy
I see this test of the Triangle Support Line as a logical point for buyers to step in and defend the structure, just as they have done at previous lows within this pattern.
I'm looking for the price to make one final small corrective dip into this support area. The key signal for me would be a confirmed and strong bounce from this level, which would indicate that the selling pressure is exhausted and a new rotation to the upside is beginning.
The primary target for this rotational move is 116000, a key level of prior price action inside the triangle.
That's the setup I'm tracking. Thank you for your attention, and always manage your risk.

BTCUSD Long: Reversal from the Bottom of the ChannelHello, traders! The price auction for BTCUSD has been controlled by a well-defined descending channel. This bearish structure has guided the price lower, with sellers showing strength by breaking below key levels, including the prior support at 111000. The auction has seen multiple tests of both the channel's supply and demand lines.
Currently, the auction is at a critical inflection point. After recently touching the lower demand line of the channel, a pivot point low has been established, and the price is now attempting to initiate a bullish reversal from these lows, showing early signs of buyer interest.
My scenario for the development of events is a bullish reversal from this channel support. I expect the price may make a brief corrective retest of the recent low to confirm buyer initiative. In my opinion, a successful hold will trigger a rally strong enough to reclaim the broken 111000 level, which is now resistance. The take-profit is therefore set at 112200, targeting the area just above this key structural point. Manage your risk!

EURUSD Short: Targeting the 1.1560 Demand ZoneHello, traders! The prior market structure for EURUSD was a complex downward wedge, from which the price eventually broke out and entered the current consolidation range. This range has been established between the 1.1795 supply 2 level and a demand zone at the lows, with the price action rotating between these two key boundaries.
Currently, the auction is at a critical inflection point. After bouncing twice from the demand zone at the bottom of the range, the price has rallied back up to test the key horizontal supply at the 1.1670 level. After a brief test, the price has been rejected from this area, showing that sellers are in control here.
My scenario for the development of events is a continuation of this decline from the supply level. I believe this rejection confirms the range is still active and that the next logical move is a rotation back down to the lows. In my opinion, the bearish initiative from this rejection will be strong enough to push the price to the demand zone. The take-profit is therefore set at 1.1560. Manage your risk!

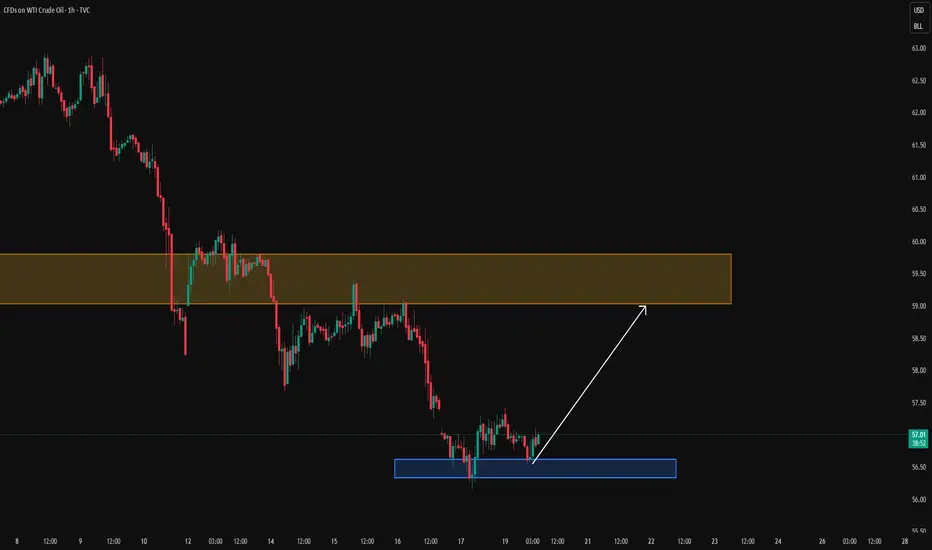
USOIL: Pullback within the correction on the 4h timeframeTo better understand my current outlook on USOIL, please refer to my previous higher-timeframe and fundamental analyses:
* Trend: assessed using at least three trend indicators, with market structure as the primary guide.
** Weak or Reversal Signals: Assessed based on one of our criteria for trend reversal signals.
*** Support/Resistance: Selected from multiple factors – static (Swing High, Swing Low, etc.), dynamic (EMA, MA, etc.), psychological (Fibonacci, RSI, etc.) – and determined based on the trader’s discretion.
**** Our advice takes into account all factors, including both fundamental and technical analysis. It is not intended as a profit target. We hope it can serve as a reference to help you trade more effectively. This advice is for informational purposes only and we assume no responsibility for any trading results based on it.
George Vann @ ZuperView