BTCUSD: Price can Rebound Up from Support line of PennantHello everyone, here is my breakdown of the current Bitcoin setup.
Market Analysis
Bitcoin has been through an incredibly volatile cycle. After reversing from a major low near the 109400 Support, we saw a powerful rally that led to a new ATH around 126000. Since that peak, the market has been in a deep and complex corrective phase.
Currently, this correction has taken the shape of a large pennant or wedge pattern. The price is consolidating and coiling within this structure. After a recent test of the upper boundary, the price is now pulling back towards the ascending support line for what I see as a critical test.
My Scenario & Strategy
I view the current pullback to the support line as a healthy correction and a logical place for buyers to show interest and defend the structure. A confirmed and strong bounce from this dynamic support would be the key signal for me that the pullback is over and the market is ready to challenge the highs again.
Therefore, the strategy is to watch for this bounce. A successful rebound is expected to lead to a rally that will break the intermediate Resistance at 117300. The primary target for the subsequent move is 118600, which aligns with the resistance line of the pennant.
That's the setup I'm tracking. Thank you for your attention, and always manage your risk.
Correction

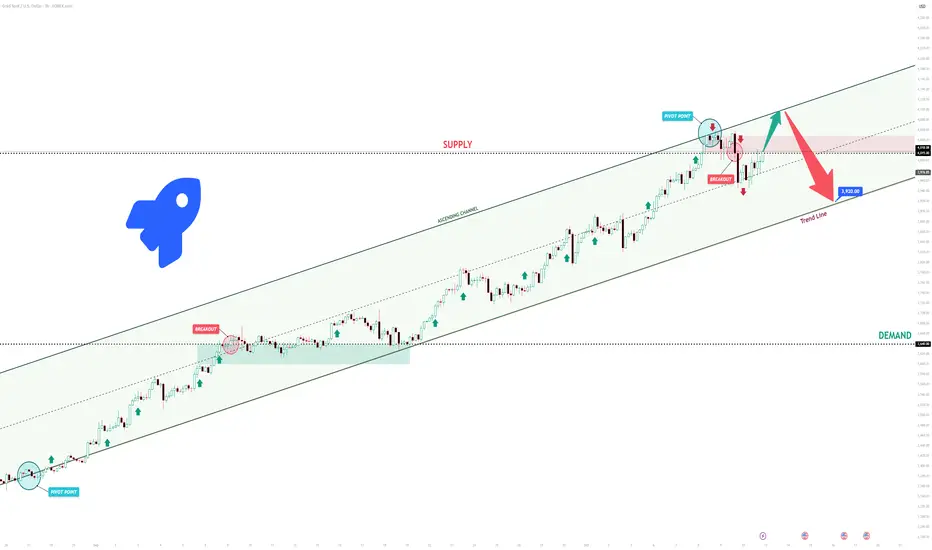
XAUUSD Short: Correction to 3920 Expected from the HighsHello, traders! The price auction for XAUUSD has been dominated by a strong bullish trend, which has been clearly defined by a large ascending channel. The market has consistently made higher highs and higher lows, breaking through key resistance levels like 3640 and showing that the buyer initiative has been in firm control of the trend.
Currently, the auction has reached a major point of contention at the 4015 supply level. The price is consolidating here, right below the upper resistance line of the ascending channel, after a failed initial attempt to break higher. This area represents a significant test for the continuation of the uptrend.
My scenario for the development of events is a 'blow-off top' followed by a correction. I believe the price will make one final push, breaking the 4015 level to touch the channel's upper resistance line. In my opinion, this move will be exhaustive, and a sharp reversal will occur from that line. The take-profit is therefore set at 3920, targeting a retest of the nearby trend line. Manage your risk!
EURUSDEURUSD
- Completed " 12345 " Impulsive Waves
- Double Bottom in Long Time Frame
- Consolidation Phase
- Bearish Channel as an corrective pattern in Short Time Frame
- Order Block

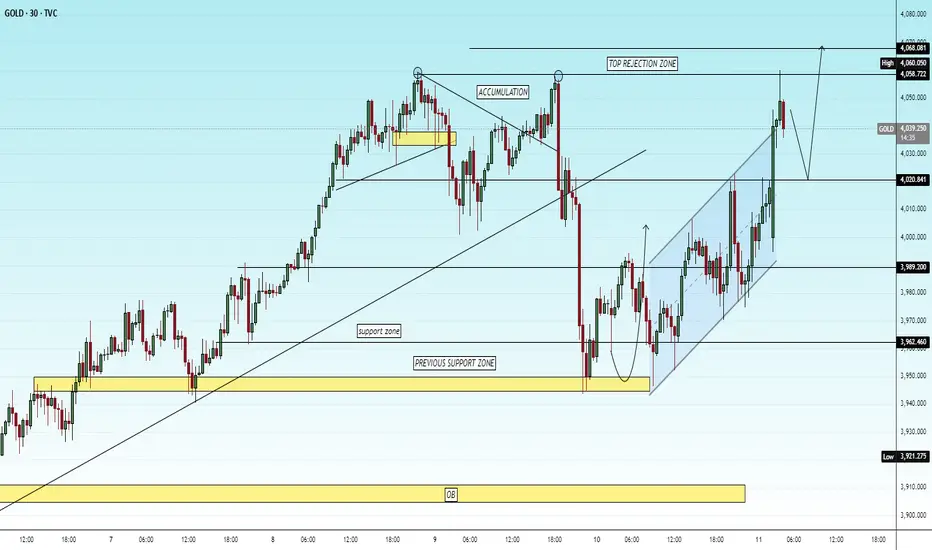
GOLD 30M – Fresh Bullish Structure FormingTVC:GOLD
🚀
Structure | Trend | Key Reaction Zones
Gold is respecting a rising channel after a strong reversal from the previous support zone.
Clear accumulation phase led to a clean bullish breakout above intraday structure.
Current price is holding near mid-channel with space for continuation toward the Top Rejection Zone.
Market Overview
After retesting the previous support base, Gold built strong bullish momentum, forming higher highs and higher lows inside a clean ascending channel. As long as 3989–4020 remains protected, buyers may aim for a clean continuation toward 4060–4068, the next liquidity zone. Short-term consolidation is possible before the next breakout leg toward the top rejection region.
Key Scenarios
✅ Bullish Case 🚀 → 🎯 Target 1: 4048 | 🎯 Target 2: 4060 | 🎯 Target 3: 4068
❌ Bearish Case 📉 → 🎯 Downside Target 1: 4020 | 🎯 Target 2: 3989
Current Levels to Watch
Resistance 🔴 : 4060 – 4068
Support 🟢 : 4020 – 3989
⚠️ Disclaimer: For educational purposes only. Not financial advice.
XAUUSD 15M – Channeling Higher After Demand Reaction TVC:GOLD
Structure | Trend | Key Reaction Zones
Price tapped perfectly into the previous support zone, triggering a sharp bullish recovery.
The market is now moving inside a rising channel, showing healthy bullish correction.
Key focus remains around 4 020 – 4 058, where rejection or breakout will confirm the next phase.
Market Overview
Gold reacted sharply from the prior demand zone, forming a textbook W-reversal structure followed by clean channel continuation. Buyers are currently maintaining control as long as price holds above 3 985 – 3 962 levels. A breakout above 4 020 could extend momentum toward the rejection zone near 4 058, completing the full bullish leg.
Key Scenarios
✅ Bullish Case 🚀 → 🎯 Target 1 : 4 020 | 🎯 Target 2 : 4 058 | 🎯 Target 3 : 4 080
❌ Bearish Case 📉 → 🎯 Target 1 : 3 985 | 🎯 Target 2 : 3 926
Current Levels to Watch
Resistance 🔴 : 4 020 – 4 058
Support 🟢 : 3 962 – 3 926
⚠️ Disclaimer: For educational purposes only. Not financial advice.

LINKUSDT – Possible Reversal After 5 Waves UpLINK has just completed a clear 5-wave impulsive move to the upside. With Wave V looking complete, there’s now a high probability of a corrective phase.
I’m watching for a potential drop towards the 17.5 USDT zone, which would be a significant percentage move from current levels.
📊 Potential Trade Levels:
Entry zone: 24.5 – 23.2 USDT
Stop Loss: 27.030 USDT
Target: 17.171 USDT
This scenario could unfold as an ABC correction.
⚠️ Disclaimer: This is just a personal trading idea based on Elliott Wave analysis, not financial advice. Please manage risk and do your own research before trading.

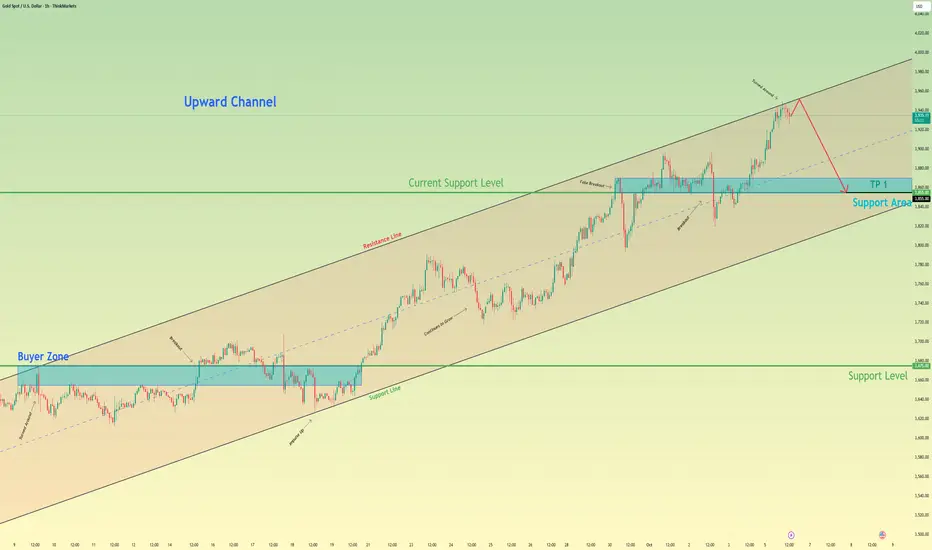
XAUUSD: Upward Trend will ContinueHello everyone, here is my breakdown of the current Gold setup.
Market Analysis
Gold has been in a very strong and well-defined Upward Channel. The trend has shown significant strength, breaking through multiple key resistance levels, such as the Support level 2 at 3630 and Support 1 at 3890, on its way up to new highs.
Currently, after testing the resistance line of the channel, the price has entered a natural corrective phase. This pullback is guiding the price down towards the ascending support line, which has consistently acted as the floor and the main trend line for this entire uptrend.
My Scenario & Strategy
I'm looking for this correction to complete as the price tests the ascending support line of the channel. A confirmed and strong bounce from this dynamic support would be the key signal for me that the pullback is over and buyers are ready to resume the rally.
Therefore, the strategy is to watch for this bounce. A successful defense of the channel's support would validate the long scenario. The primary target for the next impulsive wave higher is 4125, which aligns with the upper resistance area of the Upward Channel.
That's the setup I'm tracking. Thank you for your attention, and always manage your risk.

BTCUSD Long: Small Correction and Pump to new ATHHello, traders! The prior market structure for BTCUSD saw a powerful breakout from an ascending channel, which propelled the price to a new all-time high of 125600. Following this peak, the market has entered a new consolidation phase, forming a high-level range between the new ATH and the key support area around the 120400 level.
Currently, the price is in a corrective phase within this new range. After an initial drop from the highs and a minor bounce, the auction is heading back towards the major support zone located around the 120400 level for what I believe will be a decisive test of buyer strength.
My scenario for the development of events is a successful re-accumulation within this range. I believe the price will complete its correction down to the 120400 support zone. In my opinion, a confirmed bounce from this area will signal the end of the pullback and trigger the next impulsive wave higher, breaking the top of the range. The take-profit is therefore set at 125700, targeting a new ATH. Manage your risk!

GBPUSD 4H – Preparing for a Strong Reversal Move FX:GBPUSD
Market Overview
GBPUSD has been consolidating near a demand zone after repeated rejections from the upper descending trendline. Bulls may soon step in once liquidity below 1.3340 is grabbed. A confirmed break of the descending structure could open a clean upside push toward 1.3499 and 1.3666.
Key Scenarios
✅ Bullish Case 🚀 → Reversal from 1.3340 → 🎯 Target 1.3499 → 🎯 Target 1.3666
❌ Bearish Case 📉 → Break below 1.3300 → 🎯 Downside Target 1.3250
Current Levels to Watch
Resistance 🔴: 1.3499 / 1.3666
Support 🟢: 1.3340 / 1.3300
⚠️ Disclaimer: This analysis is for educational purposes only. Not financial advice.

EURUSD: Reversal from the Lows and Up MoveHello everyone, here is my breakdown of the current Euro setup.
Market Analysis
From a broader perspective, the price of EURUSD has shifted into a bearish phase after a prior Upward Channel failed and broke down. This reversal led to the formation of the current Downward Wedge, a pattern that has been guiding the price lower.
Currently, the price is at a critical decision point. After a complex series of moves, it is now testing the lower support line of the wedge, which aligns with the major Support at the 1.1615 level.
My Scenario & Strategy
My scenario is built on the idea of a 'fake breakdown' at this key support. I'm looking for the price to dip briefly below the wedge's support line into the Support zone to hunt for liquidity, and then quickly reverse.
A swift reclaim of the wedge's interior would be a powerful signal that sellers are exhausted and a bullish reversal is underway. This is the key confirmation I am waiting for.
Therefore, the strategy is to watch for this reclaim. A successful reversal would validate the long scenario. The primary target for the subsequent rally is the Wedge Resistance Line at the 1.1670.
That's the setup I'm tracking. Thank you for your attention, and always manage your risk.

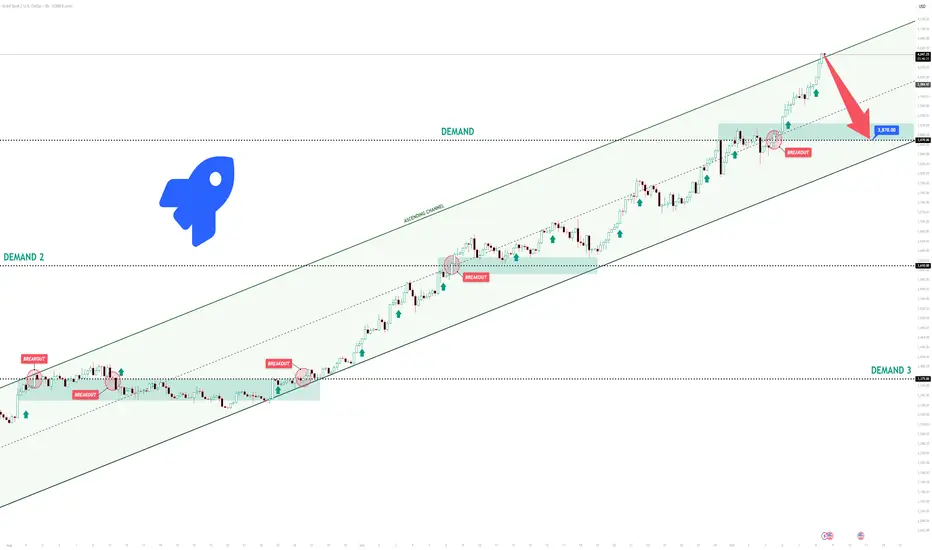
XAUUSD Short: Targeting 3870 on a Corrective MoveHello, traders! The price auction for XAUUSD has been moving within a clearly defined ascending channel, reflecting a persistent and well-structured bullish trend. This pattern has effectively guided the market upward, with buyers maintaining firm control and driving the price through several significant resistance levels, including 3375 and 3610. Such momentum highlights the continued dominance of bullish sentiment in recent sessions.
At the moment, the price is approaching a critical inflection point near the upper boundary of this channel. Following an aggressive rally, XAUUSD is now testing the channel’s ascending supply line, an area that often acts as a strong resistance zone. This is typically where selling pressure begins to surface, as traders look to capitalize on overextended bullish moves.
My short-term expectation is a corrective phase. I anticipate that the price may attempt a brief breakout above the channel’s resistance, forming a potential “fake breakout” trap for late buyers, before reversing lower. A confirmed rejection from this region would likely trigger a pullback toward the 3870 area, which aligns with prior structural support. Accordingly, I have placed my take-profit target at 3870. Manage your risk!
Gold can Start a Correction Towards 3855 SupportHello traders, I want share with you my opinion about Gold. The broader market context for Gold has been decidedly bullish since the price reversed and broke out from a prior descending channel. This structural shift established a new uptrend, which has since been neatly contained within a well-defined ascending channel. The price action for XAU has been creating a clear sequence of higher highs and higher lows. Currently, the asset is trading very close to the resistance line of this ascending channel, an area where sellers may re-emerge. My strategy is based on the expectation that the price will reach this line, be rejected, and then begin a corrective decline. I think after such a strong run, a pullback is a probable scenario. A confirmed reversal from this upper boundary would validate the short idea. Therefore, I have placed my TP at the 3855 current support level. Please share this idea with your friends and click Boost 🚀
Disclaimer: As part of ThinkMarkets’ Influencer Program, I am sponsored to share and publish their charts in my analysis.
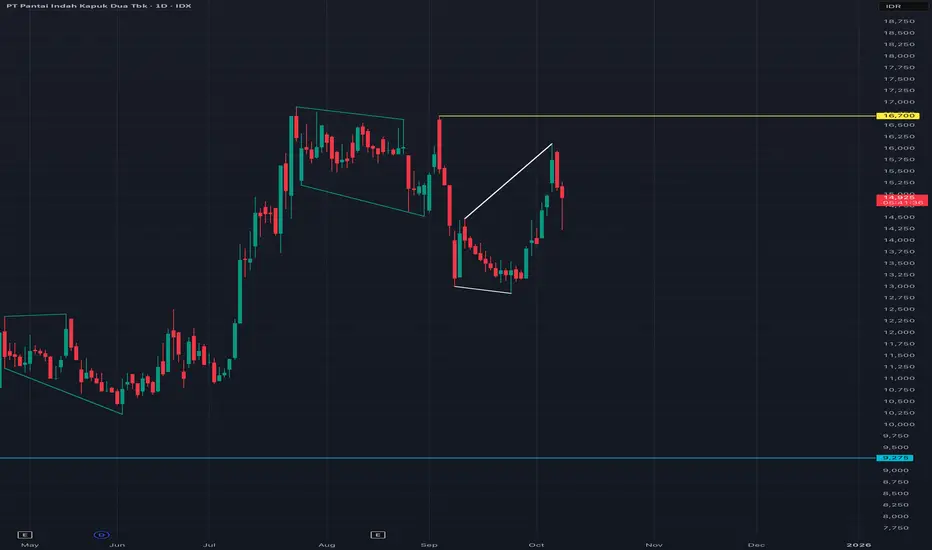
PANI UPDATE I expect this stock to drop below 12,850 without breaking above 16,700 for the moment.
If you plan to buy this stock, in my opinion, it’s a no buy for me at least until 12,850.
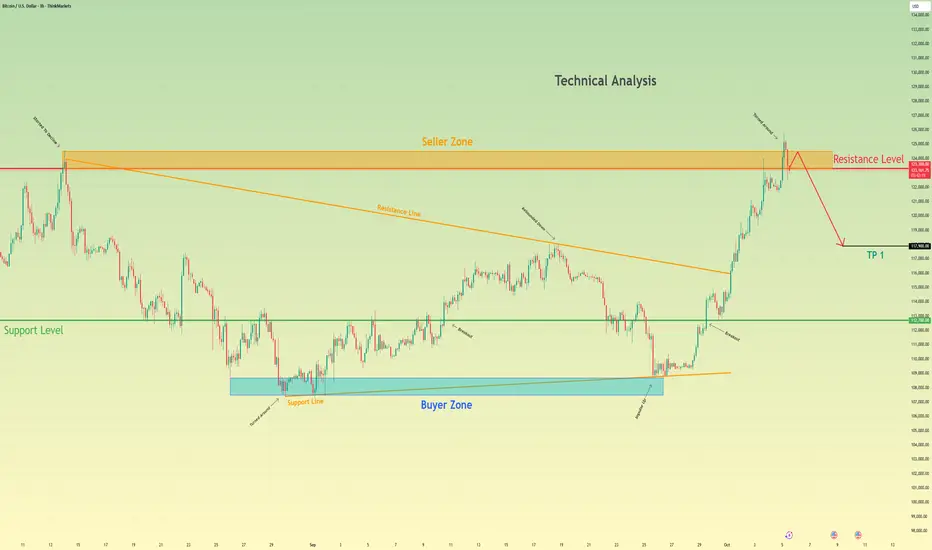
Bitcoin can Fail its Retest and Fall to 117900 pointsHello traders, I want share with you my opinion about Bitcoin. The market for Bitcoin has shown a significant sign of exhaustion and reversal after establishing a new all-time high at the 126000 level. Although this peak was preceded by a strong breakout from a prior downward wedge, the rally failed to sustain, leading to a sharp sell-off. This has shifted the market structure to a bearish bias, confirmed by a decisive breakdown below the key 123300 level. Currently, the price of BTC is in a minor corrective phase, rallying back towards this broken structure. This price action is setting up a classic retest of former support as new resistance. In my mind, this retest presents a high-probability opportunity for sellers. I expect that the price will make a small upward movement into the seller zone near 123300. I think a confirmed rejection from this area will validate the bearish reversal and trigger the next impulsive move downwards. Therefore, I have placed my TP at 117900, targeting a significant area of prior price action and liquidity. Please share this idea with your friends and click Boost 🚀
Disclaimer: As part of ThinkMarkets’ Influencer Program, I am sponsored to share and publish their charts in my analysis.
EURUSD Long: Bounce Expected from 1.1660 DemandHello, traders! The prior market structure for EURUSD was defined by a descending channel, from which the price eventually broke out and entered a new consolidation range. The price action within this range has seen a rotation from the 1.1780 supply level down to the 1.1660 demand level, where buyer initiative has re-emerged.
Currently, the auction is trading near this 1.1660 demand level after a reversal from the lows. The market is showing signs of building support in this zone, suggesting that the corrective move from the range highs may be complete.
My scenario for the development of events is that after a final small correction, the price will continue its growth within the consolidation. I believe a successful defense of the demand zone will trigger a new rotation to the upside. The take-profit is therefore set at 1.1750, targeting the upper portion of the range. Manage your risk!

EURUSD Short: Continuation Within the Downward WedgeHello, traders! The prior market structure for EURUSD was a bullish ascending channel, which failed and led to a breakdown. This reversal has established the current bearish market phase, which has taken the form of a downward wedge. This pattern has been guiding the price auction lower through a series of lower highs and lower lows, confirming that seller initiative is dominant.
Currently, the price action is consolidating within this wedge. Following a minor bounce, the market is showing signs of weakness and appears ready to continue the established downtrend, respecting the wedge's boundaries.
My scenario for the development of events is a direct continuation of the decline within this wedge. I expect the price to complete another leg down from the current levels. The take-profit is therefore set directly at the 1.1615 level, targeting the demand zone which aligns with the lower support line of the pattern. Manage your risk!

BTCUSD Long: Path to 123000 After BreakoutHello, traders! The prior market structure for BTCUSD saw a significant reversal after the price broke out of a descending channel. This shifted control to buyers and led to a prolonged consolidation phase, with the price auction building a range between the demand zone 2 near 109700 and the supply zone around the 117000 level.
Currently, this long period of balance has been resolved with a decisive breakout. A strong bullish initiative from the demand zone 2 has propelled BTCUSD above the 117000 supply level and out of the consolidation range. The market is now in a clear bullish expansion phase after breaking this key structural point.
My scenario for the development of events is a classic breakout and retest. I expect the price to make a corrective pullback to test the former resistance at the 117000 - 118000 supply zone as new support. In my opinion, a successful bounce from this zone would confirm the breakout's validity and trigger the next impulsive wave higher. The take-profit is therefore set at 123000. Manage your risk.

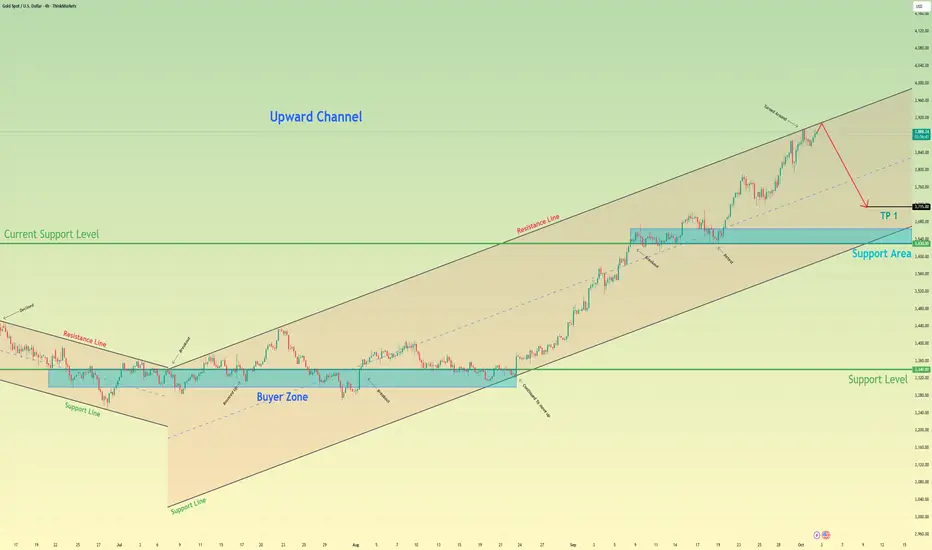
Gold can Start a Corrective Move After a Strong RallyHello traders, I want share with you my opinion about Gold. The broader market context for Gold has been decidedly bullish since the price reversed and broke out from a prior descending channel. This structural shift established a new uptrend, which has since been neatly contained within a well-defined ascending channel, guiding the price action of XAU higher through a series of higher highs and higher lows. After breaking two key levels, the price has completed another full rotation and is now at a critical inflection point. Currently, the asset is trading very close to the resistance line of this ascending channel. My strategy is based on the expectation that the price will reach this line and then be rejected, initiating a corrective decline. I think that after such a strong run, a pull-back is a probable scenario. A confirmed reversal from this upper boundary would validate the short idea. Therefore, I have placed my TP at 3715 points. As noted, this is an intermediate target not located at a major support zone, designed to capture the initial phase of the anticipated downward correction. Please share this idea with your friends and click Boost 🚀
Disclaimer: As part of ThinkMarkets’ Influencer Program, I am sponsored to share and publish their charts in my analysis.
Euro will potentially Fall to 1.1680 After a Fake RallyHello traders, I want share with you my opinion about Euro. The market dynamic for the Euro has shifted from bullish to corrective after the price broke down from a prior upward channel. This structural change has led to the formation of a large downward pennant, a consolidation pattern that has been guiding the price of EURUSD lower. The market is currently trading near the resistance line of this pennant, with volatility compressing as it approaches the apex, signaling that a significant move is imminent. In my mind, an immediate breakout from this pennant could be a deceptive move designed to trap buyers. I expect that the price may initially break out to the upside and rally towards the major 1.1800-1.1780 seller zone. I think this rally will fail upon testing this significant area of historical resistance, creating a 'bull trap'. A confirmed and strong rejection from this seller zone would validate the overarching bearish scenario and likely trigger a sharp reversal to the downside. Therefore, I have placed my TP at the 1.1680 level, representing a logical objective for the decline that would follow such a failed breakout. Please share this idea with your friends and click Boost 🚀
Disclaimer: As part of ThinkMarkets’ Influencer Program, I am sponsored to share and publish their charts in my analysis.

Bitcoin may be Rejected from Channel ResistanceHello traders, I want share with you my opinion about Bitcoin. The established market structure for Bitcoin remains bullish, with the price action being methodically guided higher within a well-defined upward channel. This pattern has been in effect since the resolution of a prior consolidation, creating a clear sequence of higher highs and higher lows. The price of BTC has just completed another full upward rotation within this structure and is now positioned at a critical inflection point. Currently, the asset is directly testing the upper boundary of the upward channel 2, a level which forms a powerful confluence of resistance with the horizontal 117500 - 118200 seller zone. In my mind, the resistance of this channel is likely to hold, initiating a corrective phase. I expect a rejection from this area, leading to a downward move that will break the current support level at 115600. I think this decline will continue towards the channel's main support line. Therefore, I have placed my TP at 113250, which aligns with this dynamic support line. Please share this idea with your friends and click Boost 🚀
Disclaimer: As part of ThinkMarkets’ Influencer Program, I am sponsored to share and publish their charts in my analysis.

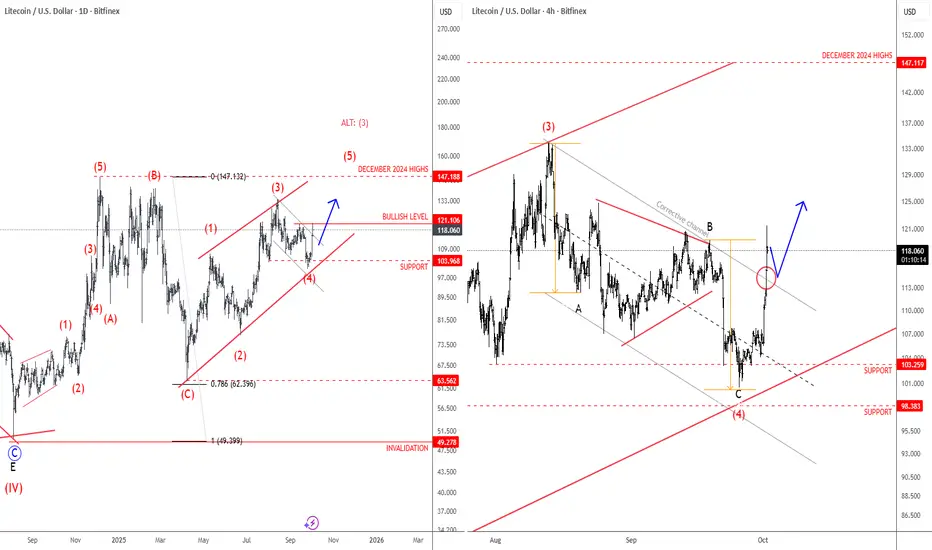
Litecoin Is Still Eyeing December 2024 HighsLitecoin turned lower recently, but we believe this is just another corrective retracement within a broader bullish trend, which has been showing higher swing lows since the rebound from the 78.6% Fibonacci level back in April. We expect that retracement down from the December highs will be fully retraced, meaning there’s room for a push up toward 147 as illustrated on a daily chart. It can be looking for wave (5) of a diagonal pattern, or alternatively, maybe even wave (3) if it extends decisively above upper diagonal line and goes for 200 area. In the 4-hour chart, we got a sharp rebound from projected support and back above channel resistance line after we noticed an ABC correction, so bulls are back, and we may easily see more gains toward December 2024 highs, just watch out for short-term pullbacks.
EURUSD: Rally to the 1.1805 Zone from Support LineHello everyone, here is my breakdown of the current Euro setup.
Market Analysis
From a broader perspective, the price of EURUSD has been consolidating and building value within a large upward wedge. This pattern is defined by a series of higher lows, forming an ascending support line, which shows that buyers are consistently stepping in at higher prices.
Currently, the price is in a corrective pullback phase. After testing the upper part of the wedge, it is now heading towards the ascending support line for what I see as a critical test of the bullish structure.
My Scenario & Strategy
My scenario is built on the idea that this upward wedge pattern will hold. This pullback to the support line is a classic 'buy the dip' opportunity within the established trend, and a logical place for the correction to end.
I'm looking for the price to complete its correction to the ascending support line. A confirmed bounce from this dynamic support would be the key signal that buyers have absorbed the selling pressure and are ready to initiate the next move higher.
Therefore, the strategy is to watch for this bounce. A successful rebound would validate the long scenario and should lead to a rally that breaks the 1.1780 Resistance. The primary target is the 1.1805 Resistance Zone.
That's the setup I'm tracking. Thank you for your attention, and always manage your risk.

XAUUSD Short: Targeting 3800 on a Corrective MoveHello, traders! The price auction for XAUUSD has been operating within a well-defined ascending channel, confirming a strong bullish trend. This structure has guided the price higher through a series of impulsive moves and pullbacks, with buyers maintaining the initiative throughout this phase.
Currently, the auction is at a critical inflection point at the top of this channel. The price has rallied to directly test the channel's ascending supply line after a strong run-up. This is a key area where sellers are expected to emerge and challenge the prevailing bullish momentum.
My scenario for the development of events is a short-term corrective move from these highs. I expect that sellers will defend the supply line and reject the price, initiating a downward rotation back towards the channel's support. A failure to break out higher would confirm a temporary correction is underway. The take-profit is therefore set at 3800, targeting the major demand zone. Manage your risk.
