EURGBP Steps Into A New Intraday Five-Wave Bullish ImpulseEURGBP has been moving in line with expectations over the past couple of weeks. After completing a projected higher-degree abc correction in wave B, it now appears that EURGBP has entered a new intraday five-wave bullish impulse, which could drive the price back toward the July highs.
Yesterday, we identified a lower-degree abc pullback in wave (ii). Since then, the pair has been trading nicely higher within wave (iii) of “iii.” This suggests further upside potential, though traders should remain cautious of a possible subwave (iv) pullback before the move continues.
Correction

EURUSD: Price break resistance and continue to growHello everyone, here is my breakdown of the current Euro setup.
Market Analysis
From a broader perspective, after exiting a prior Upward channel, the price action has entered a large consolidation phase. This has created a well-defined trading range between the major Support zone around the 1.1470 level and the key Resistance Zone up to the 1.1745 area, indicating a period of market balance.
Currently, the price is coiling within a large pennant formation, a classic sign of contracting volatility before a significant move. The price is now at a critical point, testing the descending resistance line of this pennant, which also aligns with the major horizontal Resistance at the 1.1710 level.
My Scenario & Strategy
My scenario is built on the idea that this pennant is a bullish continuation pattern, where buyers are absorbing supply before attempting the next leg higher. I'm anticipating a brief corrective dip from the current position before the main move begins. Following this, I expect buyers to take the initiative and push the price upwards, forcing a breakout above both the pennant's resistance line and the horizontal 1.1710 Resistance level.
A successful break and hold above the Resistance Zone would validate the long scenario. The primary target for this breakout move is 1.1820 points, representing a logical next objective for an upward expansion.
That's the setup I'm tracking. Thank you for your attention, and always manage your risk.

XAUUSD Short: Correction from Current HighsHello, traders! The prior price auction for XAUUSD was contained within a horizontal range, bounded by the Demand zone 2 near 3335. A key pivot point low initiated a strong bullish impulse, resulting in a breakout from this range and establishing the current bullish market structure, which transitioned the market into a new directional phase.
Currently, the price action is being guided by a well-defined ascending channel. The most recent impulse wave has carried XAU to the upper boundary of this channel, which represents dynamic resistance. The auction is now testing this ceiling after a strong rally, a key area where sellers may re-emerge to challenge the bullish initiative.
My scenario anticipates a corrective move from the current highs. The expectation is that the channel's resistance line will hold, leading to a rejection and a downward rotation back towards the channel's support. A failure to break higher would confirm that a short-term correction is likely. The take-profit is therefore set at 3410 points, targeting the confluence of the ascending channel's support line and the 3405 - 3415 demand area. Manage your risk!

EURUSD Short: Drop from Supply LevelHello, traders! The price auction for EURUSD has been characterized by a period of consolidation, which has formed a large symmetrical triangle. This pattern of contracting volatility was established by a series of key pivot points, with a pivot point high anchoring the 1.1720 supply area and a pivot point low defining the 1.1575 demand area. These actions have set the stage for the current state of market equilibrium, squeezing the price between the supply line and the demand line.
Currently, the auction is at a critical inflection point. Following a bounce from the ascending demand line, the price has rallied across the pattern and is now directly testing the descending supply line. This area represents a significant confluence of resistance, as it aligns with the horizontal 1.1720 - 1.1740 supply zone, a known territory of seller activity.
The primary scenario anticipates that sellers will successfully defend this resistance confluence and reject the current rally. A confirmed failure to break above the supply line would validate the integrity of the triangle pattern and likely initiate a new downward rotation. This would shift the short-term initiative back to the bears. The take-profit for this rotational play is therefore set at 1.1620, targeting the ascending demand line. Manage your risk!

BTCUSD Long: Breakout and Rally to 116500 levelHello, traders! The prior market structure for BTCUSD was a bullish ascending channel, which concluded with a pivot point high near the 118900 supply area. A subsequent breakdown from this channel shifted the market's momentum, initiating a corrective phase that took the form of a descending pennant. This bearish structure guided the price auction down to the major demand area around 112000, where a new pivot point low was established.
Currently, the price is consolidating within the final stages of this descending pennant, coiling between the supply and demand lines. The auction is approaching the apex of the pattern, but before a final resolution, one more test of the lower boundary is anticipated. The immediate expectation is for a final corrective move downwards to test the ascending demand line near the 112000 demand area.
The primary scenario anticipates a bullish resolution following this final test of support. The price is expected to reverse from the demand line, initiating a rally strong enough to break out above the descending supply line. Following the breakout, a brief retest of the broken line as new support would confirm the shift in control to buyers. This successful retest would then be the trigger for a continuation of the rally. The take-profit is therefore set at the 116500 level, targeting a key area of prior market imbalance. Manage your risk!

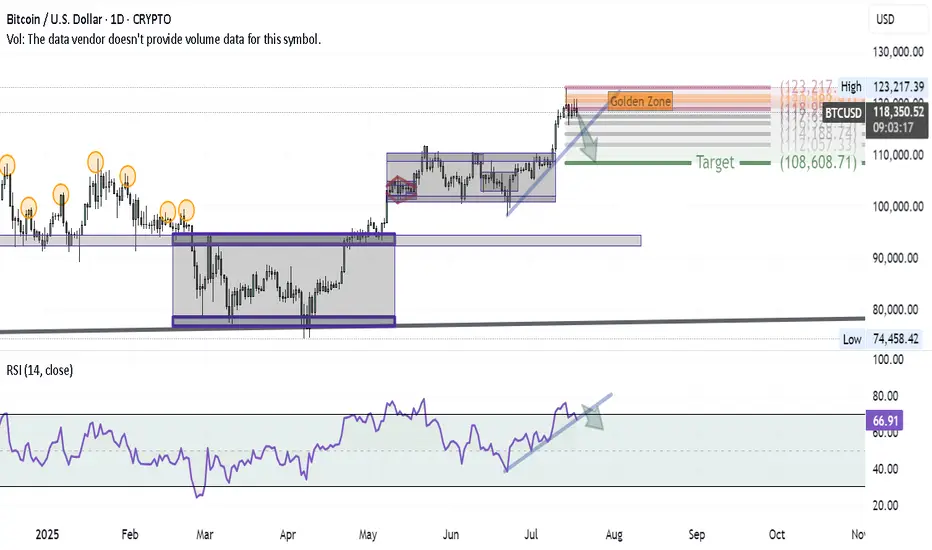
Bitcoin Correction Unfolding — First Wave in MotionAfter successfully hitting the BITCOIN target and anticipating a major correction in my previous ideas, here’s how the first wave of that correction is shaping up on the daily chart:
1- At the recent high, a Shooting Star candle formed — a classic reversal signal.
2- Using Volunacci analysis, the price retraced exactly to the Golden Zone, validating the first leg of the pullback.
3- The next step? A breakdown of the blue trendline would likely send us toward the Volunacci target at $108,600.
4- For confirmation, we're watching the RSI trendline — if it breaks down as well, it would strongly support the bearish continuation.
The setup is clean and developing as expected — it's all about following price and letting the chart guide the story.
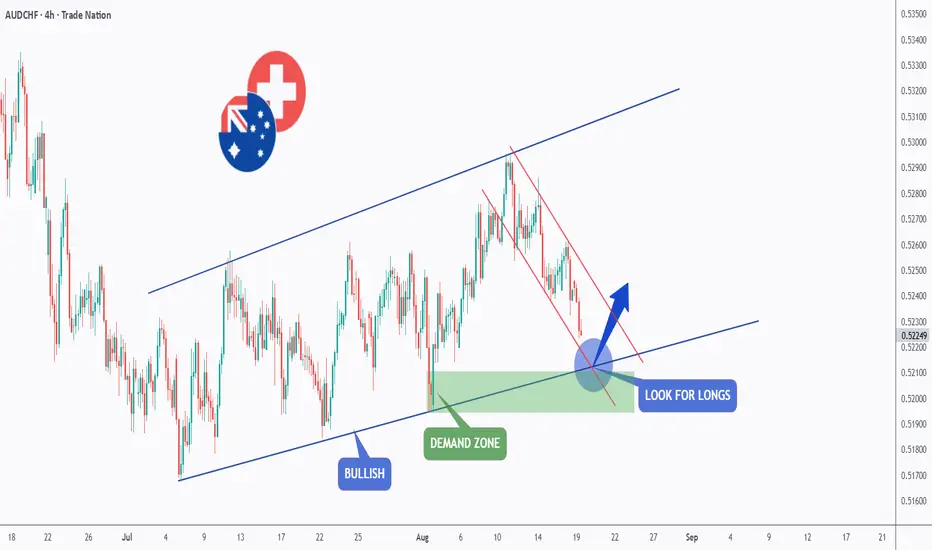
AUDCHF – Bulls Preparing for a Comeback?AUDCHF has been trading inside a broad ascending channel, showing a clear bullish structure. Recently, price pulled back within a corrective descending channel and is now approaching a key demand zone aligned with the lower bound of the channel.
🔎 If buyers step in here, we could see a potential reversal and continuation of the overall bullish trend.
👉 Plan: Look for long opportunities as price reacts around the demand zone and channel support.
📚 Always follow your trading plan regarding entry, risk management, and trade management.
Good luck!
All Strategies Are Good; If Managed Properly!
~Rich
Disclosure: I am part of Trade Nation's Influencer program and receive a monthly fee for using their TradingView charts in my analysis.
XAUUSD Long Thesis: Triangle Support Bounce to Target 3380Hello, traders! The recent history of the XAUUSD price auction has been defined by the establishment of two major pivot points, which have set the boundaries for the current market structure. A significant pivot point low was formed near the 3300 demand zone, which initiated a rally that was subsequently capped by a pivot point high at the 3390 supply zone. This sequence has transitioned the market from a directional phase into a period of balance and consolidation.
Currently, XAU is consolidating within a large symmetrical triangle, a pattern signifying equilibrium and contracting volatility. The price is being methodically squeezed between a descending supply line and an ascending demand line, indicating that energy is building for a significant move. The market is now in a corrective pullback, heading towards the ascending demand line for what is expected to be a critical test of buyers' resolve in this structure.
The working hypothesis is a long scenario based on a successful defense of the triangle's lower boundary. It is anticipated that the price will complete its corrective dip and test the ascending demand line, which originates from the 3315 demand zone. A confirmed bounce from this dynamic line would validate the pattern's integrity and trigger an upward rotation. The take-profit is therefore set at 3380. Manage your risk!

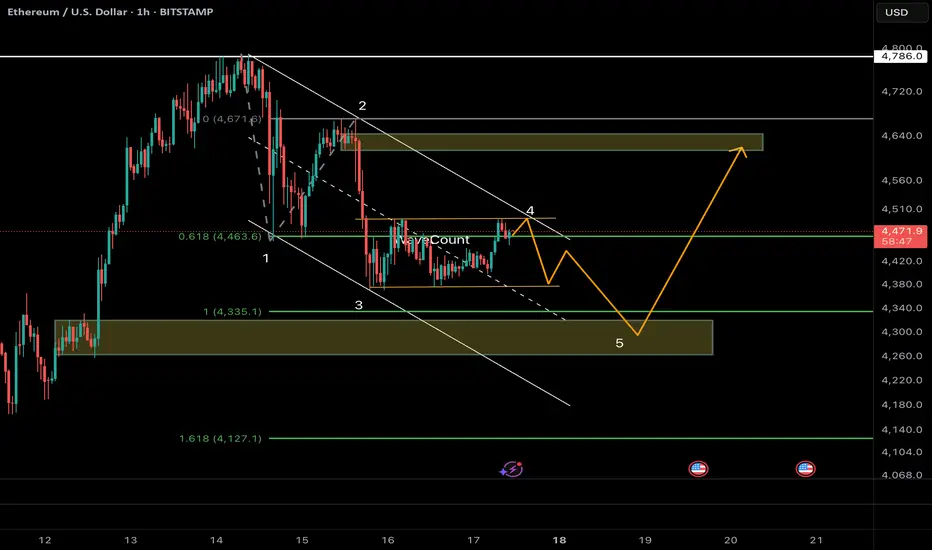
ETH/USDT :Wave 5 Drop to 4300–Rebound Rally to 4600 Before Crashthereum has likely completed a 5-wave impulsive rally from 1380 → 4780, with the channel break confirming a larger correction in progress.
Currently, price is unfolding Wave A of an ABC NeoWave structure, subdividing into 5 smaller waves.
⸻
🔹 Wave Count Breakdown
• Wave 1: Sharp drop to ~4335
• Wave 2: 61.8% rebound to 4463
• Wave 3: Extended selloff (161.8% of W1) → 4335
• Wave 4: Shallow retrace (~38.2% W3) → 4463
• Wave 5 (in progress): Targeting 4300–4270 (1.618 Fib + channel floor)
👉 Monowave count (~45–55) sits perfectly inside NeoWave’s 34–89 range → confirming impulsive character of this Wave A.
⸻
🔹 Next Path Scenarios
1. Wave A completion → Short-term bottom around 4300 (confluence of Fib + channel).
2. Wave B rebound → Relief rally toward 4460–4600 (38.2–50% retrace of A). Likely a sharp ABC bounce that traps late shorts.
3. Wave C decline → Resumption of downtrend toward 3800–4000, with risk of an extended drop to 3500 if momentum accelerates.
⸻
🔹 Technical Clues
• Fib structure: Textbook alternation (W2 deep / W4 shallow).
• RSI divergence at lows → exhaustion signals.
• Dominance context: USDT.D rebounding + BTC.D >60% → capital rotation suggests ETH downside risk remains elevated.
⸻
🔹 Trade Setup (Bias: Short with rebound play)
• Entry (short): Below 4400 on BOS confirmation (break of 4335).
• Targets: TP1 = 4300 (end of A), TP2 = 3800 (post-B wave).
• Rebound long: Consider 4300 → 4600 scalp if Wave A completes.
• Stops: Above 4463 (W4 high) for shorts / below 4300 for longs.
• Risk mgmt: 1–2% position size; trail stops along channel midline.
⸻
⚠️ Volatility remains extreme. Manage risk strictly—crypto psychology flips fast.
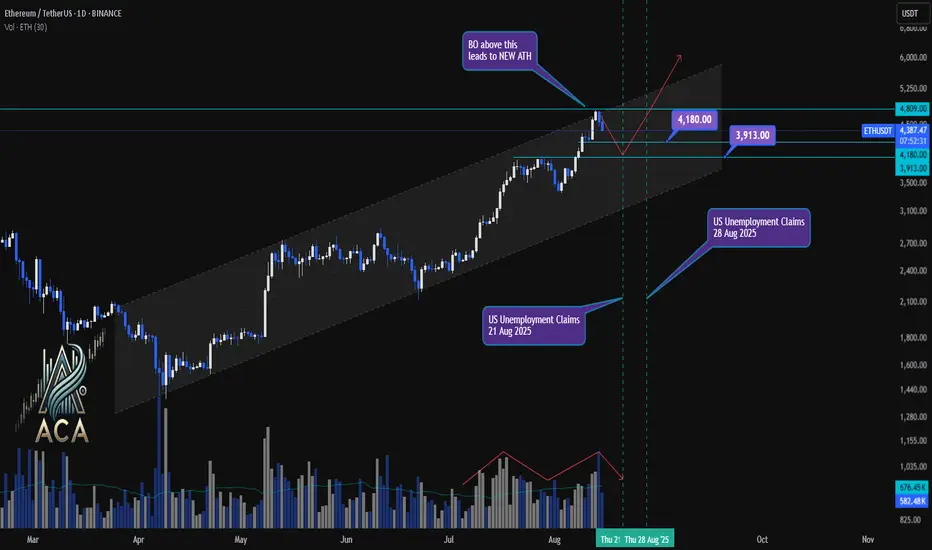
ETHUSDT 1D Chart Update | Channel Structure, Economic EventsETHUSDT 1D Chart Update | Channel Structure, Economic Events & ATH in Focus
🔍 Here’s the latest breakdown of ETH/USDT price action on the daily chart—channel dynamics, correction levels, and upcoming catalysts.
⏳ Daily Overview
Ethereum is trending strongly within an ascending channel, respecting both mid-level and upper resistance. After a local correction, price is rebounding with sturdy volume participation—signaling renewed interest from buyers.
📉 Correction Levels & Volume
- Recent correction found support at the $3,913 zone, with the $4,180 mark now acting as next key level.
- Volume has picked up on bullish candles, confirming the strength of this bounce.
- Correction appears healthy: price stayed within the channel, higher lows maintained.
📊 Channel, Economic Events & Breakout Setup
- ETH continues trading inside the established channel, posting higher highs and higher lows.
- Two major US economic events ahead—Unemployment Claims releases on Aug 21 and Aug 28, 2025—that could trigger volatility.
- Watch for a breakout (BO) above $4,809: crossing this sets the stage for a new all-time high (ATH).
🎯 Key Levels & Scenario
- $3,913: Correction support zone; ideal spot for high RR (risk/reward) long entries if retested.
- $4,180: Immediate resistance; flipping this could attract trend-following bulls.
- $4,809: Channel top and major breakout threshold. If price closes above, expect acceleration toward new ATH territory.
🚨 Conclusion:
ETH is pushing firmly inside its channel, with correction and volume patterns favoring bullish continuation. Key economic events may provide the volatility needed for a breakout move. Above $4,809, watch for new ATHs; dips to $3,913–$4,180 offer attractive re-entry zones for aggressive traders. Stay adaptive as August catalysts unfold.
Crypto Market Slows Down For A Pullback Within A Bullish TrendGood morning Crypto traders! Cryptocurrencies are coming slightly lower on the intraday basis due to stock market decline yesterday, but we still see them approaching support, so still be aware of a bounce and recovery at the end of the week or maybe next week because of an upcoming weekend. Crypto TOTAL market cap chart can be trading in wave »y« of a complex w-x-y correction in wave 4, unless it's a flat correction, but support is the same at 3.6T – 3.5T area, from where we may see a bullish continuation within wave 5.

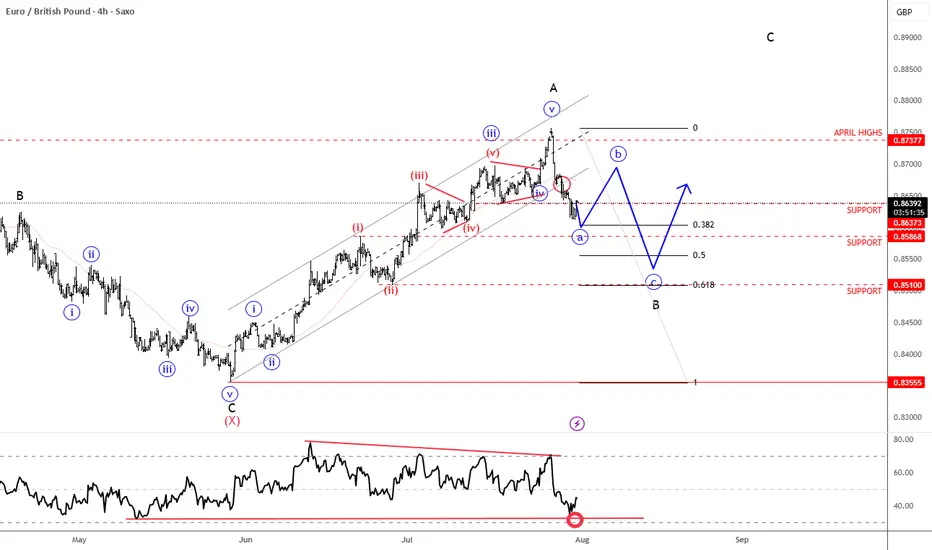
EURGBP Steps Into A Correction Within Ongoing RecoveryEURGBP is sharply down after reaching April highs for wave »v« of an impulse into wave A. As expected, the pair is now unfolding a three-wave abc corrective setback within higher-degree wave B. Currently, EURGBP is breaking below the channel support line in a sharp and impulsive projected wave »a«. A corrective recovery in wave »b« may follow, considering that RSI is already at the lower side of its range. Overall, we are still tracking this correction toward the 0.85x support area, which could act as a base before a potential bullish continuation higher into wave C.
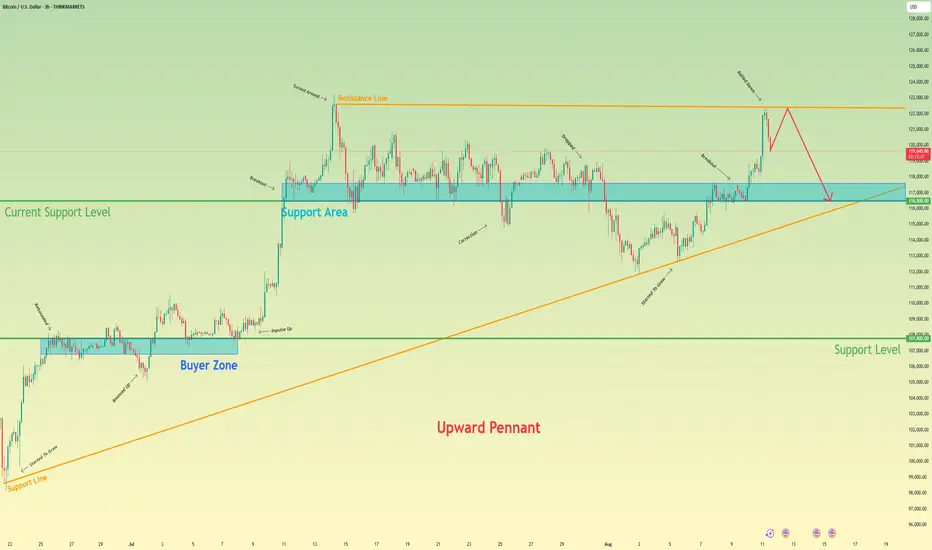
Bitcoin will rebound from resistance line and then continue fallHello traders, I want share with you my opinion about Bitcoin. After looking at the chart, we can see how the price entered an upward pennant and then at once rebounded up from the support line. Then it reached support level, which coincided with the buyer zone, and some time traded near this level, after which it made a small correction. Later it grew higher to 107800 level, breaking it and then made a retest. After this movement, BTC made an impulse up from the support level and rose to the current support level, which coincided with the support area and soon broke it. Later, it BTC rose to the resistance line of the pennant and then made a correction to the support area and started to trades inside. But later it made a fake breakout of the current support level and then tried to back up, but failed and dropped to the support line of support line of upward pennant. Then BTC turned around and started to grow, and soon broke the 116500 level one more time. After this, it reached the resistance line of the pennant, and it turned around and started to decline. In my mind, BTC will grow to the resistance line and then continue to decline 116500 support level. That's why it's my current TP. Please share this idea with your friends and click Boost 🚀
Disclaimer: As part of ThinkMarkets’ Influencer Program, I am sponsored to share and publish their charts in my analysis.
Big CorrectionThe S&P index.
The chart shows the potential end of the final rally from the 2009 low.
Currently, with this rally from the recent 4,800 low, we are still in a correction period that will end in late October (highs and lows are irrelevant), & We have a date coming up in August so let's see what happens there.
After this period, we will have a rally combined with uncertainty and unjustified speculative movements (bubble) that could take us to the final peak, which I expect in 2026.
This remains a possibility, but don't base your trades on it. However, caution is often good.

C / Usdt BINANCE:CUSDT
Interesting but risk is involve enjoy but risky. Something is cooked.
Disclaimer : Not financial advice.

Corrective Dip or New Downtrend on the S&P 500 Futures?🟣 1. Impulses vs. Corrections – The Classical View
When price trends, it doesn't move in a straight line. Instead, it alternates between directional movements called impulses and counter-directional pauses or retracements known as corrections. Most analysts define an impulse as a sharp, dominant move in the direction of the trend—typically accompanied by rising volume and momentum indicators. Corrections, on the other hand, tend to be slower, overlapping, and often occur with declining volume.
Common methods to identify impulses vs. corrections include:
Swing structure: Higher highs and higher lows suggest impulse; overlapping lows suggest correction.
Fibonacci retracements: Corrections often retrace up to 61.8% of a prior impulse.
Moving averages: Price above a rising MA is often viewed as impulse territory.
Volume analysis and oscillators such as RSI or MACD are used to confirm price behavior.
Despite the abundance of methods, the distinction between impulses and corrections often remains subjective. That’s where the Directional Movement Index (DMI) provides an objective lens—especially when paired with price action.
🟣 2. Rethinking Impulses with the DMI Indicator
The Directional Movement Index (DMI), developed by J. Welles Wilder, offers a quantitative way to assess the strength and direction of price movement. It breaks down market activity into three components:
+DMI (Positive Directional Movement Index): Measures the strength of upward movements.
−DMI (Negative Directional Movement Index): Measures the strength of downward movements.
ADX (Average Directional Index): Quantifies overall trend strength but is optional in this discussion.
The key to applying DMI lies in the crossover between +DMI and -DMI:
When +DMI > -DMI, upward price moves dominate—suggesting bullish impulses.
When −DMI > +DMI, downward moves dominate—suggesting bearish impulses.
Calculation is based on a comparison of successive highs and lows over a specific lookback period—commonly set to 14 or 20 periods.
While EMAs track trend direction and momentum, DMI helps dissect who’s in control. This makes it a powerful filter when evaluating whether a breakdown or breakout is likely to become an impulsive trend—or just another correction in disguise.
🟣 3. Case Study – Two Breakdowns, Two Outcomes
Let’s apply this logic to two recent moments on the E-mini S&P 500 Futures (ES) daily chart.
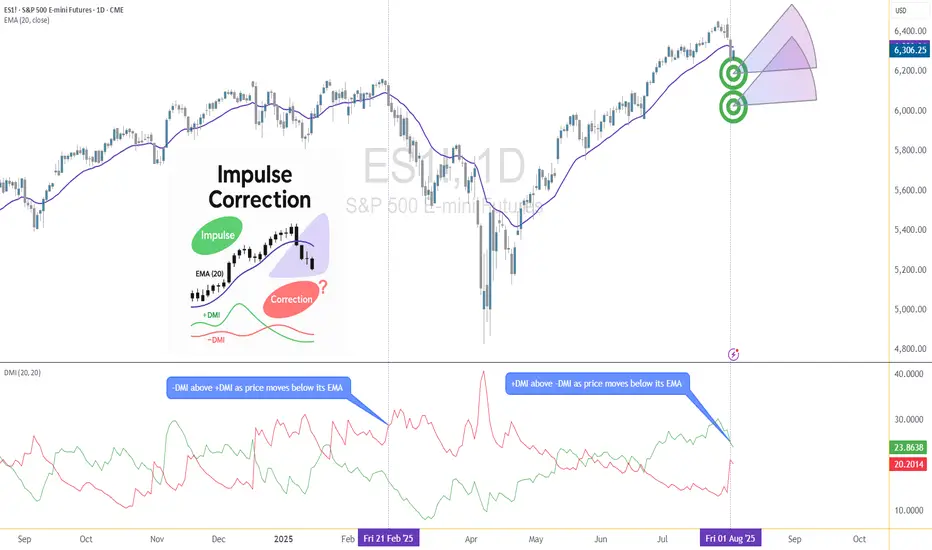
🔹 Feb 21, 2025 Breakdown
Price broke sharply below the 20-period EMA. At first glance, this looked like a potential trend reversal. The DMI confirmed this suspicion: −DMI surged above +DMI, signaling downside impulses were in control. The market followed through with a clear downtrend, confirming the move was not just a pullback—it was a shift in market structure.
🔹 Aug 1, 2025 Breakdown
A similar sharp break below the 20 EMA just occurred again. However, this time +DMI remains above −DMI, despite the bearish price action. This divergence tells a different story: the breakdown may not be impulsive in nature. Instead, it's likely a corrective dip within a broader uptrend, where buyers are still the dominant force.
This is a textbook example of how a moving average crossover without DMI confirmation can mislead traders. By combining these tools, we’re able to make more informed decisions about whether price action is signaling a true shift—or just a pause.
🟣 4. CME Product Specs – ES vs. MES
Traders can express directional views on the S&P 500 using two primary CME futures contracts: the E-mini S&P 500 Futures (ES) and the Micro E-mini S&P 500 Futures (MES). Both track the same underlying index but differ in size, capital requirement, and tick value.
✅ E-mini S&P 500 Futures (ES)
Symbol: ES
Contract Size: $50 x S&P 500 Index
Tick Size: 0.25 index points
Tick Value: $12.50
Initial Margin: Approximately $21,000 (varies by broker and through time)
Market Hours: Nearly 24/6
✅ Micro E-mini S&P 500 Futures (MES)
Symbol: MES
Contract Size: $5 x S&P 500 Index
Tick Size: 0.25 index points
Tick Value: $1.25
Initial Margin: Approximately $2,100 (varies by broker and through time)
The Micro contract provides access to the same market structure, liquidity, and price movement as the E-mini, but with a fraction of the exposure—making it ideal for smaller accounts or more precise position sizing.
🟣 5. Risk Management Matters
Understanding whether a market move is impulsive or corrective isn’t just academic—it’s the difference between positioning with the dominant flow or fighting it. Traders often get trapped by sharp moves that appear trend-defining but are simply noise or temporary pullbacks.
Using tools like DMI to confirm whether directional strength supports price action provides a layer of risk filtration. It prevents overreaction to every EMA crossover or sudden price drop.
Stop-loss orders become vital in both impulsive and corrective conditions. In impulsive environments, stops help lock in profits while protecting from reversals. In corrective phases, they act as circuit breakers against breakouts that fail.
Moreover, knowing the product you're trading is critical:
A single ES contract controls ~$320,000 of notional value.
An MES contract controls ~$32,000.
This disparity means poor sizing on ES can magnify errors, while proper sizing on MES can offer flexibility to test, scale, and hedge with tighter capital control.
Whether you're reacting to price or preparing for continuation, risk management is the only constant. It’s what turns analysis into disciplined execution.
When charting futures, the data provided could be delayed. Traders working with the ticker symbols discussed in this idea may prefer to use CME Group real-time data plan on TradingView: www.tradingview.com - This consideration is particularly important for shorter-term traders, whereas it may be less critical for those focused on longer-term trading strategies.
General Disclaimer:
The trade ideas presented herein are solely for illustrative purposes forming a part of a case study intended to demonstrate key principles in risk management within the context of the specific market scenarios discussed. These ideas are not to be interpreted as investment recommendations or financial advice. They do not endorse or promote any specific trading strategies, financial products, or services. The information provided is based on data believed to be reliable; however, its accuracy or completeness cannot be guaranteed. Trading in financial markets involves risks, including the potential loss of principal. Each individual should conduct their own research and consult with professional financial advisors before making any investment decisions. The author or publisher of this content bears no responsibility for any actions taken based on the information provided or for any resultant financial or other losses.
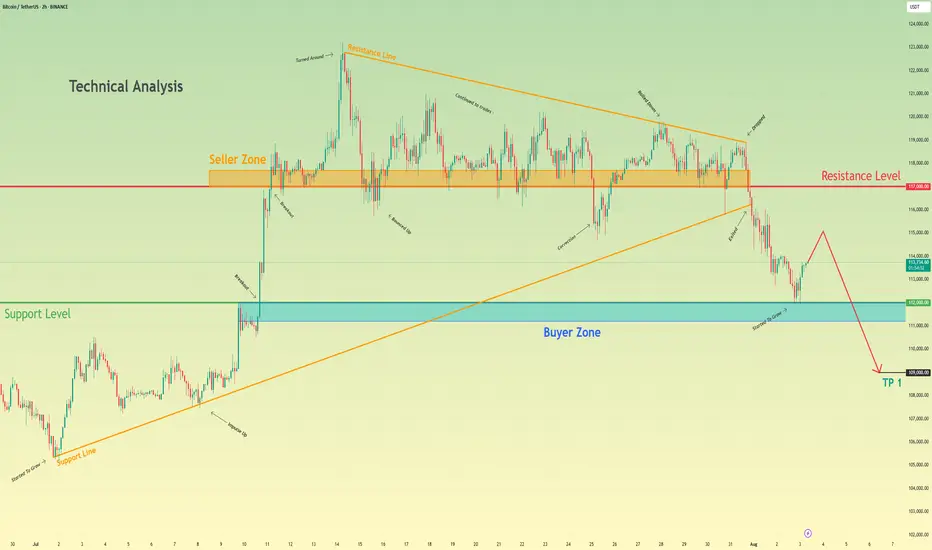
Bitcoin can continue to decline and break support levelHello traders, I want share with you my opinion about Bitcoin. Following an earlier upward trend, bitcoin entered a prolonged phase of consolidation, forming a large upward pennant where price action was tightly contested between the seller zone near 117000 and an ascending support line. This period of balance, however, has recently resolved to the downside with a significant change in market structure. A decisive breakdown has occurred, with the price breaking below the pennant's long-standing support line, signaling that sellers have ultimately gained control. Currently, after the initial drop, the asset is undergoing a minor upward correction, which appears to be a classic retest of the broken structure from below. The primary working hypothesis is a brief scenario that anticipates this corrective rally will fail upon encountering resistance from the broken trendline. A confirmed rejection from this area would validate the bearish breakdown and likely initiate the next major impulsive leg downwards. The first objective for this move is the buyer zone around the 112000 support level, but given the significance of the pattern breakdown, a continuation of the fall is expected. Therefore, the ultimate target price for this scenario is placed at the 109,000 level, representing a logical measured move target following the resolution of the large consolidation pattern. Please share this idea with your friends and click Boost 🚀
Disclaimer: As part of ThinkMarkets’ Influencer Program, I am sponsored to share and publish their charts in my analysis.
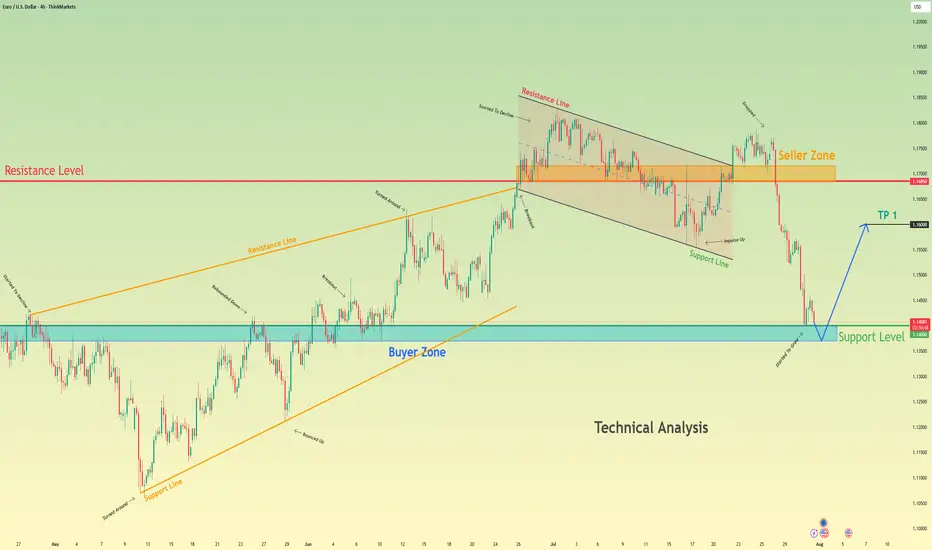
Euro bounce from buyer zone and start to move upHello traders, I want share with you my opinion about Euro. After a prolonged upward trend which formed a large rising wedge, the EURUSD faced a significant rejection from the seller zone near the 1.1685 resistance level. This failure to continue higher marked a key turning point, exhausting the bullish momentum and initiating a new bearish market phase. This new phase has since taken the form of a well-defined downward channel, within which the price has been undergoing a series of downward corrections and impulses. The most recent market action has been a sharp downward fall, accelerating the price's descent towards a critical area of historical significance. Currently, the pair is approaching the major support level at 1.1400, which also constitutes a strong buyer zone where demand has previously stepped in. The primary working hypothesis is a long, counter-trend scenario, which anticipates that the current bearish momentum will be absorbed by the strong demand within this buyer zone. A confirmed and strong rebound from this 1.1400 support area would signal a potential temporary bottom and the start of a significant upward correction. Therefore, the tp for this rebound is logically set at the 1.1600 level, a key psychological and technical point that represents a realistic first objective for a bounce of this nature. Please share this idea with your friends and click Boost 🚀
Disclaimer: As part of ThinkMarkets’ Influencer Program, I am sponsored to share and publish their charts in my analysis.
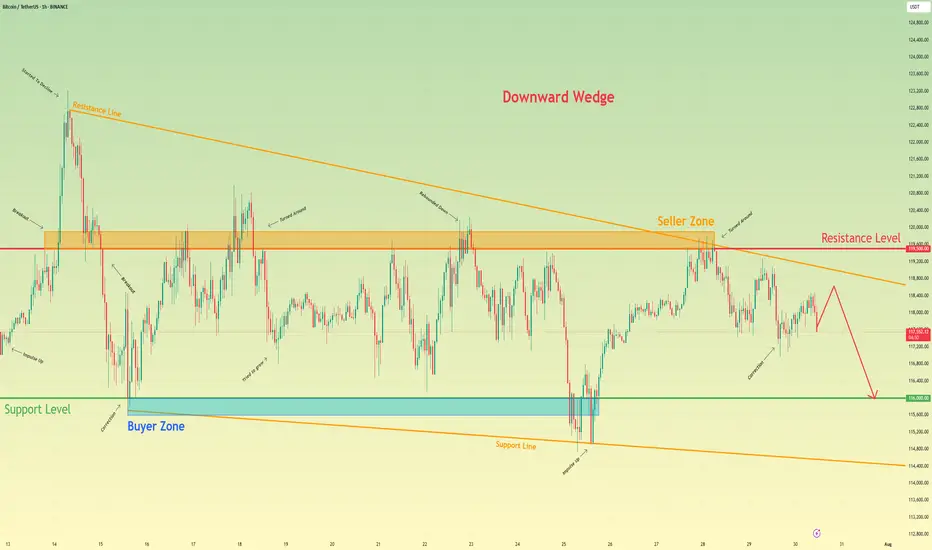
Bitcoin will continue to decline to support levelHello traders, I want share with you my opinion about Bitcoin. Following a period of a broad downward trend, bitcoin's price action has been channeled into a large downward wedge, a pattern that signifies converging volatility and a period of consolidation before an eventual decisive move. This market action is taking place between two critical, well-established zones: a major seller zone capping rallies around the 119500 resistance level and a significant buyer zone providing support near 116000. Recently, an upward rebound attempted to test the upper boundary of this wedge but was met with strong selling pressure from the seller zone, confirming its validity as a formidable barrier. The price is now correcting downwards after this rejection. The primary working hypothesis is a short scenario, anticipating that the bearish momentum from this recent failure will continue to drive the price lower. While a minor bounce or retest of local resistance is possible, the path of least resistance within the pattern's structure is now towards its lower boundary. Therefore, the TP is strategically set at the 116000 level. Please share this idea with your friends and click Boost 🚀
Disclaimer: As part of ThinkMarkets’ Influencer Program, I am sponsored to share and publish their charts in my analysis.
NIKE Confirms A Bullish Reversal With An Impulsive RecoveryWe talked about Nike on July 10 with our members, where we mentioned and highlighted a completed higher degree ABC correction in wave IV on the monthly and weekly charts.
Today we want to represent a closer view, as we see a five-wave impulsive recovery away from the lows on a daily chart. It actually confirms the bottom and bullish reversal, but since it can be trading in 5th wave that can stop around 80-85 area, we should be aware of a three-wave corrective setback soon. It can slow down the price back to the open GAP, so ideal buy zone is in the 70-60 area. Invalidation level is at 52.
Highlights:
Direction: Up, but watch out for a correction
Structure: Impulse, Wave 5 in final stages
Support: 70 / 60

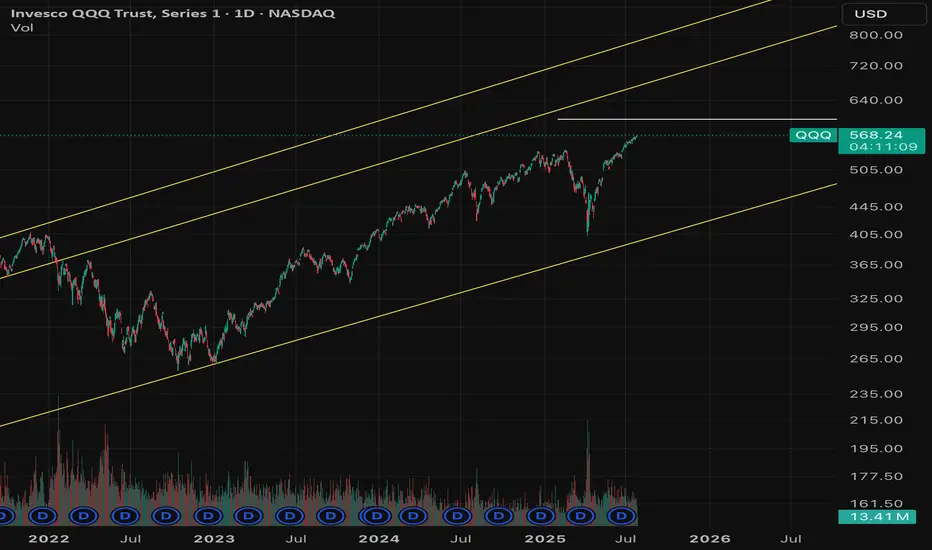
$QQQ August correction incoming?- August correction incoming? 🚨
- Greed is all time highs; People are complacent
- I believe a correction of 5-10% is healthy for the market to flush out excess and remove junk investments from the market.
- This involves people who are over-leveraged gets trapped.
- Personally, taking profits from risky bets, some profits from quality names and raising cash.
- Rotating money to defensive names.
- Not exiting the markets completely.
GBPCHF - Classic 'W' PatternGBPCHF has been setting up for the next impulse phase as we can see common 'W' price action pattern which has made the last swing low in this reversal structure to see buyers step in and push price upward.
Always wait for confirmation, Good Luck

C / UsdtBINANCE:CUSDT
### **📊 Chart Overview – CUSDT (1H):**
* **Current Price:** \$0.3225
* **Recent Trend:** Price is consolidating below a **descending trendline (red)** after a sharp decline from \$0.44–\$0.45.
* **Key Levels:**
* **Support:** \$0.31 – \$0.32 (highlighted zone).
* **Resistance:** \$0.34 – \$0.35 (trendline breakout needed).
* **Major Resistance:** \$0.4456.
---
### **🔍 Technical Breakdown:**
1. **Downtrend Continuation:**
* Price is still below the **red descending trendline**, which acts as dynamic resistance.
* As long as it stays below \$0.34, the bears remain in control.
2. **Bullish Scenario:**
* A **clear breakout above \$0.34** with strong volume could lead to a push toward **\$0.37 – \$0.40**.
3. **Bearish Scenario:**
* Failure to hold **\$0.31 – \$0.32 support** could open doors to a drop towards **\$0.30 or even \$0.28**.
---
### **📌 Summary:**
CUSDT is in a **critical consolidation zone**. Watch the **\$0.32 support** and **\$0.34 resistance** closely — a breakout or breakdown could decide the next move.
---
⚠️ **Disclaimer:**
*This analysis is for educational purposes only, not financial advice. Always do your own research and trade carefully.*
