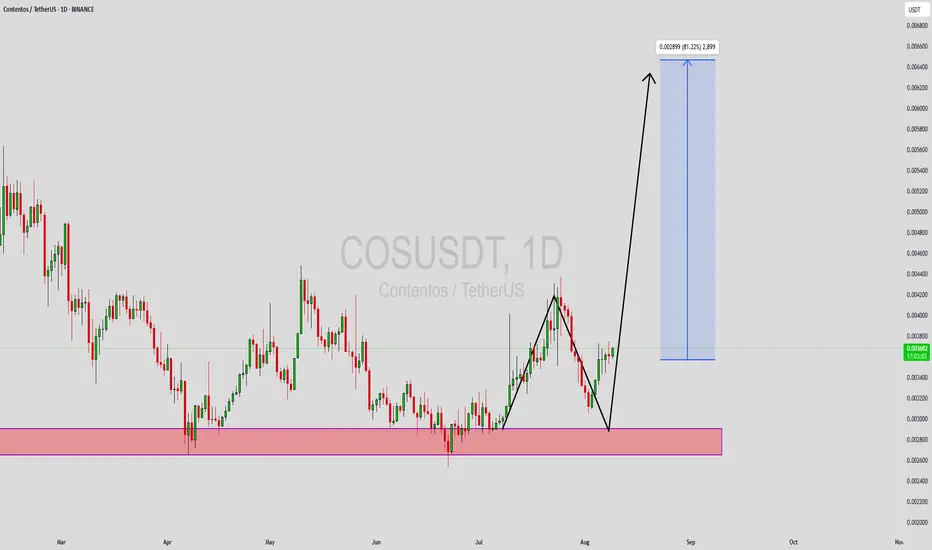
COSUSDT Forming Bullish MomentumCOSUSDT is displaying a strong bullish momentum pattern, indicating that buyers are firmly in control and pushing the market higher. This pattern reflects sustained upward pressure with minimal retracements, suggesting that market participants are confident about the asset’s future trajectory. With the current trading volume remaining solid, this momentum could pave the way for significant gains in the short to medium term.
The good volume levels behind COSUSDT’s price action are a key driver of its bullish outlook. Consistent buying pressure confirms that institutional and retail investors alike are accumulating positions, anticipating a breakout that could potentially yield gains of 70% to 80% or more. Such momentum patterns often occur when market sentiment is aligned with positive fundamentals or upcoming catalysts, which can further accelerate price appreciation.
Investor interest in COSUSDT continues to grow as the broader crypto market begins to favor high-potential altcoins. The momentum pattern, coupled with strong market participation, positions COS for a potential explosive move once resistance levels are broken. Traders should keep an eye on the next significant breakout zone, as it could trigger a rapid upward surge.
In summary, COSUSDT’s bullish momentum pattern is a strong technical indicator of continued upside potential. With market sentiment, volume, and pattern structure all in alignment, this crypto pair presents a compelling opportunity for those seeking substantial returns in the current market cycle.
✅ Show your support by hitting the like button and
✅ Leaving a comment below! (What is You opinion about this Coin)
Your feedback and engagement keep me inspired to share more insightful market analysis with you!
Cosbtclong
COSUSD 1WCOS ~ 1W 📈
#COS Make purchases in stages from here, with a minimum target of 25%++. Retesting of this Support is being done now.. Bulls will return soon after testing of this support is complete.

cosbusd buy callCosbusd is in uptrend and testing rising support
buy : 0.00722
sl : 0.00710
tp : 0.00739

cosbusd buy callCosbusd is in uptrend and testing rising support
buy : 0.00708
sl : 0.00696
tp : 0.00726

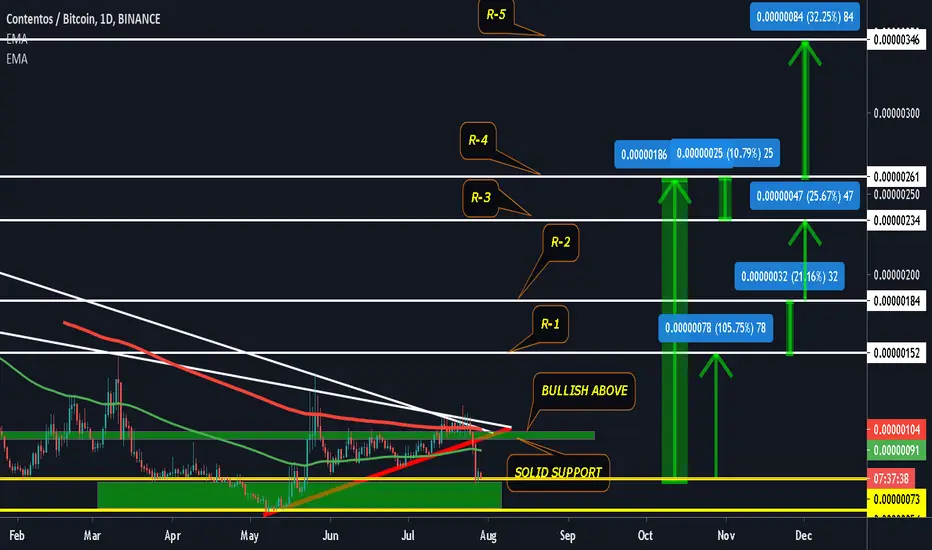
#COS/BTC 240%+ Potential Trade Setup!Welcome to this quick Update, everyone.
If you are reading my updates for the first time do follow me to get more complex charts in a very simplified way.
I also post altcoin setups on Spot, Margin, and Futures.
COS Broke out of the 140-day long triangle and is currently retesting the support level.
It's highly likely it can pump 50% to 120% in the mid term and even try to break it's previoous ATH with a possible pump of 240% +.
ENTRY : 33 sats to 38 sats
Targets:-
47
56
74
84
97
106
SL: 29
What's your thought on this?
Do hit the like button if you like this update and share your views in the comment section.
Follow me for more.
Thank you

COSBTC Might Break Above the Resistance
Welcome back Traders, Investors, and Community!
Hi Traders, COSBTC is right below a long term Resistance, it might go lower to 0.00000032 before it continues going up. However if it breaks above the Resistance on the lower TF we can look for potential entry to go long.
⬆️Buy at Resistance Breakout or Buy at 0.00000032
⭕️SL @ 0.00000016
✅TP1 @ 0.00000050
✅TP2 @ 0.00000066
✅TP3 @ 0.0000010
We will have more FREE forecasts in TradingView soon
❤️ Your Support is really appreciated!❤️
Have a Profitable Day

COS/BTC falling wedge + ATL supportCOS/BTC is currently at (55-53 sat)
Falling wedge + all time low supports
Will hold ????
it's a risky
Because with current btc volatile movements + dominance increase can easy make it print a new low
should first form a base of support
If the bulls can save this area from drop for next few days we can see a nice move up
Also 50sat is a physiological support
Stop loss should be break 50sat
Good luck

COS BTC looks Primed to grow.BINANCE:COSBTC looks absolutely nice at the moment.
All necessary details on chart.
overview.
RSI is good Macd is good.
Broke down out of triangle and inverse hhead and shoulder.
Sitting on EMA200 on 4h time-frame. Now consolidating under resistance which is bullish.
Lets see how it goes.
happy trading.

#COS/BTC CHART TECHNICAL ANALYSIS & PRICE ACTION MOVES#COS/BTC CHART TECHNICAL ANALYSIS & PRICE ACTION MOVES

#COS/BTC CHART TECHNICAL ANALYSIS & PRICE ACTION MOVES#COS/BTC CHART TECHNICAL ANALYSIS & PRICE ACTION MOVES
COS Bullish Setup | above 200 EMABreakout close , Above 200 EMA This is huge in coming days.
Buy below : 110 and hold
Stop : 85
Target : Mentioned In Chart

COS/USDT (Awaiting Pattern Break)COS/USDT
-currently painting a symmetrical triangle pattern
-the safe way to enter a trade here is to wait for the breakout
-buy above if we break/close 970s
-upside target is the mid resistance at the 1300s
-stoploss is placed under 850s

COS/BTC (Double bottom?: up to 40% profit)COS/BTC
COS may have found support at previous swing low last Feb 2020 trading history.
This could be a potential bottom formation if COS can break the high at 81 sats.
If that happens, expect a growth up to 111 sats and place our stop-loss below 73 sats area.


COS LONG$COS
Local bottom here imo. Farthest I'd take it is the range low at 146; I expect heavy rejection at that level which is why I'm TP'ing on the way.

ContentosHello guys
At all webinars I talked about coins that were on my blue list, this is a list of new coins on the Binance exchange, which still had no pump.
The previous coins that I spoke about have already grown, and some are still in the process of growing
I was waiting for this coin when the accumulation zone is formed and it is shown in the yellow box, trading volume is growing , the field of how we get out of this zone can see the movement of 10-30%
Trading volume around 100btc now
Best regards EXCAVO
