Inflation has Peaked-Multi-decade resistance trendline unbroken
-Bearish divergence on the Wolfpack
-"Overbought" on the RSI
-Curling price action
CPI

AUDUSD Gains Momentum Ahead of Fed DecisionDollar has been weakening, in particular since August 22nd when Powell spoke at Jackson Hole, acknowledged rising inflation risks, and more importantly, weakening labor data. Back then he signaled that the Fed could adjust rates with a 25 or possibly even a 50 basis point cut this Wednesday.
Looking at FX pairs, what stands out to me is that we are clearly in risk-on mode, with commodity currencies doing very well since late August. Aussie is up almost 4% from the August 22nd lows, while other majors are lagging behind that performance. So it may not be a bad idea to focus on Aussie for potential longs versus the US dollar, especially considering inflation in Australia increased on a yearly basis from 1.9% in June to 2.8% in July, as reported on August 27th. This shows inflation is still a problem in Australia, so the RBA may not be looking to cut rates, which makes AUDUSD attractive on the upside.
From an Elliott Wave perspective, I also like the impulsive characteristics on Aussie from the August 22nd close. In my view, we are still in an incomplete five-wave cycle, with the recent push beyond the July highs being wave three. After the next pullback in wave four, there could be a strong rebound, with the 0.6625 level standing out as attractive support on dips. I’ll certainly keep a close eye on this zone if a retracement occurs.
It’s also worth noting that Aussie is now trying to break the trendline from the 2021 highs, which could be an interesting breakout point and support the recovery, at least until the five-wave cycle completes on the 8-hour chart.
Grega

AUD/USD Ready for a Short Squeeze? COT Divergence Signals1. Retail Sentiment
73% of retail traders are short versus 27% long. Such an unbalanced positioning usually suggests short squeeze potential, as the market often moves against retail flows, especially when technical levels confirm the bias.
2. COT Report
USD Index: Non-Commercials remain skewed to the short side (+18.6k short vs. +13.6k long), with a slight reduction. This indicates the dollar is losing part of its net strength.
AUD Futures: Non-Commercials are heavily short (112k vs. 29k long), adding –16,930 new shorts. However, Commercials (hedgers) increased their longs (+11,908). Historically, commercials are more accurate at market turning points. This divergence may point to a bottom forming in AUD.
3. Seasonality (September)
September has historically been neutral to slightly negative for AUD/USD: flat performance over 20 years, and weaker over the last 5 years. However, mid-to-late September seasonality stabilizes, setting the stage for an October recovery. Bearish pressure may start fading, leaving room for upside.
4. Technical Outlook
Demand Zone: 0.6450–0.6500 has repeatedly rejected price, confirming strong support.
Supply Zone: 0.6650–0.6700, recently tested, represents the first upside target.
Structure: Price is printing higher lows and showing signs of a potential bullish structure shift. RSI is neutral, with no overbought signals.
Possible Scenario: A short pullback into 0.6520–0.6540 before accelerating toward 0.6680–0.6700.
5. Trading Summary
Bias: Moderately bullish in the short-to-medium term.
Key Drivers:
Extreme retail short positioning → potential squeeze.
COT divergence (specs heavily short, commercials long) → possible bottom.
Weak but improving seasonality.
Technical structure favoring upside continuation.
👉 Bottom line: AUD/USD favors long setups, but heavy Non-Commercial short exposure implies volatility could remain elevated.

XAUUSD – CPI Today: Liquidity Sweep Scenario & Trading Plan📊 Market View
Gold (XAUUSD) is sliding under short-term resistance (descending trendline), showing sellers are still in control short-term. On the M30 chart, buy-side liquidity levels are clearly stacked: 3,624 → 3,612 → 3,599 → 3,586.
👉 During the European session, expect a breakdown liquidity sweep toward these support zones before any bullish reaction.
📈 CPI View – US Session
Soft CPI (below expectations) → Weaker USD, lower yields → Gold may bounce strongly from 3,612 / 3,599 / 3,586 and retest trendline/resistance.
Hot CPI (above expectations) → Stronger USD, higher yields → Gold may break 3,612, sweep deeper to 3,599 or 3,586, then recover.
⚠️ High risk of news traps: the first reaction can reverse quickly. Wait for retests + confirmation candles before entering.
🔑 Key Levels
Dynamic Resistance (trendline): 3,643 – 3,646
React Zone FIB: 3,650 – 3,654
OBS Sell Zone: 3,665
Support/Liquidity Zones:
3,624.36 (key zone support BUY)
3,612.60 (CP/React FIB)
3,599.31 (BUY ZONE)
3,586.49 (END LIQUIDITY – BUY ZONE)
📌 Trading Plan
🔴 SELL ZONE: 3,646 – 3,648
SL: 3,652
TP: 3,640 → 3,635 → 3,630 → 3,620 → 3,610 → ???
🔵 BUY SCALP: 3,612 – 3,610
SL: 3,605
TP: 3,616 → 3,620 → 3,625 → 3,630 → ???
🔵 BUY ZONE (Primary): 3,600 – 3,598
SL: 3,592
TP: 3,605 → 3,610 → 3,615 → 3,620 → 3,630 → 3,640 → ???
Backup BUY: (if liquidity sweep deepens) 3,58x
Hard SL: 3,578
❗ If 3,578 breaks, don’t rush to re-buy—CPI volatility can extend moves further.
⚠️ Notes & Risk
Reduce position size around the CPI release.
Always wait for confirmation (pin bar / engulfing / retest) before entering.
Use staggered TPs to lock in profits early.
An M30 close above 3,654 invalidates near-term shorts and opens 3,665.
✅ Summary
Gold could sweep liquidity into the buy zones before bouncing. Trade the reaction: SELL at 3,646–48 on rejection, BUY at 3,612/3,600 on clean bounce, and reserve backup BUY at 3,58x with tight risk.
👉 Follow MMFLOW TRADING for real-time updates and BIGWIN setups during CPI volatility.

ETH 4H Analysis - Key Triggers Ahead | Day 19😃 Hey , how's it going ? Come over here — Satoshi got something for you!
⏰ We’re analyzing ETH on the 4-Hour timeframe.
🔭 ETH 4H Chart: Observing Ethereum on the 4-hour timeframe, after breaking the midline of the box, ETH closed above the box. Then, following the news, it formed a shadow that hit the lower box level, triggering a series of buy orders. Now, we’re watching to see if ETH will continue upward. The overall trend behind ETH is still bullish, and a breakout above the multi-timeframe range could push it toward the box’s top again.
⛏ Key RSI Levels: ETH’s RSI is around 70 and 50. A breach of these levels could signal the start of a move, especially following today’s inflation news impact.
💰 Candle Size & Volume: Green candle sizes and volume have increased. Yesterday, $164M of ETH was bought via ETFs, which is notable.
🪙 ETHBTC 4H Chart: Observing the ETH/BTC pair on the 4-hour timeframe, this pair tends to act slightly more precisely compared to ETH/USDT. Currently, it’s trading within a box with declining volume. News caused a reaction at the top of the box. If the box’s top breaks, a significant amount of BTC could convert into ETH, potentially pumping the ETH/USDT pair as well.
🔔 Entry & Target Zones: A potential early entry is around $4443, with the box top at $4500 — a strong resistance. If ETH breaks this level, it could aim for a new ATH. Make sure to confirm across multiple timeframes before taking a position.
❤️ Disclaimer : This analysis is purely based on my personal opinion and I only trade if the stated triggers are activated .

BTC 1H Analysis - Key Triggers Ahead | Day 39😃 Hey , how's it going ? Come over here — Satoshi got something for you!
⏰ We’re analyzing BTC on the 1-Hour timeframe.
👀 On the 1H timeframe for Bitcoin, we can see that BTC has been ranging since yesterday’s news. A breakout and confirmation above the range high or below the range low will give us a trading setup. The key levels are $114,407 on the upside and $113,528 on the downside.
Today’s hot topic is the US CPI inflation data, which is a high-impact event at the very top tier of importance.
⚙️ On the RSI, Bitcoin is moving between the 50–70 zone. A breakout beyond these values, in alignment with a price breakout, could generate strong trade entries.
🕯 Candle structure shows that green candles are getting larger with more volume, while red candles are more frequent but smaller each time—so much that the market is starting to ignore them. The range high is very critical; it could break with a whale candle or even an indecision candle right before the move. Order type matters here—whether you use a trigger order or market entry on candle open will impact the trade.
📊 On the 1H Tether dominance, we’re also seeing a range—opposite in behavior to Bitcoin—with a range high at 4.37% and low at 4.32%. With BTC’s underlying trend on the 1H still bearish, there’s a decent probability of a downside break in USDT dominance while BTC breaks the upside of its range.
📊 On the 1H BTC.D , after a strong leg down, BTC.D has dropped below the 0.618 retracement level of its previous range and failed to hold support. We might see a small bounce/retest of that area, but unless today’s CPI causes major volatility, the broader expectation remains further downside in dominance.
🔔 The CPI report could bring serious volatility today. Yesterday’s news triggered nearly $750M worth of Bitcoin buys, sparking a strong rally with only minimal compression-style pullbacks. If today’s inflation data triggers a breakout above $114,407, and we see dominance dropping at the same time, large-cap projects are likely to pump even harder than Bitcoin itself.
❤️ Disclaimer : This analysis is purely based on my personal opinion and I only trade if the stated triggers are activated .

US CPI Number? Lets see What Crude Is Telling us... Today is the US CPI one of the most important events before the Fed’s next move
I’ve often used the relationship between US CPI and Crude oil, and it has been a reliable guide many times before.
Key points
👉Crude was down -8.5% in August → we may see a suprise with lower CPI
👉 Official expectations are for higher CPI: from 2.7% to 2.9% y/y → risk of a miss
👉Even if CPI hits 2.9%, dollar may not rally far → because its expected number
👉Dollar bottomed in Sep 2024 after Fed made 1st cut in while→ weak USD risk remains till FED cuts, then reversal

BTC: 114.2k–116k Decision Zone into CPI__________________________________________________________________________________
Market Overview
__________________________________________________________________________________
BTC is consolidating just below 114k after reclaiming 112k–112.5k, sitting in a 113.5k–114.5k decision zone. Intraday drives higher, while HTF remains cautious into CPI.
Momentum: Tactical bullish 📈 — higher highs/lows on 4H→1H, but capped below 114.2k–116k.
Key levels:
• Resistances (4H/1H): 114.2k–114.6k | (6H/12H): 115.5k–116.0k | (12H): 117.0k
• Supports (2H): 113.0k–113.2k | (W/4H): 111.9k–112.3k | (4H): 110.8k
Volumes: Normal on 1D/12H, Moderate on 4H/2H, Very high on 1H/30m/15m during impulses.
Multi-timeframe signals: 1D/12H MTFTI Up but broader caution; 4H/2H/1H in NEUTRE ACHAT with rising volumes; short‑term divergence as 12H is still hesitant.
Risk On / Risk Off Indicator: NEUTRE VENTE — a mild risk‑off backdrop that contradicts intraday momentum; watch for a flip to NEUTRE ACHAT to validate continuation.
__________________________________________________________________________________
Trading Playbook
__________________________________________________________________________________
Approach: favor continuation buys on breakout with quick invalidations while HTF remains mixed.
Global bias: Tactical NEUTRE ACHAT above 113.6k; swing invalidation if 111.9k then 110.8k break.
Opportunities:
• Breakout buy: 2H/4H close > 114.6k → aim 115.6k then 117k; stop 113.6k.
• Pullback buy: 112.2k–112.3k with absorption/volume → 114.6k / 115.8k / 117k; stop 111.5k.
• Tactical sell: failure below 114.3k + close < 113.0k → 111.9k then 110.8k; stop 113.6k.
Risk zones / invalidations: Repeated rejection below 114.3k followed by a 113.6k loss opens 112k; losing 111.9k then 110.8k invalidates the tactical bullish bias.
Macro catalysts (Twitter, Perplexity, news):
• US CPI Thursday: benign print supports a 114.6k break; hot CPI favors a fade under 114.3k.
• US labor softening: bolsters rate‑cut odds (tailwind if CPI undershoots).
• Pro‑crypto policy tone (SEC/HK): marginally improves regime if levels confirm.
Action plan:
• Entry: 114.65k (2H/4H close) / Stop: 113.60k / TP1: 115.60k, TP2: 117.00k, TP3: 118.50k
• Approx R/R: ~1.5R to TP1, ~3R to TP2; scale size if volumes stay Very high and Risk On / Risk Off Indicator flips ≥ NEUTRE ACHAT.
__________________________________________________________________________________
Multi-Timeframe Insights
__________________________________________________________________________________
Intraday risk‑on, HTF cautious: continuation is possible but needs regime confirmation.
1D/12H: MTFTI Up, yet backdrop “NEUTRE VENTE”; bounded between 111.9k–110.8k base and 114.2k–116k cap; daily HH above 113.5k needs confirmation.
6H: Ascending sequence from 110.8k; resistances 114.2k–114.6k then 115.5k–116k; pullback 112.2k–112.3k is attractive if volume confirms.
4H/2H/1H/30m/15m: NEUTRE ACHAT with rising volumes; breakout > 114.6k is primary setup; key divergence: Risk On / Risk Off Indicator still NEUTRE VENTE outside 15m → wait for confirmation.
__________________________________________________________________________________
Macro & On-Chain Drivers
__________________________________________________________________________________
Macro is the referee: CPI and weak labor frame risk, while on‑chain/crypto flows are constructive but demand confirmation.
Macro events: CPI in focus (moderate consensus); very weak US labor supports rate‑cut narrative; selective global risk‑on (Japan ATH, China recovery); pro‑crypto policy signals (SEC/HK) add a marginal tailwind.
Bitcoin analysis: Daily trend reclaimed >113.5k; immediate resistance 114.2k; acceptance >117k would open 124.3k extension; strong alt rotation can cap BTC’s relative upside; short clusters imply squeeze risk if breakout validates.
On-chain data: Accumulation 108k–116k (URPD); STH ~60% in profit = fragile neutral state; neutral funding (compression risk); slower spot ETF inflows — need a firm close >114.2k–116k to convert.
Expected impact: “Cool” CPI + pro‑crypto tone backs a breakout >114.6k; “hot” CPI favors a move back to 112k/110.8k.
__________________________________________________________________________________
Key Takeaways
__________________________________________________________________________________
Market at an inflection into CPI: intraday bullish, HTF cautious.
- Trend: tactically bullish, but needs confirmation above 114.6k (then 117k).
- Top setup: validated 2H/4H breakout > 114.6k with volume → 115.6k/117k; alternative pullback buy at 112.2k.
- Key macro: CPI and weak labor steer near‑term risk‑on/off.
Stay disciplined: wait for the signal or de‑risk pre‑event — invalidations are close, use them. 🚦

CPI GOLD MAPPING ! CPI GOLD BUY AND SELL AREAS
SELL 3644 , 3667 (OB)
BUY 3571 , 3555 (FVG + OB)
BUY 3517 , 3497 (TS + RBS)
Good Luck With Your Trading 🤞

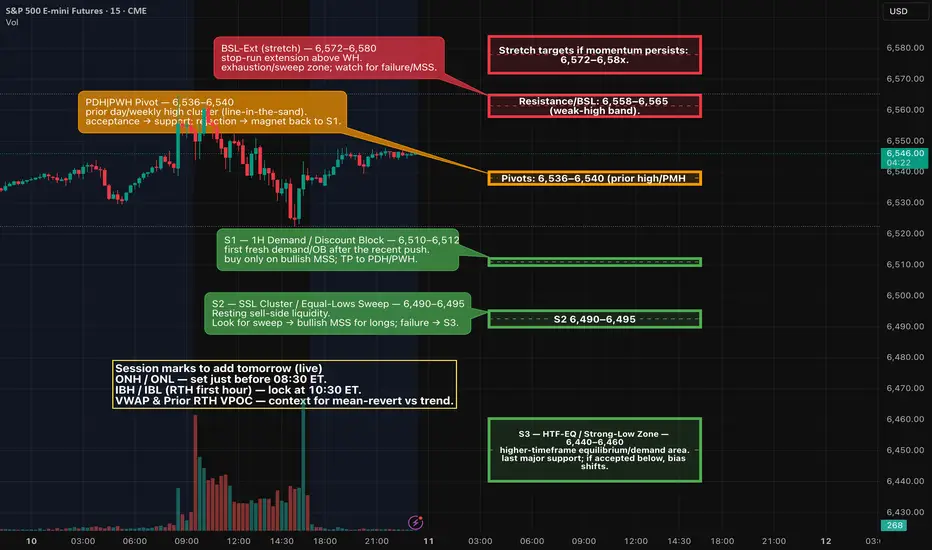
ES (SPX) Analyses for Thu, Sep 11 (CPI day)What matters tomorrow (fundamentals)
CPI (Aug) at 8:30 ET — the BLS schedule shows the August CPI release Thu Sep 11, 08:30 ET. This is the day’s primary driver.
Weekly Initial Jobless Claims at 8:30 ET — standard Thursday release; calendars show the event scheduled for Sep 11 at 08:30 ET.
Treasury 30-yr bond auction — $22B long-bond sale Thursday (typically 13:00 ET). This can move yields into the NY afternoon and spill into equities.
Context into the print: PPI (Aug) was released today (Sep 10); YoY +2.6% per data trackers/BLS release, keeping focus on CPI for confirmation. Markets are leaning toward a Fed cut at next week’s meeting.
I’m using your 1D / 4H / 1H.
Trend: Uptrend intact on 1D; price sits just beneath a “weak-high / premium” supply band. (1D shows fib extensions near ~6705 (1.272) and ~6799 (1.618) as far targets, not base-case for tomorrow.)
4H: Recent push into a red supply band then pullback; mid-range equilibrium roughly ~6,44x–6,45x.
1H: Resistance zone ~6,558–6,565 (your “Weak High” band). Prior highs around ~6,536–6,540 act as local pivot/PMH; below that, demand/discount blocks stack ~6,50x → 6,46x–6,44x.
Scenario A — Disinflationary/soft CPI (yields down)
Likely path: Early sell-side sweep into 6,51x → 6,49x discount → bullish MSS.
Entry: Buy the 1–5m PD-array in discount after displacement.
Targets: 6,536–6,540 → 6,558–6,565 (weak-high). Leave runner toward 6,57x–6,58x only if order-flow stays bid.
Invalidation: 1–5m structure loses 6,49x and cannot reclaim.
Scenario B — Hot CPI (yields up)
Likely path: Buy-side sweep through 6,558–6,565 → failure → bearish MSS back below the band.
Entry: Short premium PD-array after displacement down.
Targets: 6,536–6,540 → 6,51x, stretch 6,49x then 6,46x–6,44x if momentum accelerates.
Invalidation: Acceptance back above 6,565 with bullish structure.
Projections:
ES futures are anticipated to respond within a 5-15 minute window following the 8:30 AM release, with intraday movements likely intensified by algorithmic trading and stop-hunting activities. Historical analysis of the past 6 CPI events indicates an average end-of-day ES move of approximately +0.76% in response to ±0.1% deviations from forecasts. The prevailing volatility suggests that implied moves, derived from options data, are forecasting a swing of around 0.5-1% (equivalent to ±30-60 points from current levels), though actual market responses have been known to exceed these expectations in the event of surprises.
In the pre-release phase, spanning overnight to pre-market hours (approximately 4:00-9:30 AM ET), market participants are likely to observe a consolidation or mild upward bias within a range of 6480-6575, building upon today’s record highs. The light trading volume may lead to false breakouts around critical levels. Traders are currently positioning for a "failed breakdown" pattern, wherein an initial dip below recent lows could trigger stop-loss orders, followed by a swift reversal higher if market sentiment remains intact.
As the clock strikes 8:30 AM ET, high volatility is expected, with the potential for a 20-40 point gap open or sharp spike. A common occurrence is an initial downside flush aimed at testing liquidity (for instance, dipping below 6500) before a definitive market direction is established. Whipsaw action is likely as news headlines emerge, with particular focus on the core CPI data, which will be pivotal for determining sustained market trends.
Good Luck Everyone!
$SPY / $SPX Scenarios — Thursday, Sept 11, 2025🔮 AMEX:SPY / SP:SPX Scenarios — Thursday, Sept 11, 2025 🔮
🌍 Market-Moving Headlines
🚩 CPI Day: August Consumer Price Index at 8:30 AM — the main macro print of the week.
🚩 ECB Decision: 8:15 AM ET — Europe’s call on rates adds global cross-asset volatility.
📉 Labor + growth mix: Jobless claims alongside CPI sharpen the Fed outlook.
📊 Key Data & Events (ET)
⏰ 🚩 8:15 AM — ECB Rate Decision
⏰ 🚩 8:30 AM — Consumer Price Index (CPI, Aug)
⏰ 🚩 8:30 AM — Initial Jobless Claims (weekly)
⚠️ Disclaimer: Educational/informational only — not financial advice.
📌 #trading #stockmarket #SPY #SPX #CPI #ECB #inflation #Fed #jobs #bonds #economy

XAUUSD 30M – Intraday Plan Around the Range with Fundamentals🔼 Bullish Plan (primary focus)
Trigger: A clean 30m body close above $3,649.14 (not just a wick).
Targets:
First into $3,653.32.
If momentum extends, room opens into $3,657–$3,660 zone.
🌍 Fundamentals Supporting the Move
Fed rate cut odds at 100% → policy easing reduces real yields → bullish.
CPI sticky but real yields still trending lower → long-term upside.
DXY + yields soft, safe-haven + central bank demand strong → gold’s floor is firm.
1️⃣ Fed Policy – The Main Driver
Fed Rate Cut Odds at 100% → Markets are fully pricing in a rate cut at the upcoming FOMC meeting.
Lower interest rates directly reduce the opportunity cost of holding non-yielding assets like gold. This shifts flows from bonds/dollar into safe-haven assets.
Traders are positioning ahead of confirmation, keeping dips supported.
2️⃣ Inflation Outlook – CPI as a Near-Term Catalyst
U.S. CPI expectations remain elevated. Sticky inflation has capped some of gold’s upside in the short term.
However, inflation + falling interest rates = real yields decline, which is structurally bullish for gold.
The market is currently balancing “sticky CPI” against the certainty of Fed easing.
3️⃣ Dollar & Yields – Supporting Gold’s Floor
U.S. Treasury yields have eased as traders anticipate policy cuts.
The U.S. Dollar Index (DXY) has struggled to extend rallies, despite inflation worries, because Fed policy is already tilted dovish.
This mix keeps gold resilient, even during intraday pullbacks.
Management:
Take partials at the first target.
Move SL to breakeven once $3,649 is defended.
Trail remainder toward extended upside if momentum candles build.
✅ What Confirms the Move
Strong 30m body close through $3,649.14.
Retest holds as support.
Expansion candles with follow-through buying.
❌ What Invalidates
Breakout closes back under $3,649 on the next bar (likely trap).
Sharp wick rejections with no continuation.
📌 Bottom Line:
Only interested in longs above $3,649.14 → upside bias toward $3,653+ and $3,657–$3,660.
No shorts considered as fundamentals and rate cut odds heavily favor bullish setups.

XAUUSD – PPI Ahead: Key Liquidity Levels & Trading Plan🚀 MMFLOW TRADING
Market View:
After yesterday’s sharp drop where sellers dominated the liquidity zone, gold (XAUUSD) is now recovering from 362x → 364x during the Asian session. In the short term, price may range between 362x–365x in Asia/Europe before going sideways to await the PPI release in the US session.
Today’s PPI is expected at 0.3% vs 0.9% previous, signalling cooling inflation. However, actual data could surprise higher – often creating a “news trap”. From a technical view, gold may need to revisit 360x liquidity before resuming its uptrend ahead of CPI & the upcoming FED meeting.
👉 In short: Structure remains bullish, but short-term liquidity sweeps are likely before any continuation move.
Key Levels:
Resistance: 3647 – 3654 – 3665 – 3674 – 3704
Support: 3635 – 3613 – 3600 – 3586
Trading Plan:
🔵 BUY Zone: 3600 – 3598
SL: 3592 (or tighter at 3580)
TP: 3605 → 3610 → 3615 → 3620 → 3630 → 3640 → 3650+
🔴 SELL Zone: 3703 – 3705
SL: 3710
TP: 3698 → 3694 → 3690 → 3680 → 3670 → 3660+
Summary:
✅ Gold remains in an uptrend, but may retest 360x liquidity before heading higher.
✅ PPI today & CPI tomorrow could act as a “news trap” – caution is required.
👉 Watch the key levels and follow MMFLOW TRADING for real-time updates & BIGWIN setups!

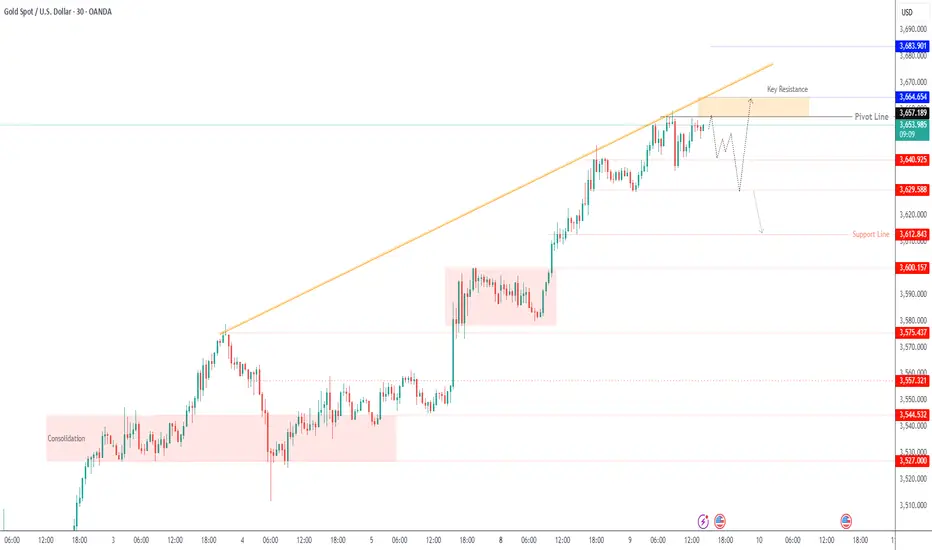
Gold : Neutral Between 3,640–3,657, Breakout to DecideGold – Overview
Gold hit a fresh record high at $3,659 on Tuesday, supported by weak U.S. jobs data and growing bets on Fed rate cuts. Traders now await key U.S. inflation releases – PPI on Wednesday and CPI on Thursday – which could drive the next major move.
📊 If inflation comes in hotter than expected, gold risks a sharp correction.
📊 If inflation is weaker, expectations for a 50 bps Fed rate cut could lift gold further.
Technical Outlook:
🔻 While below 3,657, price may correct toward 3,640. A 15M close below 3,640 would extend the decline to 3,629.
🔺 Stability above 3,657 on a 15M close would support further upside toward 3,665 → 3,683.
Key Levels:
Pivot: 3,657
Support: 3,640 – 3,629 – 3,612
Resistance: 3,665 – 3,683
previous idea:
BTC capped at 113.2k–115.2k: fade rallies, watch CPI__________________________________________________________________________________
Market Overview
__________________________________________________________________________________
BTC is chopping in the low-110k, capped by a stacked 113.2k–115.2k supply zone, with macro headline risk elevated into CPI.
Momentum: 📉 Range with bearish tilt — upside attempts fail below 113.2k–114k while HTF pressure remains risk-off.
Key levels:
• Resistances (HTF/LTF) : 113.2k–113.4k (LTF/240 PH) · 114.5k–115.3k (HTF/720 PH) · 116.6k (recent high, HTF).
• Supports (HTF) : 111.9k–112.0k (W pivot) · 110.8k (240 PL) · 107.8k (D PL).
Volumes: Normal on HTF; “moderate” upticks on 1H–30m during failed breakouts.
Multi-timeframe signals: 1D/12H/6H trend down; 4H–1H mixed with a hard cap at 113.2k–114k; 15m micro-bullish while 111.96k holds. Strong confluence at 113.2k → 115.2k resistance and 111.96k/110.77k/107.8k supports.
Risk On / Risk Off Indicator: NEUTRAL SELL ; Global Risk Regime stays STRONG SELL — confirms the bearish bias and fades micro-rallies.
__________________________________________________________________________________
Trading Playbook
__________________________________________________________________________________
As long as 113.2k–115.2k caps price, favor “sell the rip” and only buy on confirmed signals.
Global bias: SELL while below 115.24k; major short invalidation on daily > 116.6k.
Opportunities:
• Tactical short on 113.2k–114.0k rejection toward 112.0k/111.0k; inval. above 115.3k.
• Breakout long only on H1/H4 acceptance > 113.3k (retest holds) toward 114.6k/115.24k; inval. below 111.9k.
• Defensive long on clean reaction at 110.8k or 107.8k if risk blocks improve (≥ NEUTRAL BUY on LTF).
Risk zones / invalidations: Break < 110,77k voids defensive longs (opens 107.8k); H4/D12 close > 115.24k voids range shorts (opens squeeze to 116.6k).
Macro catalysts (Twitter, Perplexity, news): CPI next (direct vol around 111k–112k pivot) · Geopolitics (NATO Article 4; Middle East) supports risk-off · US tariff path (SCOTUS) preserves trade-policy uncertainty.
Action plan:
• Fade-rally short : Entry 113.2k–114.0k / Stop 115.3k / TP1 112.0k · TP2 111.0k · TP3 110.8k / R:R ~1.8–2.5.
• Breakout long : Entry > 113.3k (confirmed retest) / Stop 111.9k / TP1 114.6k · TP2 115.24k · TP3 116.6k / R:R ~1.6–2.2.
__________________________________________________________________________________
Multi-Timeframe Insights
__________________________________________________________________________________
HTFs remain bearish while LTFs attempt extensions under a dense overhead supply.
1D/12H/6H: Downtrend, rallies capped below 113.2k–115.2k; dominant supply, supports layered at 111.96k → 110.77k → 107.8k.
4H/2H/1H: Mixed reads; need a clean close > 113.24k to open 114.6k–115.24k, otherwise frequent fades back to 111.96k.
30m/15m: 30m cautious (STRONG SELL) vs 15m micro-bullish (NEUTRAL BUY); classic pre-catalyst divergence — wait for H1/H4 confirmations.
Confluence/Divergence: Heavy multi-TF supply 113.2k → 115.2k; risk-on equities vs risk-off credit/crypto warns against chasing crypto bounces.
__________________________________________________________________________________
Macro & On-Chain Drivers
__________________________________________________________________________________
Macro is mixed (gold ATH, firm oil, US equities buoyed by cut hopes) while geopolitics heats up and CPI looms.
Macro events: CPI imminently (sets risk tone) · NATO Article 4/Middle East tensions (risk premia higher) · US tariff track (SCOTUS) sustains uncertainty.
Bitcoin analysis: 100–1k BTC cohorts accumulating, 1k–10k distributing — potential cap on impulsive upside; ETF flows cooling, consistent with consolidation below 114k–116k.
On-chain data: Activity skewed by inscriptions/runes; sentiment in “fear” (44/100) implies positioning not crowded long.
Expected impact: Range-to-down bias while < 113.3k–115.2k; a benign CPI could trigger a push > 113.3k toward 114.6k/115.24k.
__________________________________________________________________________________
Key Takeaways
__________________________________________________________________________________
The market stalls under multi-TF supply as key catalysts approach.
- Overall trend: 📉 bearish on HTF; LTFs try but stall below 113.2k–114k.
- Best setup: Fade 113.2k–114.0k into CPI with active management.
- Key macro: CPI and geopolitics drive the global risk regime.
Stay disciplined around the 111.9k–112.0k pivot and let confirmation lead exposure. ⚠️

Weak US labor market drive gold higherGold Price and the US CPI
This week's US CPI data could drive gold prices higher through two distinct scenarios. A higher-than-expected CPI print may fuel concerns of stagflation in the US economy, an ideal environment for gold. Conversely, a lower-than-expected CPI could prompt the Fed to pursue further interest rate cuts, which would reduce the opportunity cost of holding a non-yielding asset like gold, but the support could be weaker than in the stagflation scenario.
The current labor market remains a key headwind, with recent Non-Farm Payrolls data showing a meager gain of only 22k new jobs in Aug, while the Jun figure was revised downward. Additionally, the Job Openings and Labor Turnover Survey (JOLTS) report now indicates that the number of job openings has fallen below the number of unemployed individuals, suggesting a potential surplus of labor. This could quickly impact consumer spending, which is a primary driver of the US economy.
Technical Outlook for Gold
From a technical standpoint, Gold (XAUUSD) has reached another record high. The expansion of the 21 and 78 EMAs signals a continuation of the bullish momentum.
A break above the 261.8% Fibonacci Extension at 3680 could see the price approach the resistance at 3820.
Conversely, a retracement could lead to a retest of the EMA21 and the support level at 3580.
By Van Ha Trinh - Financial Market Analyst at Exness

08/09/25 Weekly OutlookIt's CPI week is here once again, which means we're one week before FOMC and a likely interest rate cut by the FED, maybe the last week of choppy sideways action before the next leg up in Q4?
Last week BTC stopped just shy of the weekly high before settling around midpoint. Bullish structure throughout the week from start to finish reclaiming much of the losses from the week previous to that. As I have pointed out in the past late August & early September have historically poor returns and so far this year has followed the trend, down -13.6% from the highs of mid August.
All of this is to say the stars seem to be aligning once again for a repeat of previous cycles, a slow and negative August into September, print a local bottom and the next leg up/continuation higher in Q4 boosted by cheaper borrowing. There is even a growing chance of a 50bps cut on September 17th which would really fuel a risk-on surge going into the end of the year.
For this week I'm not overly concerned about CPI just because I believe the focus is on FOMC the week after. A reclaim of $113,500 before this weeks close may kickstart an earlier push by the bulls as currently that is the level keeping BTC down.
$104,500 is the 1D 200 EMA, a level untested since April, A retest as support before FOMC would be a great place to go long from IMO. Until either of those scenarios play out it's just noise and chop.
Good luck this week everybody!

NAS100 - Stock Market, Waiting for Inflation Index?!The index is above EMA200 and EMA50 on the one-hour timeframe and is in its long-term ascending channel. If the drawn upward trend line is maintained, we can expect Nasdaq to reach its previous ATH. In case of its valid breakdown, its downward path will be smoothed to the specified demand zone, where it can be bought with appropriate risk-reward.
U.S. equities closed lower on Friday after a volatile session, capping off a turbulent week in negative territory. Initially, weaker-than-expected employment data fueled optimism that the Federal Reserve would move toward further rate cuts. However, growing fears of an economic recession quickly overshadowed that optimism and pushed the indexes into the red.
Following the labor market report, expectations for a 25-basis-point rate cut at the Fed’s September meeting are now virtually certain. The main question, however, is how fast subsequent cuts might unfold. Some analysts have even floated the possibility of a surprise 50-basis-point cut on September 17. Fed Chair Jerome Powell, speaking at the Jackson Hole symposium, stressed that risks stemming from labor market weakness may now outweigh inflation risks—a factor that could justify a shift in the central bank’s policy approach.
Nick Timiraos, a prominent Wall Street Journal reporter closely tracking Fed policy, noted that the sharp slowdown in job growth over the summer has likely cemented the Fed’s decision to cut rates by 25 basis points in the upcoming meeting.
Still, he made no explicit mention of a 50-basis-point move. While markets have raised the probability of that scenario to 14%, Timiraos believes the main focus remains on a more moderate reduction. He also observed that the latest jobs report has deepened uncertainty over the pace and scope of cuts beyond September—a challenge that policymakers and markets will grapple with in the months ahead.
Barclays Bank now projects the Fed will lower rates three times in 2025—each time by 25 basis points in September, October, and December. This is an upward revision from its earlier forecast of just two cuts in September and December.
President Donald Trump once again lashed out at Fed policy in a post on his social media platform, writing: “Jerome Powell should have cut rates long ago. But as usual, he has acted too late.”
Meanwhile, mounting concerns over ballooning fiscal deficits—not only in the U.S. but also in countries like Japan, France, and the U.K.—have placed added pressure on long-dated bonds. The yield on the 30-year U.S. Treasury briefly climbed to a one-and-a-half-month high last week. At the same time, the Treasury Department plans to issue new three-year, ten-year, and thirty-year securities next week, an event that could further fuel volatility in the bond market.
The coming week will be light in terms of data volume, yet the few scheduled releases will carry significant weight as inflation once again takes center stage. On Wednesday, the Producer Price Index (PPI) for August will be published. Forecasts suggest both the headline and core readings will show sharp declines compared to July.
On Thursday, the European Central Bank (ECB) will hold its policy meeting, where markets currently expect the deposit rate to remain unchanged at 2.15%. Shortly afterward, traders will turn their attention to the U.S. Consumer Price Index (CPI) for August, along with weekly jobless claims data—closely monitored for signs of potential weakness in the U.S. labor market.
Finally, on Friday, the preliminary University of Michigan Consumer Sentiment Index will be released. This survey has been a particularly important gauge of inflation expectations this year, offering deeper insights into how U.S. households perceive price trends.
The PPI, which reflects changes in goods prices at the factory gate, often provides more forward-looking signals than the CPI. As shown in July’s data, any unexpected surge in August’s numbers could temper investors’ optimism about the pace of rate cuts. For now, the impact of tariffs on goods prices appears limited, while the Fed’s main concern remains the risk of renewed inflationary pressures in the services sector. According to the Cleveland Fed’s Nowcast model, headline inflation rose 0.1% in August to reach an annualized rate of 2.8%, while core inflation held steady at 3.1%.

ETH 4H Analysis - Key Triggers Ahead | Day 15💀 Hey , how's it going ? Come over here — Satoshi got something for you !
⏰ We’re analyzing ETH on the 4-Hour timeframe .
🔭 On the 4-hour timeframe for Ethereum, we can see that ETH is currently moving inside a very strong box and is preparing for this week’s upcoming news. The resistance (ceiling) of this box sits at $4,471, while the support (floor) is around $4,254. Once either of these levels is broken, Ethereum could make a strong move after this long consolidation phase. There’s also an early trigger zone at $4,332; if ETH breaks and stabilizes above this level, we can consider entering a position toward the top of the box.
⛏ Key RSI levels for Ethereum are at 58 and 40. Breaking these ranges could signal the start of a strong move. With increased volatility, ETH could even push toward the overbought (OB) or oversold (OS) zones.
💰 Currently, the size and volume of candles have dropped significantly — something we often see during holiday sessions. But with the start of the new week and upcoming economic reports, Ethereum could generate bigger candles and stronger momentum once it breaks out of this box.
🪙 Looking at the ETHBTC pair on the 4-hour timeframe, the chart still looks bearish with decreasing volume. The current zone is considered a maker-buyer area, and we’ll need to watch how the whales react here. If this level is lost, Ethereum could face a deeper correction and move toward its lower support levels.
💡 Ethereum currently has 3 alarm zones:
A short alarm zone at the bottom of the box — if broken, it could trigger stronger selling pressure.
A long alarm zone #1 at $4,332, acting as an early trigger for a potential breakout toward the top.
A long alarm zone #2 at $4,471 — breaking and holding above this level could lead to a solid upward move.
❤️ Disclaimer : This analysis is purely based on my personal opinion and I only trade if the stated triggers are activated .

BTC 1H Analysis - Key Triggers Ahead | Day 35💀 Hey , how's it going ? Come over here — Satoshi got something for you !
⏰ We’re analyzing BTC on the 1-Hour timeframe .
👀 On the 1-hour timeframe for Bitcoin, we can see that after touching its resistance at $111,300, Bitcoin moved toward its short alarm zone and activated it. However, the market didn’t show much selling pressure or bearish momentum. Currently, Bitcoin is ranging with very low volume, but with the new week starting, stronger volume could enter the market.
⚙️ Key RSI levels for Bitcoin are at 70 and 50. If RSI crosses these thresholds, Bitcoin could start a strong move — most likely at the beginning of the new week.
🕯 The size and number of green candles have slightly increased, and we are now sitting right below the critical resistance at $111,300. It’s likely that this level will be broken in the coming week.
🖥 This week has plenty of economic news events, which means the market could see high volatility. Overall, it looks like a good week for trading.
📊 Looking at the 1-hour timeframe of Tether dominance (USDT.D), after a strong rally it recently got rejected from the 4.51% level. The market sentiment shifted toward long positions, and selling pressure didn’t sustain. If 4.45% in Tether dominance breaks down, significant USDT could flow into Bitcoin and altcoins.
🔔 The key alarm zones for Bitcoin are set at $110,500 for short positions and $111,300 for long positions. Breaking these zones in the upcoming week could give us solid trade opportunities. Keep in mind that the economic news scheduled this week can strongly influence the market.
❤️ Disclaimer : This analysis is purely based on my personal opinion and I only trade if the stated triggers are activated .

Minor dip to 3330~3320, then skyrocketing to the Moon!Hello Traders,
The first wave of the uptrend is complete.
The second wave will dip to 3330~3320, followed by the third wave uptrend. Check the reference signal for take-profit levels.
Upcoming Macro Events :
- U.S. CPI (August 12): The main catalyst for volatility, likely to impact USD and real yields. A higher-than-expected CPI could strengthen gold, while a soft print might pressure the bull case.
- RBA Rate Decision (August 12): A dovish outcome could weaken the USD, indirectly supporting gold.
- Global Data (GDP, PPI): China’s economic data and UK GDP could influence risk sentiment and USD strength.
Gold is in a critical phase with bullish technical setup and positive sentiment, but volatility is expected due to key macro events. Traders should focus on support levels, monitor the CPI data, and remain cautious of bearish reversals if the consolidation fails.

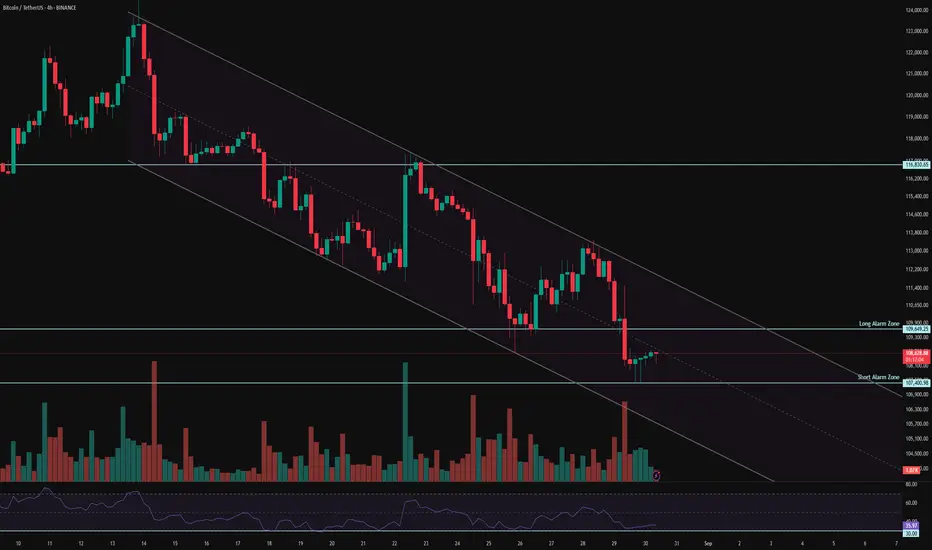
BTC 4H Analysis – Key Triggers Ahead | Day 27💀 Hey , how's it going ? Come over here — Satoshi got something for you !
⏰ We’re analyzing BTC on the 4-hour timeframe timeframe .
👀 In the 4-hour timeframe of Bitcoin, we can see that Bitcoin is moving inside a descending channel where each time it touches the top or bottom of the channel, it shows a reaction to these levels and then leaves a reversal move. Currently, Bitcoin has an important support at the 107,400 area, and if this level breaks, it can move towards its lower supports. On the other hand, there is a resistance at the 109,700$ area, and breaking this resistance could give us a long position.
⚙️ Our key RSI zone is at the 30 level, and the fluctuation is ranging above this level in a close environment. With an increase in volatility and selling pressure, if RSI passes below 30, it could be a confirmation for a deeper correction.
🎮 With a Fibonacci tool, we are going to identify Bitcoin’s key levels. The Fibonacci is drawn from the 117,000$ breakout area down to the 107,300$ support area. The price behavior at the 0 and 0.236 levels can help us for taking trades.
📊 In the 4-hour timeframe of Tether dominance, we can see that similar to Bitcoin but with an ascending difference, it is moving inside a channel. The 4.52% area is very important, as the midline of the channel is located here. In the previous leg of movement, it also reacted to this area and got rejected. Breaking this area could bring more selling pressure into the market and also on Bitcoin.
🕯 The size and volume of the red candles at the breakout zones are getting bigger, each time accompanied by higher selling volume. The presence of maker buyers is seen between the two highlighted zones. With an increase in Bitcoin’s volume, it can start its main trend. Keep in mind that we are in the holiday season.
🔔 The zones considered as alarm zones are the 107,400$ area and the 109,600$ area. The price action in these zones can help us with our trades. With an increase in Bitcoin’s volume, it could break one of these levels and move either up or down. Keep in mind that August has ended, and in the new month we have 3 important news events from the Federal Reserve, which could either bring strong inflows into the market or pull money out of it.
❤️ Disclaimer : This analysis is purely based on my personal opinion and I only trade if the stated triggers are activated .
Australian CPI To Keep The RBA Cautious On RatesAustralia's monthly headline inflation metrics were all above expectations. While the basing effect and likely one-off electricity costs are a factor, it doesn't explain everything. I look at some of the CPI report's internals and outline what I think this means for AUD/USD.
Matt Simpson, Market Analyst at Forex.com and City Index
