Selena | XAUUSD | 30M – Accumulation Before Expansion | CPI DAYFOREXCOM:XAUUSD
After a strong impulsive move, XAUUSD entered a consolidation phase under key highs. Instead of aggressive selling, price is forming a tight range above demand, suggesting smart money accumulation ahead of CPI volatility. As long as demand holds, continuation toward new highs remains the dominant bias.
Momentum pauses here are healthy — not bearish.
Key Scenarios
✅ Bullish Case 🚀
Condition: Hold above 4300/4325
🎯 Target 1: 4350
🎯 Target 2: 4400
🎯 Target 3: New ATH above 4400
❌ Bearish Case 📉
Condition: 30M close below 4280
Current Levels to Watch
Resistance 🔴: 4350 – 4400
Support 🟢: 4300 – 4285 – 4255
⚠️ Disclaimer: This analysis is for educational purposes only. It is not financial advice.
Cpidata

USOIL (WTI) | Moving Downtrend...USOIL | Technical Overview🕯
Bearish Setup:
USOIL continues to show bearish momentum as long as the price trades below 56.40 and 56.05, maintaining pressure toward the next target at 54.38.
Bullish Setup:
To shift into a bullish structure, the market must close a 4H candle above 56.40, which would support an upside move toward 57.40.
Key Levels
Pivot Zone: 56.00 – 56.40
Support: 55.00, 54.40
Resistance: 56.90, 57.40
Timeframe: 4H | Bias: Bearish Volatility | Current Price: 56.00
previous idea:

CPI Shock Moves Gold — Easy loss avoided - Easy strategy appliedSo when it's CPI Day.
I call it a Medium Probability Trading day.
Either I risk less or observe the charts because of the volatile nature CPI has on many main markets like Gold, JSE, US500.
ANd today was no different.
We first boxed the chop - sideways market
This way we don't trade when the market moves in a consolidation period.
WHEN TO TRADE WITH MAs
Only when the price breaks OUT and the price is below 20MA and below 200MA - We look for shorts.
Or when the price breaks OUT and the price is ABOVE 20MA and above 200MA - We look for longs.
However, the price remained within the chop until CPI came out.
Came out worse than expected, which caused a RALLY with gold in the short term.
So you need to consider these anomaly and volatile times when you trade. You might avoid unnecessary losses.
Got it? These are just some tips you can take into your account that I have learnt over the last 23 years of trading the markets with the SAME breakout trading system.
So let's sum up fundamentals now for those who love economics.
When the latest CPI and Core Inflation data hit the markets, traders instantly shifted focus to gold — the ultimate inflation hedge.
Let’s break down what unfolded.
🧾 CPI & Core Inflation Data
The Consumer Price Index (CPI) came in at 324.8, just below the forecast of 325.01.
This slight miss signals that inflation is cooling — a positive sign for markets.
Core inflation stayed steady at 3.1% year-on-year, suggesting price pressures remain but are slowly easing.
📊 Market Setup Before the News
Before the release, gold prices moved sideways, reflecting trader uncertainty.
The phrase “Strike avoided” hinted at calmer market sentiment after earlier risks faded.
Everyone was waiting for the data — and volatility was brewing beneath the surface.

EURUSD waiting for the newsTomorrow, the U.S. inflation data will be released — a key report that could shape the FED’s decision next week and determine the market’s next move.
The news will be published as scheduled, despite the ongoing government shutdown.
Watch for the formation of a higher low and potential buying opportunities after the release.

Gold suffers biggest crash since 2013: What’s next for metal?Gold just experienced its worst single-day crash since 2013, plunging over 8% from record highs after forming a double top.
What’s behind this dramatic move, and what’s next for gold?
After a strong rally driven by fiscal and trade uncertainty and delayed US economic data, gold suddenly tumbled to the $4,000s. This sharp drop comes amid technical overextension and ahead of a crucial US CPI report due Friday, with the government shutdown still adding to market uncertainty.
Overextended : Gold was heavily overbought on multiple timeframes (4-hour, daily, weekly, monthly), with a double top and weakening RSI signalling a correction was due.
Profit-taking ahead of CPI : Many traders secured profits before Friday’s CPI report, with consensus expecting inflation to tick up, potentially impacting Fed rate expectations and the US dollar.
Trade developments : De-escalation between the US and China, with Trump and Xi set to meet at APEC, reduced some risk premium that had supported gold.
Support and scenarios : Strong support levels remain, with a possible further downside to the 38.2% Fibonacci retracement (~$3,945), but a deeper drop to $3,735 is seen as unlikely unless catalysts turn more bearish.
Volatility is back in the gold market! Will this correction turn into a longer consolidation, or is it just a pause before new highs?
Watch the key levels and upcoming CPI data, and remember—trade smart, respect your risk, and cash out when needed!
This content is not directed to residents of the EU or UK. Any opinions, news, research, analyses, prices or other information contained on this website is provided as general market commentary and does not constitute investment advice. ThinkMarkets will not accept liability for any loss or damage including, without limitation, to any loss of profit which may arise directly or indirectly from use of or reliance on such information.

EURUSD unchangedThe market remains calm ahead of Friday’s U.S. news, which will likely set the tone for the next move.
A retest of previous lows is possible before a new bullish impulse.
Stay cautious with your risk and wait for confirmation before entering.

CPI Data and Its Power in Global Trading MarketsIntroduction: The CPI—A Mirror of Inflation and Economic Health
In the fast-paced world of global finance, one number can send markets soaring or tumbling—the Consumer Price Index (CPI). Whether it’s a sudden rise in U.S. inflation or a dip in Japan’s consumer prices, traders across the world hold their breath when CPI data is released. CPI is more than just an economic statistic—it’s the heartbeat of inflation monitoring, influencing everything from interest rate decisions, currency movements, bond yields, and global stock performance to commodity prices.
The CPI reflects the average change over time in the prices paid by consumers for goods and services. When prices rise, purchasing power falls; when they decline, deflationary risks loom. For traders, investors, and policymakers, CPI acts as a compass, signaling where economies—and markets—are heading next.
In this comprehensive discussion, we’ll explore the importance, impact, and trading implications of CPI data in the global market, with detailed insights into how it shapes financial trends, investor sentiment, and global capital flows.
1. What is CPI and Why It Matters Globally
The Consumer Price Index (CPI) measures the change in prices of a "basket" of commonly purchased goods and services—such as food, housing, clothing, transportation, and healthcare—over a specific period. It’s typically released monthly by government statistical agencies (e.g., the U.S. Bureau of Labor Statistics, the UK Office for National Statistics, or India’s Ministry of Statistics).
The CPI serves as a key inflation indicator. Inflation, in turn, influences the monetary policies of central banks like the Federal Reserve (Fed), European Central Bank (ECB), and Reserve Bank of India (RBI).
For global traders, this means that CPI data releases are among the most market-moving events. A single surprise in CPI—say, inflation coming in higher than expected—can lead to sharp movements in currencies, bonds, equities, and commodities.
2. Components of CPI: The Building Blocks of Inflation
To understand how CPI affects global trading, it’s vital to know what it measures. CPI baskets vary by country, but they usually include:
Food and Beverages: Covers groceries, dining out, and beverages—one of the most volatile components due to weather and geopolitical issues.
Housing: Rent, utilities, and maintenance costs; the largest weight in most economies’ CPI.
Apparel: Clothing and footwear prices, reflecting consumer trends and supply chain conditions.
Transportation: Fuel, vehicle prices, and public transport—closely tied to crude oil prices.
Medical Care: Hospital, medicine, and health insurance costs.
Education and Communication: Tuition fees, phone bills, and internet costs.
Recreation and Other Goods: Entertainment, travel, and miscellaneous services.
Each sector’s performance contributes to the overall CPI value, revealing which parts of the economy are heating up or cooling down.
For example:
Rising housing and fuel costs often signal broad inflationary pressure.
Falling food and commodity prices may indicate deflationary trends or reduced demand.
3. CPI’s Role in the Global Financial Ecosystem
CPI doesn’t operate in isolation—it interacts deeply with global financial systems. Here’s how:
A. Influence on Central Bank Policy
Central banks use CPI to set monetary policy. If inflation exceeds target levels (e.g., the Fed’s 2%), they may raise interest rates to cool spending. Conversely, if inflation is too low, they might cut rates or use quantitative easing to stimulate demand.
Higher CPI → Rate hikes → Stronger currency, weaker stocks
Lower CPI → Rate cuts → Weaker currency, stronger stocks
For instance, when U.S. CPI data shows persistent inflation, the Fed signals rate hikes—strengthening the U.S. dollar (USD) but often causing global equity markets to fall.
B. Impact on Global Currencies
Currency traders react instantly to CPI data. Countries with higher inflation and higher interest rates usually see currency appreciation, as investors chase higher yields.
For example:
A hotter-than-expected U.S. CPI often boosts the USD/INR pair as the dollar gains.
A lower Eurozone CPI may weaken the Euro (EUR/USD), hinting at looser ECB policy.
C. Effect on Bond Markets
Bonds are extremely sensitive to inflation data. Rising CPI reduces the real return from fixed-income securities, prompting investors to sell bonds and push yields higher.
For traders, CPI data drives Treasury yield volatility, a crucial input for pricing everything from derivatives to mortgage rates.
D. Stock Market Reactions
Stock indices like the S&P 500, FTSE 100, and Nifty 50 often rally when CPI cools, as it signals lower inflation and potential rate cuts. Conversely, a spike in CPI dampens investor sentiment, especially in rate-sensitive sectors like banking, housing, and technology.
E. Commodity and Energy Markets
Commodities, particularly gold and oil, react sharply to inflation readings.
Gold acts as an inflation hedge—rising CPI often triggers gold rallies.
Crude oil prices influence and are influenced by CPI; rising energy costs feed inflation and vice versa.
4. CPI Data and Global Market Volatility
The release of CPI data often sparks immediate volatility. For professional traders, it’s a critical time for positioning. Algorithmic and institutional traders monitor CPI in real-time, executing trades within seconds of the release.
A. Pre-Announcement Positioning
Markets often price in expected inflation based on forecasts. If the actual CPI data deviates sharply from expectations, it triggers rapid market repricing.
For instance:
If U.S. CPI is forecast at 3.2% but comes at 3.8%, traders expect tighter Fed policy, selling equities and buying dollars.
If CPI underperforms, investors anticipate easing, leading to a risk-on rally in global stocks.
B. The Volatility Chain Reaction
CPI data doesn’t just move one asset—it triggers a chain reaction:
CPI → Interest rate expectations
Interest rate expectations → Currency and bond yields
Currency moves → Commodity and equity adjustments
This chain makes CPI the most-watched economic indicator globally, alongside GDP and employment data.
5. Global Examples: How CPI Data Drives Markets Worldwide
1. United States (US CPI)
The U.S. CPI release is arguably the most impactful in the world. As the dollar is the global reserve currency, U.S. inflation data shapes global risk appetite.
When the U.S. CPI surged above 9% in 2022—the highest in 40 years—it triggered aggressive Fed rate hikes, leading to:
A stronger dollar,
Global equity selloffs,
Declines in emerging market currencies,
Sharp corrections in tech stocks.
2. Eurozone (HICP – Harmonised Index of Consumer Prices)
The Eurozone uses the HICP for consistency across member states. When Eurozone CPI rises, the ECB faces pressure to tighten policy, affecting global bonds and EUR/USD levels.
3. India
In India, CPI is crucial for the RBI’s monetary policy. A rise in food or fuel inflation pushes the RBI toward rate hikes, influencing:
The Nifty and Sensex indices,
Bond yields,
The Rupee’s strength against the Dollar.
4. Japan
Japan’s CPI data has global attention because of its history with deflation. When Japan’s inflation rose above 2% in 2023, the Bank of Japan hinted at policy normalization, shaking up global carry trades and Yen-linked assets.
5. Emerging Markets
In developing economies like Brazil, Turkey, and South Africa, CPI spikes often lead to currency depreciation and investor flight, as markets fear policy instability and economic overheating.
6. How Traders Use CPI Data Strategically
CPI data isn’t just for economists—it’s a vital signal for trading opportunities. Let’s explore how professional traders integrate it into their strategies:
A. Forex Traders
They trade based on interest rate differentials caused by CPI surprises.
Example: If U.S. CPI beats expectations, traders go long USD/INR or short EUR/USD, anticipating a Fed rate hike.
B. Equity Traders
They focus on sector rotation:
High inflation → Banks and Energy outperform, Tech underperforms.
Low inflation → Growth sectors (Tech, Consumer discretionary) shine.
C. Commodity Traders
They monitor CPI as a proxy for demand. Rising CPI hints at economic expansion, lifting demand for industrial metals and energy.
D. Bond Traders
They hedge inflation risk using Treasury Inflation-Protected Securities (TIPS) or short-duration bonds when CPI is expected to rise.
E. Derivative Traders
CPI announcements often lead to volatility spikes, creating opportunities in options trading, especially in volatility-based instruments like VIX futures.
7. The Global CPI Chain: How Inflation Spreads Across Borders
In an interconnected economy, inflation in one region affects others through trade, energy prices, and currency flows.
Rising U.S. inflation leads to stronger USD → Weakens emerging market currencies → Raises import prices in India, Brazil, etc.
Europe’s energy-driven inflation spills into Asian import prices, raising CPI globally.
Global supply chain disruptions (like during COVID-19) create synchronized CPI surges across continents.
Thus, CPI is not just national data—it’s a global ripple effect determining trade competitiveness and monetary coordination.
8. The Future of CPI and Global Market Analysis
With the advent of AI, big data, and real-time analytics, CPI measurement and interpretation are evolving. Traders now use:
Alternative data (e.g., online retail prices, freight rates) to forecast CPI before official releases.
Machine learning models to detect inflation trends early.
Global CPI correlation models to assess cross-border inflation risks.
Moreover, energy transition, climate costs, and geopolitical risks are reshaping inflation dynamics. CPI in the future may include green energy indices and carbon costs, making it more reflective of modern consumption.
Conclusion: CPI—The Guiding Star of Global Traders
In global trading, CPI is more than just an economic indicator—it’s a market driver. It influences everything from central bank policy decisions to daily trading volumes on Wall Street, London, and Mumbai. Understanding CPI means understanding how money flows, assets reprice, and investor psychology shifts across borders.
For traders and investors, mastering CPI analysis provides an edge in forecasting macro trends, identifying trading opportunities, and managing risks. Whether you’re in forex, equities, bonds, or commodities, CPI remains the most powerful pulse point of global economic health.
In the era of inflation uncertainty and global interconnectedness, keeping an eye on CPI data isn’t optional—it’s essential. It tells the story of every nation’s economic heartbeat and shapes the rhythm of global markets.
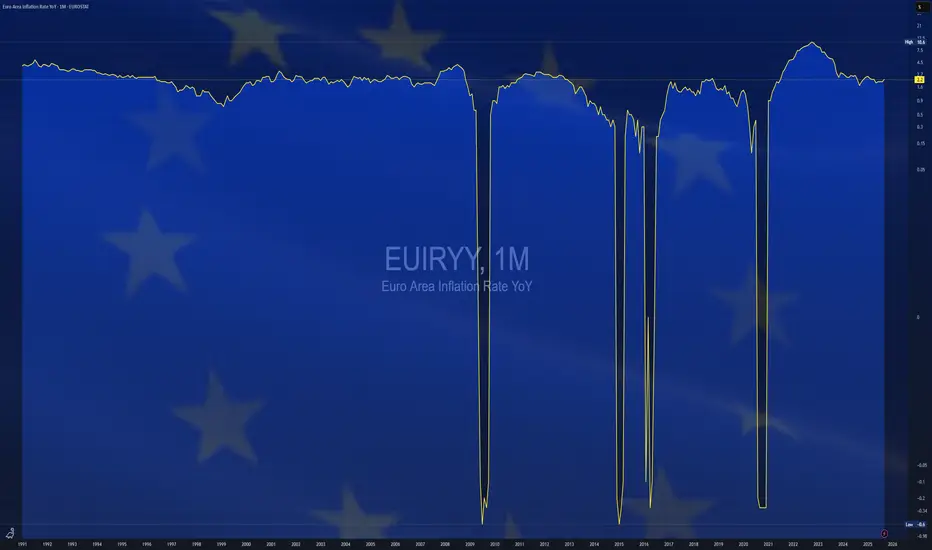
$EUIRYY - Europe CPI (September/2025)ECONOMICS:EUIRYY
September/2025
source: EUROSTAT
- Euro area consumer price inflation rose to 2.2% in September 2025,
up from 2.0% in the previous three months, moving slightly above the European Central Bank’s 2.0% mid-point target, according to preliminary data.
The increase was driven mainly by a smaller decline in energy costs, which fell just 0.4% compared with a 2.0% drop in August.
Services inflation edged up to 3.2% from 3.1%, while prices for food, alcohol and tobacco rose at a slower 3.0% versus 3.2% previously, reflecting weaker unprocessed food inflation.
Non-energy industrial goods inflation remained unchanged at 0.8%. Meanwhile, core inflation—which excludes energy, food, alcohol, and tobacco—was stable at 2.3%, holding at its lowest level since January 2022.
AUDUSD strengthens rebound from support following Aus. CPI dataFollowing stronger-than-expected inflation data overnight, the AUD/USD received a reasonably strong bid. As shown from the chart below, the recent upside move came on the heels of a rebound from 1M support at US$0.6578 in the shape of a bullish hammer pattern.
Bolstered by a nearby 1Y support level at US$0.6548, and the underlying trend pointing higher, further buying from current support could be seen. This may prompt a test of 6M resistance at US$0.6679, with a subsequent break opening the door to a 1Y resistance from US$0.6808.
Ultimately, then, this remains a buyers’ market for the time being with room to push north.
Written by the FP Markets Research Team

$JPIRYY -Japan Inflation Rate (August/2025)ECONOMICS:JPIRYY
August/2025
source: Ministry of Internal Affairs & Communications
-Japan's annual inflation rate eased to 2.7% in August 2025 from 3.1% in the previous month,
marking the lowest reading since October 2024.
Electricity prices fell much steeper (-7.0% vs -0.7% in July) due to government subsidies, and gas prices dropped (-2.7%) after being flat previously.
Education costs also continued to drop (-5.6% vs -5.6%). Price growth slowed for household items (2.0% vs 2.5%), healthcare (1.3% vs 1.5%), and recreation (2.3% vs 2.6%).
Inflation accelerated for housing (1.1% vs 1.0%), clothing (2.9% vs 2.8%), transport (3.0% vs 2.6%), communications (7.0% vs 6.4%), and miscellaneous goods (1.3% vs 1.2%).
On the food side, prices rose 7.2%, easing from July’s five-month peak of 7.6%, driven by the smallest gain in rice prices in eight months at 69.7%, amid Tokyo’s efforts to curb staple food costs. Core inflation also stood at 2.7%, matching market consensus and reaching a nine-month low.
Monthly, the CPI edged up 0.1%, holding steady for the third straight month.

$GBIRYY -U.K Inflation Rate Flat at 3.8% (August/2025)ECONOMICS:GBIRYY
August/2025
source: Office for National Statistics
- The UK’s annual inflation rate held steady at 3.8% in August 2025, unchanged from July and remaining near the highs last seen in January 2024, in line with expectations.
Lower airfares and easing services inflation were offset by higher motor fuel costs and rising prices for restaurants and hotels and food.
Meanwhile, annual core inflation rate slowed to 3.6% from 3.8%.

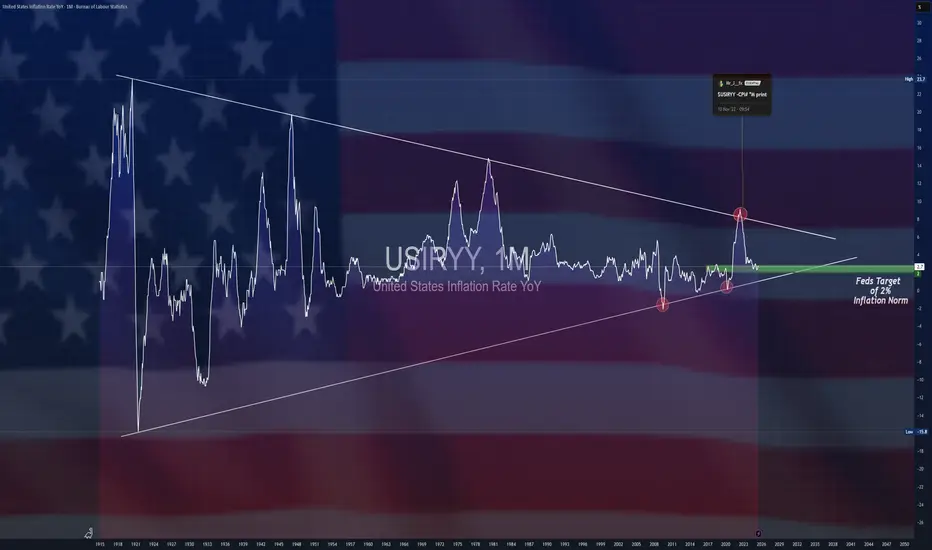
$USIRYY - U.S Inflation Rises to Seven-Month High (August/2025)ECONOMICS:USIRYY
August/2025
source: U.S. Bureau of Labor Statistics
- The US annual inflation rate accelerated to 2.9% in August,
its highest level since January, as retailers gradually passed higher import tariffs on to consumers.
On a monthly basis, consumer prices rose 0.4%, the most since January, above both July’s 0.2% increase and forecasts of 0.3%.
Core inflation held steady, rising 3.1% year-on-year and 0.3% month-on-month, matching July’s pace.

Gold | Waiting for CPI & FED rate cut | Priority Buy at support🟡 XAU/USD – 11/09 | Captain Vincent ⚓
🔎 Captain’s Log – News Context
US PPI yesterday : Wholesale prices dropped sharply, below forecasts → strengthening expectations of a FED rate cut.
FED probabilities : 100% odds for a -25bps cut next week, and even 16% of investors bet on -50bps.
Today : US CPI & Jobless Claims – key data to assess inflation & labor, determining the specific cut.
⏩ Captain’s Summary : FED will certainly cut rates, so Gold remains supported in its bullish trend. Short-term fluctuations may occur due to sentiment or surprises (e.g., tariff news from Trump).
📈 Captain’s Chart – Technical Analysis
Storm Breaker (Resistance) :
Bearish OB: 3645 – 3650 (near-term resistance)
Weak High: 3674 (target if breakout succeeds)
Golden Harbor (Support) :
Near support: 3622
FVG Dock: 3603
Bullish OB: 3581 – 3585 (strong mid-term support)
Market Structure :
H1 shows a short-term bearish BoS, retesting support.
Main trend remains bullish → possible pullback to 3622 or 3603 before rallying toward 3670+.
🎯 Captain’s Map – Trade Plan
✅ Buy (priority with trend)
Entry 1: 3621 – 3623 (Scalping)
SL: 3619
TP: 3625 – 3630 – 3635 – 3640 – 36XX
Entry 2 (FVG): 3603 – 3605
SL: 3592
TP: 3610 – 3615 – 3625 – 365x
Entry 3 (Bullish OB): 3581 – 3585
SL: 3572
TP: 3600 – 3620 – 3640
⚡ Sell (only short scalp at resistance)
Sell Zone: 3645 – 3650
SL: 3658
TP: 3635 – 3628 – 3622
⚓ Captain’s Note
“The Golden sails remain full of wind as the FED is almost certain to cut rates. Golden Harbor 🏝️ (3622 – 3603) and the deeper OB 3581 – 3585 are safe havens to follow the bullish tide. If the ship touches Storm Breaker 🌊 (3645 – 3650) , only Quick Boarding 🚤 short scalps are recommended. The larger voyage still heads north, steering Gold toward new highs at 367x.”

$CNIRYY - China CPI (August/2025)ECONOMICS:CNIRYY
August/2025
source: National Bureau of Statistics of China
- China’s consumer prices dropped 0.4% yoy in August 2025, after being flat in the previous month and missing market expectations of a 0.2% fall.
It was the fifth time of consumer deflation this year and the sharpest pace since February.
Food prices slumped (-4.3% vs -1.6% in July), logging the steepest fall in nearly four years, with broad-based decreases across categories and a sharper drop in pork prices, due to ample supply, lower production costs, and weak demand.
In contrast, non-food inflation quickened (0.5% vs 0.3%), supported by Beijing’s ongoing consumer goods subsidies, with increases in housing (0.1% vs 0.1%), clothing (1.8% vs 1.7%), healthcare (0.9% vs 0.5%), and education (1.0% vs 0.9%).
Meanwhile, transport costs shrank but at a slower pace (-2.4% vs -3.1%). Core inflation, which excludes food and energy, rose 0.9% yoy, the highest in 18 months, after a 0.8% gain in July.
On a monthly basis, CPI was flat, below forecasts of 0.1%, following a 0.4% increase in July.

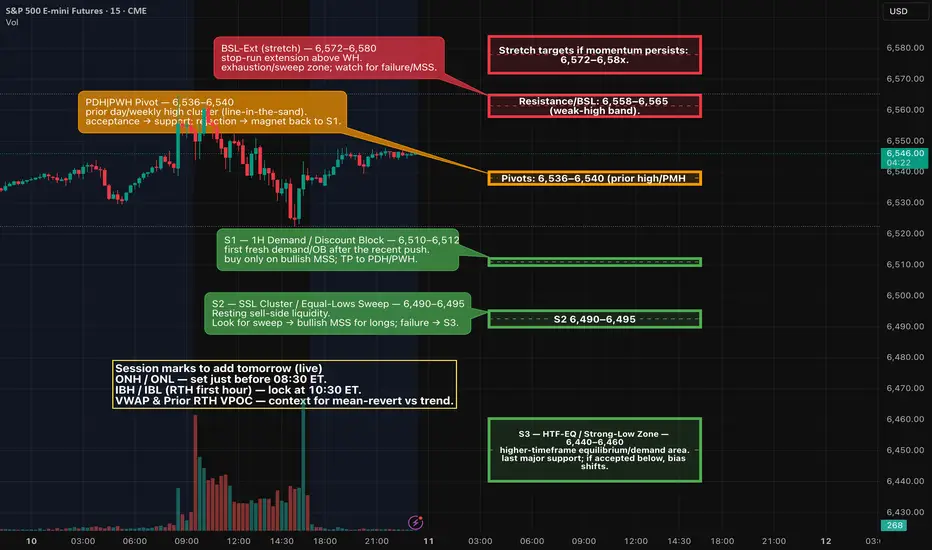
ES (SPX) Analyses for Thu, Sep 11 (CPI day)What matters tomorrow (fundamentals)
CPI (Aug) at 8:30 ET — the BLS schedule shows the August CPI release Thu Sep 11, 08:30 ET. This is the day’s primary driver.
Weekly Initial Jobless Claims at 8:30 ET — standard Thursday release; calendars show the event scheduled for Sep 11 at 08:30 ET.
Treasury 30-yr bond auction — $22B long-bond sale Thursday (typically 13:00 ET). This can move yields into the NY afternoon and spill into equities.
Context into the print: PPI (Aug) was released today (Sep 10); YoY +2.6% per data trackers/BLS release, keeping focus on CPI for confirmation. Markets are leaning toward a Fed cut at next week’s meeting.
I’m using your 1D / 4H / 1H.
Trend: Uptrend intact on 1D; price sits just beneath a “weak-high / premium” supply band. (1D shows fib extensions near ~6705 (1.272) and ~6799 (1.618) as far targets, not base-case for tomorrow.)
4H: Recent push into a red supply band then pullback; mid-range equilibrium roughly ~6,44x–6,45x.
1H: Resistance zone ~6,558–6,565 (your “Weak High” band). Prior highs around ~6,536–6,540 act as local pivot/PMH; below that, demand/discount blocks stack ~6,50x → 6,46x–6,44x.
Scenario A — Disinflationary/soft CPI (yields down)
Likely path: Early sell-side sweep into 6,51x → 6,49x discount → bullish MSS.
Entry: Buy the 1–5m PD-array in discount after displacement.
Targets: 6,536–6,540 → 6,558–6,565 (weak-high). Leave runner toward 6,57x–6,58x only if order-flow stays bid.
Invalidation: 1–5m structure loses 6,49x and cannot reclaim.
Scenario B — Hot CPI (yields up)
Likely path: Buy-side sweep through 6,558–6,565 → failure → bearish MSS back below the band.
Entry: Short premium PD-array after displacement down.
Targets: 6,536–6,540 → 6,51x, stretch 6,49x then 6,46x–6,44x if momentum accelerates.
Invalidation: Acceptance back above 6,565 with bullish structure.
Projections:
ES futures are anticipated to respond within a 5-15 minute window following the 8:30 AM release, with intraday movements likely intensified by algorithmic trading and stop-hunting activities. Historical analysis of the past 6 CPI events indicates an average end-of-day ES move of approximately +0.76% in response to ±0.1% deviations from forecasts. The prevailing volatility suggests that implied moves, derived from options data, are forecasting a swing of around 0.5-1% (equivalent to ±30-60 points from current levels), though actual market responses have been known to exceed these expectations in the event of surprises.
In the pre-release phase, spanning overnight to pre-market hours (approximately 4:00-9:30 AM ET), market participants are likely to observe a consolidation or mild upward bias within a range of 6480-6575, building upon today’s record highs. The light trading volume may lead to false breakouts around critical levels. Traders are currently positioning for a "failed breakdown" pattern, wherein an initial dip below recent lows could trigger stop-loss orders, followed by a swift reversal higher if market sentiment remains intact.
As the clock strikes 8:30 AM ET, high volatility is expected, with the potential for a 20-40 point gap open or sharp spike. A common occurrence is an initial downside flush aimed at testing liquidity (for instance, dipping below 6500) before a definitive market direction is established. Whipsaw action is likely as news headlines emerge, with particular focus on the core CPI data, which will be pivotal for determining sustained market trends.
Good Luck Everyone!
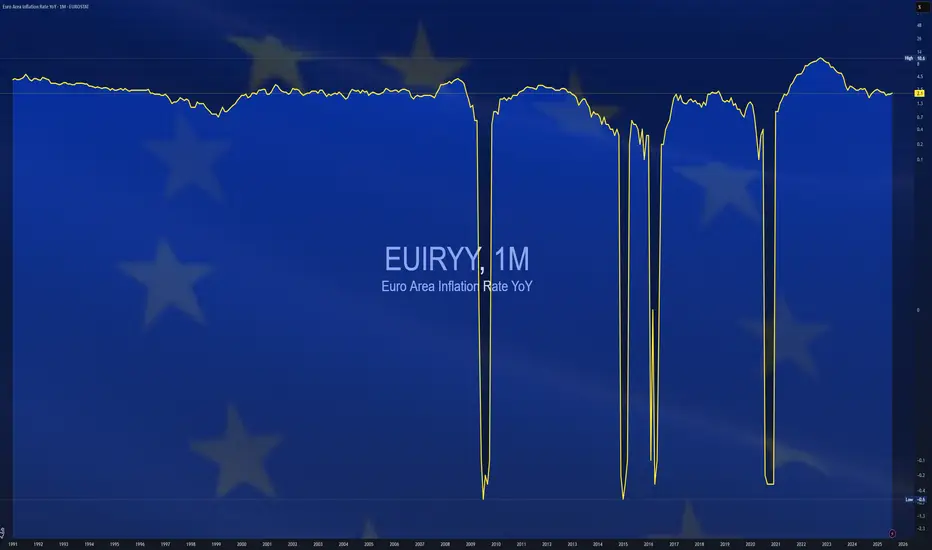
$EUIRYY -E.U CPI (August/2025)ECONOMICS:EUIRYY 2.1%
August/2025
source: EUROSTAT
- Euro area consumer price inflation rose to 2.1% in August 2025,
slightly above both July’s pace and market expectations of 2.0%, preliminary data showed.
Unprocessed food prices climbed 5.5% from 5.4% in July,
while energy costs fell 1.9%, a smaller decline than the previous month’s 2.4% drop. Services inflation eased to 3.1% from 3.2%, and prices for processed food, alcohol, and tobacco rose at a slightly slower pace of 2.6% versus 2.7%.
Non-energy industrial goods inflation held steady at 0.8%. Core inflation—which excludes energy, food, alcohol, and tobacco—remained unchanged at 2.3%, marking its lowest level since January 2022.
$JPIRYY -Japan Inflation Hits 8-Month Low (July/2025)ECONOMICS:JPIRYY
July/2025
source: Ministry of Internal Affairs & Communications
- Japan’s annual inflation rate eased to 3.1% in July 2025 from 3.3% in June, the lowest since November 2024.
The moderation was driven by falling electricity prices and flat gas costs, which helped offset a faster rise in food prices, largely fueled by surging rice costs. Core inflation also stood at 3.1%, in line with the headline rate but slightly above market expectations of 3.0%.

$GBIRYY - U.K Inflation Hits 18-Month High (July/2025)ECONOMICS:GBIRYY
July/2025
source: Office for National Statistics
- The UK’s annual inflation rate rose to 3.8% in July 2025 from 3.6% in June,
the highest since January 2024 and slightly above forecasts of 3.7%.
The uptick was led by higher transport costs linked to school summer holidays, with additional pressure from motor fuels, restaurants and hotels, and food and non-alcoholic beverages.
On a monthly basis, CPI rose 0.1%,
defying forecasts of a 0.1% decline but slowing from June’s 0.3% gain.
Core inflation inched up to 3.8% from 3.7%.

EURGBP shorts due to higher than expected UK CPI y/y readingThe most recent UK Consumer Price Index (CPI) data for July 2025 indicates an annual inflation rate of 3.8%, an increase from 3.6% in June 2025, marking the highest level in 18 months. Key drivers include rising transport costs and food inflation hitting a 16-month peak. Core CPI, excluding volatile food and energy prices, climbed to 3.7% from 3.5% in May 2025. The CPI index stood at 138.90 points in June 2025, up from 138.40 points in May.
As a result of the above date, we expect the EUR to weaken against GBP.

USDCAD potentail longs due to weaker than expected CAD CPI y/y The Canadian Consumer Price Index (CPI) for July 2025 showed a year-over-year (YoY) increase of 1.7%, down from 1.9% in June 2025 and below the forecast of 1.8%. The decline in headline inflation was largely due to falling gasoline prices, though food and shelter costs continued to push inflation higher.
Due to the weaker-than-expected economic data, we expect the CAD to weaken against the USD.

CPI Relief Sparks Crypto Rally The U.S. Bureau of Labor Statistics released the July 2025 CPI and Real Earnings reports today at 8:30 AM ET. The data came in exactly as markets expected, no hotter than expected inflation and sparking a risk-on rally across the market, while the U.S. Dollar Index (DXY) dropped sharply.
Key Data Points:
CPI (Headline): +0.3% m/m, +2.9% y/y (June was +2.7% y/y)
Core CPI (ex-food, energy): +0.2% m/m, +3.2% y/y (stable from June)
Energy: +2.1% m/m — Gasoline +3.3%
Food: +0.2% m/m
Shelter: +0.4% m/m (still the largest inflation contributor)
Real Avg Hourly Earnings: +0.1% m/m, +1.1% y/y
Real Avg Weekly Earnings: +0.3% m/m, +0.7% y/y
Market Reaction:
The release of the July 2025 CPI and Real Earnings data triggered an immediate and decisive move in financial markets. The U.S. Dollar Index (DXY) saw a sharp and rapid decline within minutes of the announcement, reflecting a shift away from safe-haven demand. This was largely because inflation came in exactly as expected, avoiding the “hot” surprise that could have reignited fears of further aggressive Fed action. Equity futures jumped, and crypto markets reacted almost instantly, with BTC, ETH, and SOL showing strong green candles on the 1-hour chart.
The drop in DXY removed a major headwind for risk assets, as a weaker dollar often correlates with stronger performance in crypto. The reaction also suggests that traders were positioned defensively ahead of the release and quickly moved capital back into higher-risk assets when no negative surprise was observed.
The post-CPI order flow also hints that macro traders are linking USD weakness directly to crypto strength in this environment. While the momentum is positive in the short term, it’s worth noting that the Fed will remain cautious, especially with shelter inflation still contributing heavily to the overall CPI.
Currently BTC is moving around $119,900 (~1.2% since CPI release) while ETH, SOL, XRP, BNB are 3.74%, 3.22%, 1.55% and 2.41% respectively at the time of writing.

$USIRYY -U.S Inflation Rate Steady at 2.7%, Core Accelerates to ECONOMICS:USIRYY
July/2025
source: U.S. Bureau of Labor Statistics
- The US annual inflation rate held at 2.7% in July, defying forecasts of a tariff-driven rise to 2.8%.
Core inflation climbed to 3.1% from 2.9%, above expectations of 3%, signaling underlying price pressures despite stable headline CPI.
On a monthly basis, CPI rose 0.2% as expected, while core CPI increased 0.3%, its largest gain in six months.
AUDUSD: Rate Cut Tuesday + Price At A Daily -FVG! Time To Sell?Welcome back to the Weekly Forex Forecast for the week of Aug 11 - 15
In this video, we will analyze the following FX market: AUDUSD
AUDUSD has been difficult to trade, as it chops its slow grind upwards. Then last, although the week's trading range was small, the Weekly candle closed as a bearish Inside Bar. This, as price made contact with a -FVG! The scenario could be laying the ground work for a new bearish leg to form.
Couple the above with an interest rate cut coming Tuesday for the AUD, and August being a historically bad month for the aussie, things could get real interesting for sellers next week.
Enjoy!
May profits be upon you.
Leave any questions or comments in the comment section.
I appreciate any feedback from my viewers!
Like and/or subscribe if you want more accurate analysis.
Thank you so much!
Disclaimer:
I do not provide personal investment advice and I am not a qualified licensed investment advisor.
All information found here, including any ideas, opinions, views, predictions, forecasts, commentaries, suggestions, expressed or implied herein, are for informational, entertainment or educational purposes only and should not be construed as personal investment advice. While the information provided is believed to be accurate, it may include errors or inaccuracies.
I will not and cannot be held liable for any actions you take as a result of anything you read here.
Conduct your own due diligence, or consult a licensed financial advisor or broker before making any and all investment decisions. Any investments, trades, speculations, or decisions made on the basis of any information found on this channel, expressed or implied herein, are committed at your own risk, financial or otherwise.
