Crashpattern

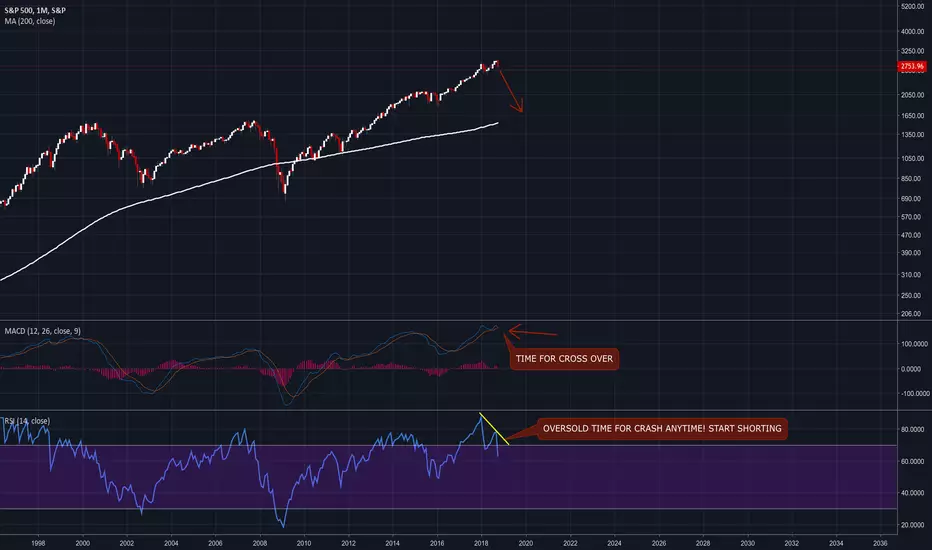
SPX looking interesting for the bearsTwo key indications on the long-term SPX weekly chart to watch.
First, there is a clear divergence between the price and the RSI... a bearish signal
Also, the ADX, which measures internal trend momentum, has been falling as the price was rising. So, no momentum for the bullish move was building on the rise. This is a signal to stall out.
Both of these together could be a precursor to a nice dump.
Thoughts?

Bitcoin Crash 2018 vs. 2014
This post is provided for informational purpose only. It is not a financial advice to buy/sell.

S&P500 (SPX) Hit Upper Targets. Two Sell Areas. Bitcoin/USD Daily Bars, LOG Scale, 06/14/18, 5:30 p.m. EST, by Mike Mansfield
Hi trader friends, quick post for a stock index move down that may happen from here or a bit higher. Even though we are into cryptos, I used to run a SP500 commodity program, then went all in on FX in 2003, so I like other markets besides cryptos. Here’s a post for futures & stock traders. There may be a short opportunity here or a bit higher around 2800-2810.
SUMMARY:
Spoos met a confluence of resistance lines yesterday than may stop the market. There is one other area just above this level that offer a clean short as well.
The black Schiff 0.50 Pitchfork line.
The blue upper parallel line.
The lower edge of the yellow Andrews Pitchfork.
Time for at least a quick reversal.
Two cycles heading down for approximately 10 & 17 more days.
Divergence on the Austin’s SSRSI indicator.
Braking today’s low of 2769 would likely set a moved down to 2745.
Put Call Ratio is at a low point that often means a significant down moves is near.
Mutual fund managers have near historic low levels of cash, meaning they're virtually all in.
But, there is still some fresh money left from foreign buyers, mom and pops and some hedge funds and of course the grand manipulators of all time, the world central banks.
One more push up? If we get a rally to 2800-2810 (2807 to be exact) where the Gann 8:1 line and upper blue parallel line meet, then get a 1-2 bar Key Reversal down on significant volume, that would be another good place for a short. This assumes that we are in a large degree Wave C rally.
Conversely, a daily close > 2807 likely means we are in a final 5th wave up of this years up move.
PATTERN:
I do not have time to do all the smaller wave counts, but with all the overlapping waves, it still looks like the market is in a complex longer-term corrective pattern that may not have finished with the February or April low.
ELLIOTT WAVES:
Unclear, but possibly a C wave high, that could be the Wave 2 high! Maybe we get one more push up to 2807 area. But if and when the market starts gapping down, then we
could have a wild Wave 3 to the downside on our hands.
RISK:
The GANN 8:1 line (upper dashed black line) is sometimes hit before a market has a major reversal. This was a call I had on Decred crypto a few weeks ago that was right on the money at the 8:1 Gann line. So, if this pullback doesn’t last a week or two from this point, then there might be another decent sell opportunity where the GANN 8:1 line meets
the upper blue parallel channel line around 2804-2820 area, depending if and when it gets there.
TARGETS FOR NOW, IF TODAY'S LOW IS BROKEN, BEFORE A NEW HIGH:
2743 (middle blue dashed line).
2686 (lower blue dash line and lower blue parallel channel support line.
NOTE: If lower blue parallel channel support line is broken, that could be quite bearish.
CYCLE TURNING POINTS:
Short-term yellow cycle bottoms 06/25/18 at NY open.
Longer-term blue cycle bottoms 07/03/18 at NY open.
NEGATION OF SHORT-TERM BEARISH OUTLOOK:
Closing above the GANN 8:1 line would likely mean we are actually an ugly 5th wave to a new all-time high.
Note the dashed green arrow heading upward at the lower black Schiff pitchfork. This could be the support level if the market is still excess bullish mode. If so, that is the place to try a buy.
Hum...
Where else can people put their funds with rates so low and likely to move up and crush bond holders? Real estate is in another bubble, but not liquid like stocks, so either stocks or cryptos. Watch gold the next few days.
See if we get some wild moves in ether bonds (time for Wave C of wave 2 bounce) to give a clue on stocks, of course bonds, gold, and cryptos. Watch the money flows.
DISCLOSURE:
This analysis is meant for educational purposes only. You trade at your own risk!
Cheers!
Michael Mansfield CIO

Bitcoin: I hope I made a mistake. Looks terrible...Previous Ideas
This post is provided for informational purpose only. It is not a financial advice to buy/sell.


Bitcoin : Market in pause. Buyers sleeping, sellers awake.Hi traders,
As you can see the market is having a small pause.
Due to the too important sales that occured during the previous weeks, buyers seems to be scared to enter the market, which is completely rational.
People also noticed the size of the crash and the nasty structure of the formed pattern, the average person sees the lack of possibility to make money in this unstable and crashing market and is not willing to enter now.
Buyers are starting to think if it is the right time to enter for long term, but they are apparently not entering the market as we noticed this week that when Bitcoin is around the 6.500$ value, buy volumes remain very low.
We had some local pumps that artificially maintained Bitcoin price above 6.500$, this is a way to slow the crashing process from the persons controlling the market.
They are doing it for plenty of reasons : maintening a price not far from some profitable sales for miners which lets miners hoping they could see higher prices so they don't stop mining, it starts up potential greed from greedy buyers that sees Bitcoin market raising back and some of them of course won't resist jumping it, higher prices means easier short possibilities with more profits, ...
Everyone is finding an interest when Btc price gets artificially pumped up.
I suspect we might have an important incoming bulltrap sooner or later, it is a long time we did not see one, this 6.500$ level is an ideal zone for a bulltrap as this zone is a fake psychological reversal area, and it appears that market manipulators still have some more Tether in reserve to pump up Bitcoin prices.
But do not get wrong, these raises are just an illusion, whatever raise you will see here will be a Bulltrap.
In a completely crashing market, there is ALWAYS some attraction to the ground, and there is no way to stop it until the asset reaches a particular low value, which is according to my calculations, around the 3.560$ area.
This 3.560$ target is not the bottom of the market, it is an area that is likely to create a slow non parabolic bullish wave, that will end up decreasing slowly to reach some lower values, but i will come to these lower targets i calculated when it will be time.
If you are ever doubting that Bitcoin is bottoming here, picture a face to face Bitcoin pattern with the Nasdaq Composite pattern, realize we are taking a Nasdaq Composite wall in the face since January, this should give you pause.
Do not forget that these cryptocurrencies are a real threat for the governments of the world, and that when they are talking about regulations, they are talking about terminating this threat as they 100% do not want to lose the control of their money.
This means all these current cryptocurrencies could reach some extreme low values, even if it is difficult to imagine if you are believing in cryptocurrencies.
This market is extremely risky, and having other incoming bull cycles with new all time highs is ABSOLUTELY not a certainty.
Bare in mind i am not a financial advisor, and i could be wrong.
Good luck.

[BTC-USD] MUST WATCH! 2014 & 2018 MARKET CRASH ANALYSISI was blown away when i spent a few hours diligently inserting all the numbers from 2014 & 2018 into an excel spreadsheet last night. I did some modeling and comparisons today, projecting the same percentages from 2014 and seeing what kind of numbers I would get for 2018. Well, as I said! I was blown away by the math! I had no idea that 2014 was really that bad of a bear run. I had no idea that the price of BTC did nothing for about 2 yrs in 2014 -2016
So, my point in this video is that I know traders and investors have a lot of hope for Crypto in general, well I do too, but I see many analyst just too optimistic and emotional about their projections. Many of them have a bias.. I try as much as I can to let the charts tell me the truth. After this comparison, I am now FULLY convinced prices can reach as low as 2 and 3 k and then consolidate for a whole year and do absolutely nothing as it was shown in 2014. Now of course, 2018 is a completely different animal and I'm fully aware of the 23 x growth in BTC market cap as described in my video. I know 2018 has more retail investors and much more volume, but the same is happening regardless of how large the numbers become! The math here on this video is evident of that truth! This analysis has helped me tremendously not only from a fundamental but from a historical context. If history repeats itself as some has described , well at least I'm now more prepared to adjust to this turbulent bear run!
I hope this video has provided some of you with better insight as to what the worst scenario may be! The numbers took a few hours to put together. I have many, many other extensive numbers that I could not insert into this video from my spreadsheet. Trading view only provides us 10 min per video. So i could not insert even half of my numbers I projected!
Give me a like and if you want to see how i trade and make profit in this bear run, then follow me!
Thanks CryptoBuzzAnalyst
PS: This is not financial advice, please do your own research! This is not investing advice!
howmuch.net

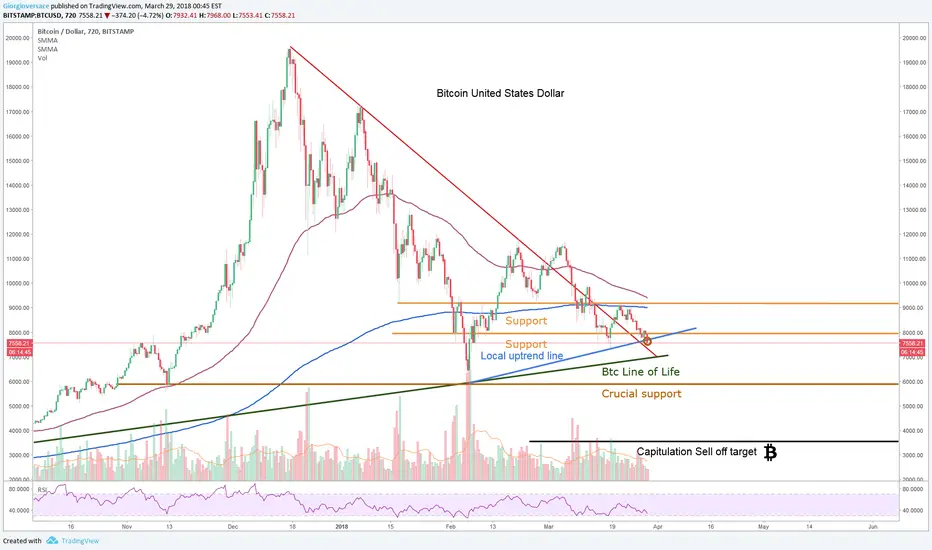
Bitcoin, about to test its own bubble life .Hi Traders,
As i expected since very long weeks, Bitcoin is about to test its line of life, this line is the life of the Bubble rallye starting pattern since around last May.
Bitcoin just broke below the very important local line formed since the low of february (blue line), this means we have extremely high probabilities of heading towards the line of life.
I expect a bounce of Btc around this area (around 7k) it is normally rational to expect an upward movement around this zone as Btc bubble burst is still not over, so it has to test its own life and react to its testing.
This could open possible swing trades, or day trades depending on how much it reacts around this zone.
If Bitcoin does not bounce around this line of life, which is possible but not likely, i would expect Bitcoin to form a double bottom reactive bounce with the February low (around the 6k zone).
If Bitcoin ends up breaking below its line of life, and below its crucial support, i expect a rational economic bubble capitulation sell-off phase to occur.
Good luck and stay safe with your money, trading in a bursting bubble process is extremely risky unless you are shorting at right times.
XRP on life support
G'day Cobbers,
XRP is set to drop like a stone, if it doesn't bounce at this previous low, hodlers could be in for a rough time. BTC is set to decline possibly to 6k and with xrp sitting on a cliff edge. Be careful. This descending triangle is going to hurt.
G'day
Thanks for dropping by, hopefully you garner something valuable from my post, be it educational or an idea towards a trade of your own. Please share, like and comment and engage with me, I am here to help.
Trader, Chart analyst and all round larrikin. Reside in NQ Australia, surrounded by Crocodiles, snakes & giant spiders, not to mention the boxing Kangaroos and devilish Drop bears. It makes my job quite hazardous but strewth mate, I love it.

BTC - Be careful, the macro trend is still very bearishLong-term I am extremely bullish on BTC. However there is no denying we are in a crash pattern. Until we get some bullish signals on the daily chart I would be very careful injecting any more fiat into the market. Also,the macro movements of BTC are difficult to predict, so the important thing to note in this chart are the price levels and their significance, not the overall pattern itself. As usual, your strategy should be changing based on any new data, and this data will be old as soon as you read it. Always keep that in mind! With my caveats out of the way, let's get started.
I believe we are currently in the "hope" phase of the crash pattern. This hope phase could continue on this leg as high as $10,200 or slightly over. My belief comes from the obvious signs on the chart, but also a few fundamental factors. First, no new money is coming into the market - the tether printer has been quiet and volume has dropped off whereas volatility has gone crazy. Furthermore, whenever BTC booms alts sink - this means money is just being moved around internal to the market, but not being injected into the market from fiat (which would mean alts would not bleed as much).
Soon we can see a second collapse. This collapse could go as low as 6K although many traders are calling a bounce at $7,200. Either way we will see a run at least to previous lows ($8,500-$9,200) like we are seeing now. If these lows are not broken we will see a final collapse into the "despair" phase, at which point we will likely begin consolidating for a true bull season. Note that the prices and patterns shown on my chart are approximate. I do not try to predict timeframes nor exact prices, simply the overall market pattern.
In short, if you are trading in this market these are the key levels to look out for, in order:
$12K on this run: Bear trend officially broken, all these predictions are out the window.
$10,200 on this run: Likely maximum possible level for bitcoin.
$6,000-$7,200: Next bounce level, due to strong support from previous bounce and plenty of buyers thinking it must be absolute bottom.
$8,500-$9,200: Likely maximum price level after this bounce.
$4,000-$5,500: True despair prices.
I appreciate any feedback - especially contrarian feedback. It's always important to have your views and opinions challenged, ESPECIALLY when analyzing the market! Thanks, and happy trading!
