[CRT] BITCOIN -> Weekly Outlook for the week of January 12Let’s look for the weekly direction for our beloved BITCOIN from a CRT perspective, as we have been doing with other assets since the end of 2025.
First of all, I would like to kindly ask you for a follow and to show some love to this article if you liked it, so I can keep creating this type of content.
Let’s get started. As always, first a bit of context to understand where we are and where we might be heading:
6-month timeframe chart of COINBASE:BTCUSD
On this timeframe (6 months), we can observe a bearish range formed after the close of the last semester candle of 2025, with a target at 112K .
It is worth mentioning that, as we already know, the BIAS for this asset has always been bullish, and we only have one precedent of such a high-timeframe range being completed in the opposite direction in the last ten years , and that precedent occurred during the 2022 correction.
Could this bearish range be completed? In my opinion, anything is possible in this world, but as always from a CRT perspective, we will first be waiting for price around 80.5K (red line on the chart), which is the low of the second semester of 2025 and the first possible reversal point on this timeframe.
Let’s now move down to the monthly timeframe:
Monthly timeframe chart of COINBASE:BTCUSD
On the monthly timeframe, we have a closer target located at 83.7K, which is the low of December 2025, and which we can aim for first, since price must at least go for the November low.
Why does it have to go for the November low if there is no bearish range formed toward that level on this timeframe?
Because from a CRT perspective, to go down, price must take highs, and to go up, it must take lows . November closes with the body outside of October, December is an inside candle which we ignore due to its condition, therefore if price wants to reverse, it must take that low, and if it wants to continue lower, obviously it must take it as well.
Let’s continue, now on the 2-week timeframe:
Biweekly timeframe chart of COINBASE:BTCUSD
Things are getting interesting for our intraday trading. We already have a first target with a high probability of being completed during this month of January, which is the low located at 86.35K, although there are still 7 days left for this low to be confirmed on the biweekly timeframe. Let’s now move down to the weekly timeframe to see if this low makes sense:
Weekly chart of COINBASE:BTCUSD
On the weekly timeframe, with 18 hours left before the candle closes at the moment I am writing this article, the next target is located at 86.675K . If price is going to complete it, it will most likely close inside the biweekly range and confirm the 86.35K target.
To finish this analysis and clearly define the intraday direction, let’s zoom in a bit more and move to the daily timeframe:
Daily chart of COINBASE:BTCUSD
On the daily timeframe, we already have the target we will aim for on Monday once we get confirmations from bearish ranges formed on the 4h, 6h, or 12h timeframes pointing toward lower lows, and we will take first partials at 89.2K .
To take a bit more risk, although it is difficult without having Sunday’s candle closed, I have drawn an optimal selling zone, which is basically Friday’s PO3, since Saturday is an inside candle and we ignore it.
We also need to pay attention to the liquidity taken above on Sunday , as price might start dropping from there:
4h timeframe chart of COINBASE:BTCUSD (optimal sell zone)
And that’s it for my weekly outlook on $COINBASE:BTCUSD.
As you know, if you liked it, please give me a follow so I can keep writing this type of content.
Have a great start to the week and many profits!
CRT

[CRT]Weekly outlook -> EURUSD & GBPUSD (week of January 12)After a bearish week and to everyone’s surprise considering it was NFP week, leaving one of the targets uncompleted (specifically the two-week timeframe one), and in order not to lose track of last week’s CRT analysis , we already have direction for the start of this week:
Biweekly timeframe chart for FX:EURUSD
Here we have two targets for Monday or Tuesday:
The low of Friday, January 9 of this year
The low of Thursday, December 9, 2025
But before going into more intraday trading details, let’s analyze higher timeframes from a broader perspective:
Yearly timeframe chart for FX:EURUSD
As we already concluded last week when analyzing the yearly close , our target is the wick of the 2025 high, but that does not mean price will head there in a straight line right at the start of the year.
Let’s now move down to the semiannual chart. This time we will look at euro futures CME:6E1! because the semiannual close is very close to the high of the first six months of 2025, and the picture may change depending on whether the second semester actually closes inside or not for our analysis:
Semiannual timeframe chart for EURUSD futures CME:6E1!
And indeed, it closes inside the range, so we have a first possible reversal point at the low of the second semester of the year, which happens to be August 1, 2025:
Daily timeframe chart for EURUSD futures CME:6E1!
We all agree that this target is still very far away , but it never hurts to keep it in mind to see whether it aligns with lower timeframe targets .
Let’s remember that last week we were considering the possibility of a monthly failure swing, speculating that price was already ready to move lower without the need to take December’s high , and it seems we were right, so we also mark December’s low as a target:
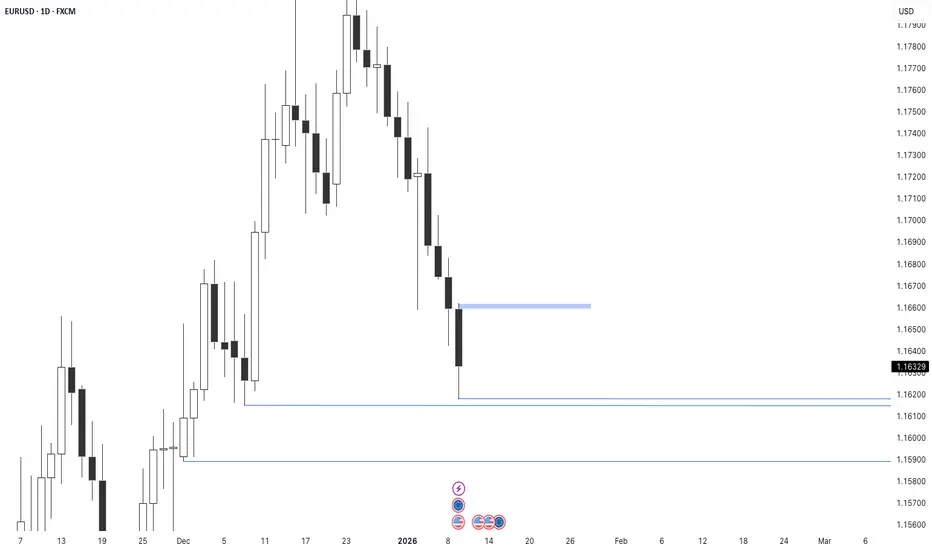
Daily timeframe chart of FX:EURUSD
If we take a look at DXY, we also confirm targets and direction for the upcoming week:
Monthly chart of TVC:DXY
Let’s now bring things down to what we can expect for this week, which I expect to be another bearish one:
For me to confidently enter short positions, I would expect price to take the high left by NFP, because that is where the most important movements occurred and it also coincides exactly with Friday’s PO3 zone:
4h timeframe chart of FX:EURUSD
Why those highs and not the high of the next 4h candle?
Because even though the trend is bearish and bullish ranges usually do not complete, those highs are where the “most relevant” movement took place (even though it was a rather weak NFP), and that is where price is more likely to be attracted.
Before finishing, let’s take a quick look at the British pound:
Weekly timeframe chart of the FX:GBPUSD
The pound last week activated a bearish weekly range from which the internal target has already been taken, but the external one is still pending, which—if we are not wrong on FX:EURUSD — FX:GBPUSD should also complete.
So my sell zone is more or less the same as for FX:EURUSD , but with a small nuance:
4h timeframe chart of the FX:GBPUSD
FX:GBPUSD , by liquidating the high generated by NFP, is also liquidating Friday’s high, so if price reaches this zone, there will be more confluences for bearish continuation than on its European cousin $FX:EURUSD.
And that’s it for my weekly projection for this week. I hope it was useful and, above all, don’t forget to like the post and follow me if you want to support this type of content!
Have a great start to the week everyone and many profits!
[CRT] XAUUSD - Weekly Outlook for the week of January 12Let’s go for the first weekly Outlook on CAPITALCOM:GOLD , but first of all, a quick context of what happened the previous week:
NFP week, normally price tends to hold back in order to expand on Friday of that week, but that was not the case, and although price expanded to the upside, it was not able to recover the drop from the beginning of the year:
Weekly chart of CAPITALCOM:GOLD
On the weekly chart this leaves us with an inside candle , and we already know what this means in general terms for CRT: We have no direction for the upcoming week, at least in the context of the weekly chart ( read until the end because breaking down timeframes this bias changes ).
When there is an inside candle, price usually has a false reaction and then continues toward the next extreme
Obviously, we are here to speculate and that is exactly what we are going to do, so let’s continue with our analysis to try to shed some light on the direction heading into Monday.
Let’s first go to the 6-month timeframe to get a more global context:
6-month timeframe chart of CAPITALCOM:GOLD
For intraday trading this timeframe is practically unnecessary , but it gives us a very good general context, especially at the beginning of the year .
During the previous semester price had a brutal expansion and we can clearly see how sooner rather than later it is going to take the yearly high and that it barely left us PO3.
In CRT, if a candle does not leave PO3 it can mean two things :
That it is going to liquidate the extreme to then reverse
That it is going to expand with strong momentum
Being gold, and without wanting to fall into obvious statements, it is clear that what lies ahead is more expansion.
Let’s move now to the monthly timeframe:
Monthly timeframe chart of CAPITALCOM:GOLD
On the monthly timeframe, we have an active bearish range (although if the month were to close like this, it would be invalidated), but price is getting further and further away from its target and we can anticipate that if price were to drop, it is not ready yet.
Let’s now move down to the three-week timeframe:
Three-week timeframe chart of CAPITALCOM:GOLD
On the three-week timeframe we also see a possible bearish target, but since liquidity is very tight , you already know that to be sure I like to take a look at futures:
Three-week futures timeframe chart of COMEX:GC1!
Sorry for the roughness of the image, it is only to show that this high has not actually been liquidated and therefore we do not consider the 3-week target as valid .
On the two-week timeframe we closed with the body outside and we still have this upcoming week left to close, so the direction is the high:
Two-week futures timeframe chart of COMEX:GC1!
As you may have noticed, these last images are gold futures. The direction in both assets is the same, but to be more precise in the analysis and especially with CRT, it is better to analyze futures to be certain whether an extreme has been taken or not, since in futures we have the real market data.
The direction for the coming days is becoming clearer, which I speculate will be to the upside, but let’s now move down to the weekly timeframe:
Weekly futures timeframe chart of COMEX:GC1!
On the weekly timeframe we have an active range with a target at the all-time high (in contrast to what I said at the beginning of the article) and as I already mentioned an inside candle on this week’s close, so for me the first objective is the wick of last week once price gives confirmation to the upside. As you already know, CRT traders pay special attention to Monday , expecting a possible PO3 on the weekly candle . If our BIAS is bullish, we expect price to drop first to give us optimal buys and vice versa.
Before moving down to the daily timeframe, let’s first go to the 2-day timeframe because there is something interesting we need to consider if Monday actually pulls back and closes within last week’s range:
Two-day futures timeframe chart of COMEX:GC1!
If Monday were to close inside , it would activate two bearish 2-day ranges, and then it would be reasonable to expect selling at least down to the internal range of this timeframe.
*This forces us to pay special attention to Monday’s timings for this asset
Let’s now move down to the daily chart to better define our intraday execution:
Daily futures timeframe chart of COMEX:GC1!
On the daily timeframe we see a pending range in favor of the trend that has just completed and closed inside. Here I mark my buy zone, this is not a trade I am going to execute, I simply show the image so you know where to stay alert for these buys.
These buys have a very important condition that, if not met, we should be very cautious.
Why?
Because it must reach this zone during the Asian session , since if it reaches this zone late in London or at the beginning of New York, it is very likely that there will not be enough time to break out of the previously mentioned 2-day range, which would shift our buy zone at least to this area:
Daily futures timeframe chart of COMEX:GC1!
Remember that these are not the longs I am going to execute, they are simply illustrations of the best buy zones for me.
Thank you very much for reading, I hope my analysis was useful to you and above all, so that I can keep creating this type of content, don’t forget to like the article and follow me so you get notified every time I publish one!
Many profits to everyone and have a great week!

EU sale inside of monthly consolidation, stick to short swingsThe internal range movements are the best return right now. Trying to target long runs in this internal range liquidity is very difficult right now.
Until we close outside the mother range (highlighted) on the monthly candles, it will continue to have this struggle as none of the larger traders are willing to risk huge in this range.
That will never stop us from trading 1-4H internal range orderblocks for small wins. As we see now the daily is giving good amount of days in each direction. 2026 already locked-in. It's easy 🙏🏾

UJ stuck inside of the mother candle, consolidating heavilyAs you can see the consolidation candles highlighted are holding price in a low volume state. We will need to visit the external range of these candles to gather more orders.
Until then we scalp the range of the lower time frames

Gold should be going up to hard test the new supply range aboveGoing into the new year strong with Gold as expected. Coming into the new year we are going heavy into the teaching of explanation of markups and expectations. These videos will be a bit longer. The OGs will find much of it repetitive but there are many new faces coming to the new year so we must explain what we are seeing in greater clarity.
It looks like we can begin to look for swing lows to form to go long at present. We will continue to track the progress as the week builds. We will track the lower time frame progressions in the VIP chats 💎
Don't forget to add your thoughts or point out anything I may have overlooked 🙏🏾

CRT IDEAPrice Raided the BSL then printed a down closed candle.
That candle SSL is still intact and can be the potential draw.
Im using the "middle" candle, also the candle that is likely going to be the lower swing high point as the trigger to go short once the low is reached or retested.
I picked a swing low simply for a TP area.

Gold has given a new high but has dropped back into supportNot an easy situation here on gold but the zones are pretty well defined. We are looking to see how gold treats the bearish supply recently created above the range, as well as monitor how the lows are being treated coming into the new year.
We are expecting much bullish discovery on the horizon as there is no real indication it will slow its growth curve as of yet.
Be sure to subscribe for more clear breakdowns

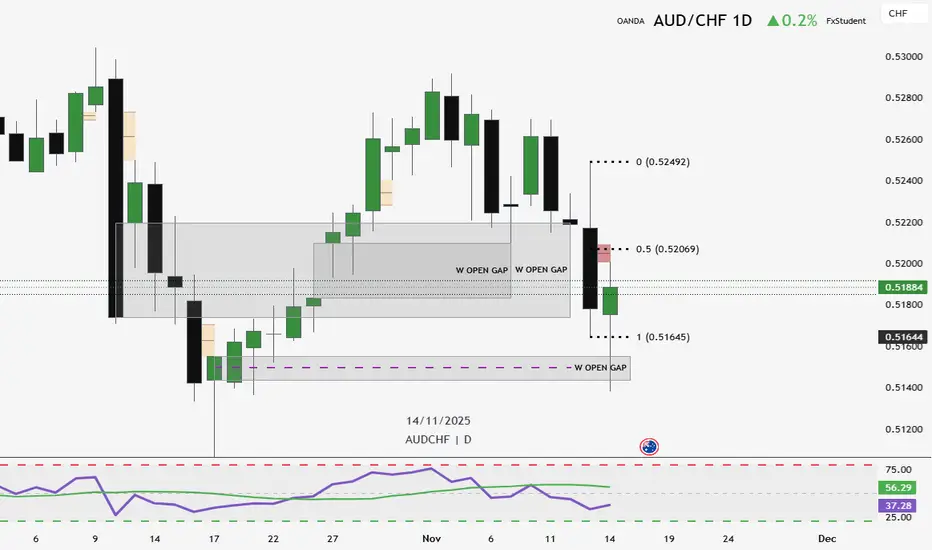
USDCAD Outlook Weekly CRT has been identified.
Expecting a Shift in Market Structure as highlighted on chart.
Quasimodo entry should be valid for retracement
If the price breaks the higher Market shift price may not react at the quasimodo entry.

Next Week EURUSD Analysis There is more htf context to this but I will keep it brief. Weekly candle rejected 1.147 area, Smt of 3month lows with GU and DXY indicating that there is divergence between correlated assets, every downside target has been met we have just opened with a new monthly candle which usually makes the low the first week aswell. And we now have a weekly crt formed meaning we can target the high of the previous week pairing liquidity pools we already had a daily change in state so I am expecting daily ob to take us higher.

Gold is still showing us it's bearish intent on the macroEasy peasy reading on the week so far. Let me know if I missed anything. I'm here for the sharing of info 💎

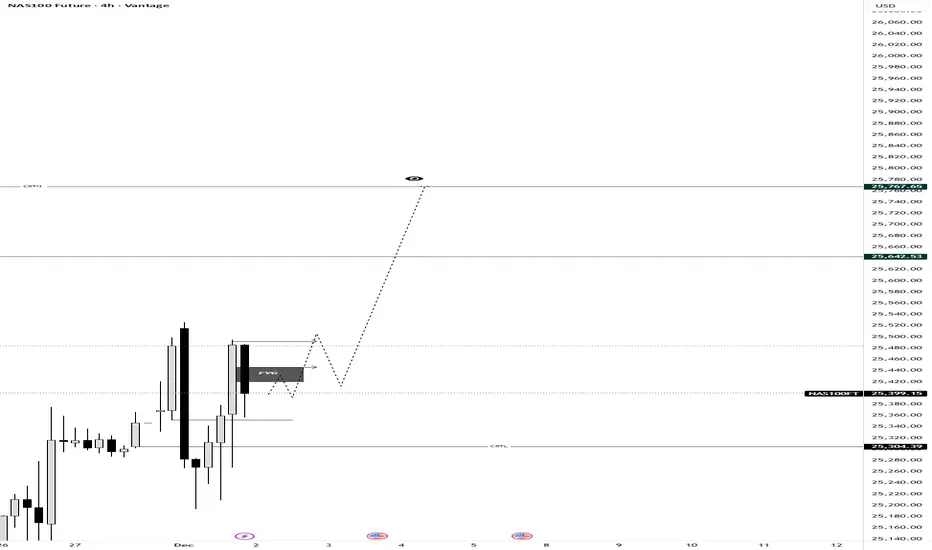
NAS100 Decoded: The Anatomy of a CRT SetupMost traders see random candles; we see a structured story. On this 4H NAS100 chart, we are witnessing a textbook example of Candle Range Theory (CRT) in motion.
If you understand the "Three-Phase Engine" inside every candle, the next move becomes clear.
The 3-Step Logic Behind This Setup:
The Purge (Accumulation): Notice how price dipped to sweep the CRTL (Candle Range Theory Low). This wasn't a random breakdown; it was a Purge Phase designed to grab liquidity and trap retail shorts. By sweeping the low (PL), the market collects the necessary fuel for the reversal.
The Mitigation (The Current Trap): Price has reclaimed the range and is currently mitigating within the FVG (Fair Value Gap). In CRT, this is the Mitigation Phase, where price returns to balance or "Equilibrium" (EQ) to fill imbalances before the real move begins. This phase often confuses traders, but it is simply smart money rebalancing positions.
The Expansion (The Delivery): With the internal liquidity harvested and the imbalance filled, the logic dictates a move toward the CRTH (Candle Range Theory High). This is our Expansion Phase, targeting the "Expansion Level" (EL). The "eye" icon on the chart represents the Draw on Liquidity (DOL)—the magnetic attraction pulling price toward the liquidity pools resting above the highs.
💡 The Lesson: Don't chase the red candles during the purge. Wait for the mitigation. As the theory states:
"The Purge phase creates the opportunity, the Mitigation phase provides the entry, and the Expansion phase delivers the profit".
Are you watching this FVG hold, or are you waiting for a break of structure confirmation? Let me know in the comments! 👇
Greetings,
MrYounity
AUDUSD — CLS Daily vs 1H Chart AUDUSD — Daily vs 1H Chart 📈
Price has purged into a key level on both the Weekly and Daily timeframes, then formed a CLS range on the Daily chart.
Once price pulls back into the Daily Gap on the 1H, I’ll look to go long toward the Daily 50% level.
🎯 Target → 0.64695
OANDA:AUDUSD

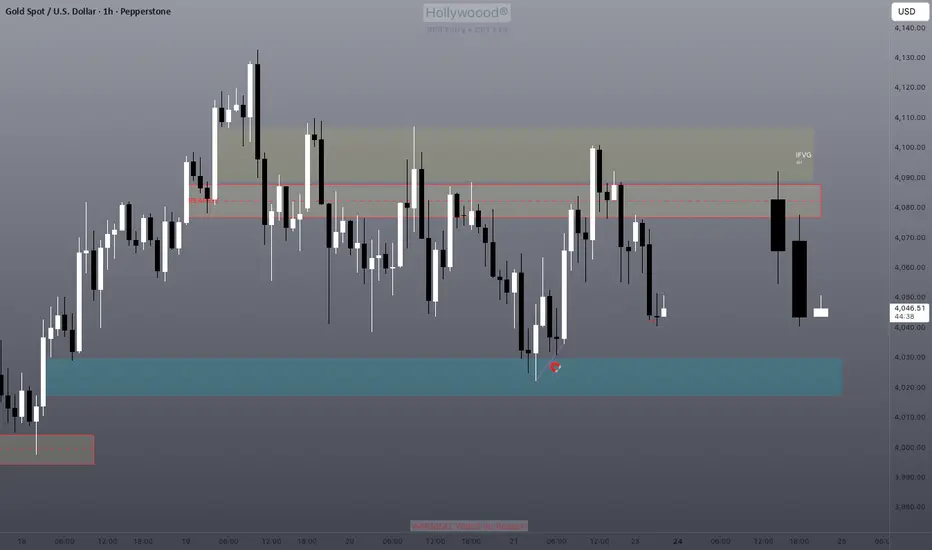
Imbalance below range seems to be the current targetBlue zone is the bullish imbalance that was left behind last week.
Price only targets lows or imbalances below support during sell-offs. Let's see what we get with this one.
[CRT] Early-Week Outlook for EURUSD [Candle Range Theory]Context:
During the week of November 10th, the European currencies EURUSD and GBPUSD attempted to attack their previous weekly high on Friday afternoon, so we speculated that the direction for the week of November 17th would be bearish, targeting the low of the week of November 3rd.
Last week this hypothesis was confirmed, with the weekly candle closing outside the body of the previous one:
For this week:
This week the same thing has happened but in the opposite direction. However, this time it’s different because the move failed while going in the direction of the bias, so we anticipate a bullish start to the week in order to position for new sells:
Although from a CRT perspective, if we drop to the daily timeframe, the range would be invalidated. DXY and GBPUSD do give us directional clues for a small retracement at the start of the week:
Here we can observe DXY:
And here GBPUSD:
Even though we have clearly defined upside targets on GBP and downside targets on DXY, we must not forget that it is very likely they will not be fully completed, since the broader direction for European currencies remains bearish continuation.
So in conclusion, we speculate with more cautious, lower-risk buys at the start of the week, since it makes sense for price to begin by pushing upward — not to shift the overall bias, but to complete the PO3 of the weekly candle. Once that weekly PO3 is formed, we will then look to join the sells when direction realigns with the broader bearish continuation.
Wishing everyone many profits!

Stock market will test yearly levels below current supportAs the yearly candle closes and the new one opens, there is an orderflow pattern that is well developed. This will play out again as always 💎

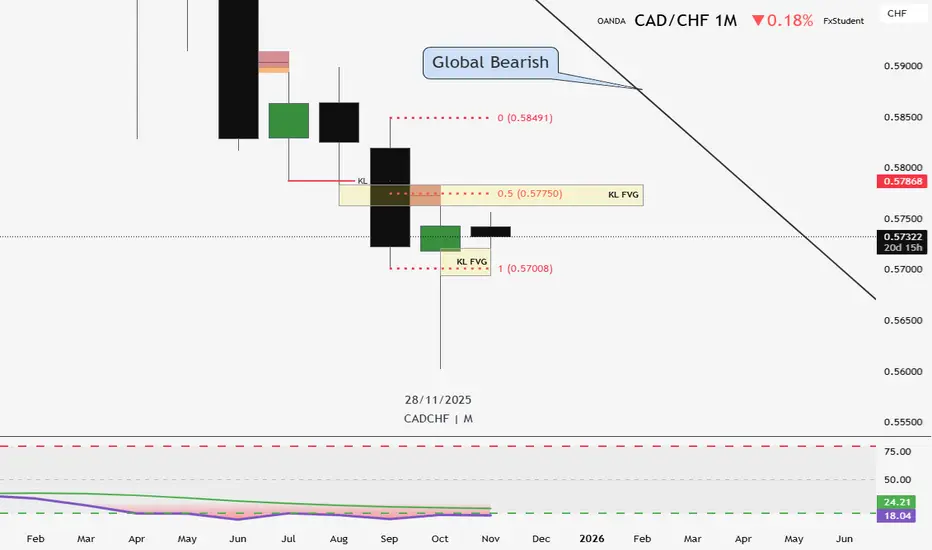
CLS CADCHF Analysis – Monthly, Daily, 1H📊 CLS CADCHF Analysis – Monthly, Daily, 1H
**Monthly (M):**
- A Clean Low Sweep (CLS) has been formed.
- The second candle is already confirmed.
**Daily (D):**
- Price has not yet reached the 50% retracement level.
- A Daily CLS has been formed.
- The second candle is currently developing.
**1-Hour (1H):**
- Market Structure Shift (MSS) has occurred.
- Price has already reached the 50% level.
**Trade Plan:**
- I’m waiting for price to retrace into the 61%–80% zone of 1H CLS before entering a long position.
- Target 1 (TP1): The 1H CLS range.
- Target 2 (TP2): 50% of the Monthly CLS, which aligns with a Key Level Fair Value Gap (KL FVG) and Key Level Previous Monthly Low (KL PML).
**Order Flow:**
- Currently bearish, so the ultimate goal is a conservative 50% retracement from the Monthly CLS.
OANDA:CADCHF
Mentor :
@David_Perk
US100 (NASDAQ) — Daily CLS RangeUS100 (NASDAQ) — Daily CLS Range
Daily CLS ,
2nd candle is now complete, establishing the range.
On the 1H chart, a pullback into the BPR zone would provide a high-probability entry, supported by strong confluence at this level.
Target: Daily 50% midpoint at 25,287.6

US30 - CLS Monthly vs Daily US30
Monthly CLS Range ,
2nd candle is forming
On the Daily timeframe, if price pulls back, a potential entry lies at the BPR zone, which acts as a strong confluence area.
🎯 Target: 50% level → 46,639.6
Mentor :
@David_Perk

GOLD (XAUUSD) - Weekly CLS GOLD (XAUUSD)
On Weekly CLS & an additional 4H CLS nested inside the Weekly range.
On the 4H timeframe, the BPR zone might act as a strong confluence area and may serve as a resistance zone.
🎯 Target: 4189.570

Gold may seek higher imbalances on the sessionWe have reached the previous forecast goal. Today is a much more convoluted range. It seems we can be bullish here but the resistance just above should be the target and no more.

Gold still in it's year-end range, good scalping opportunitiesThis year's high is in, the same forecast as last year if you watched with me this time last December.
We can expect that the new year candle will target the previous high quickly and swiftly as always, but until then we scalp this year-end wick range using LTF OB/FVGs for minimal pip TPs
