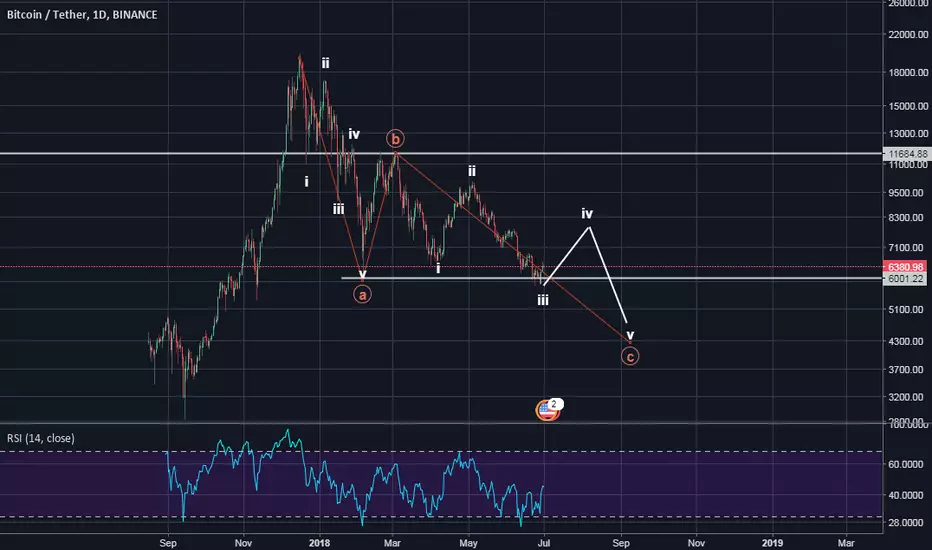
BTC/USD to dip lower?Fellow investors,
For the past couple weeks we were paying close attention to a potential Inverse Head & Shoulders pattern formation.
We'll know within this week whether there will be an elongated right shoulder or failure in the pattern formation.
However, with the low volume and current regression trend, I think it's unlikely that the shape will form. In other words, there's a higher chance that the price will go downwards.
I think the best position at this point is neutrality because we really don't know what's going to happen.
For now, I highly suggest investors to pay close attention to the market movement for the next couple days to see if there's a clear position and an entry point.
But if you are going to enter,
Long position: $4200
Short position: $3550
Cryoptocurrency

[ETHUSD] $75 Target Short - Descending Triangle UPDATEI have updated my most recently published analysis of ETH price movements.
The descending triangle pattern is still valid and these most recent pumps have added further data points to confirm this trend. The 100 ema appears to be nearly impossible resistance for the bulls.
Shorts at the 100 ema or the upperbound of the triangle have great potential.
Targeting entries above 91, I got lucky and caught a few sell orders at 95+ which are doing well right now.
We can also see a bearish MACD cross incoming, a bearish Stoch RSI cross and a relatively high RSI overall.
It is also important to keep in mind that we are still in a long-term downtrend which the bulls have not been able to break for months. A descending triangle breakout would mark another continuation of this downtrend. If we break through the lower bound we could expect to see ETH hit $75 at a minimum. The slightly opaque box represents the last line of support ETH currently has (this extends back to May 2017 levels).
A break through that box would not be good for ETH.
**This is for educational purposes only, you are responsible for your own investment activities**
Happy trading mates!


BTC/USD Break & Retest Market Break and Retest, BTC has reversed priced and now heading to the upside. Before Bullish momentum is established we will see a market retest. Testing $4,000


LTCUSD Technical Analysis 4 hour - Patience, no clear buy yetHi there.
Current state:
Out - We have USD in hand. Movement has been mostly lateral. You can see this in the yellow highlighted area.
Patience . A good trader is a patient trader . If there is no clear buy opportunity then we are not trading we are gambling our money.
Indicators/Charts analysis:
Price went above our early alarm warning ($42.87) but could not keep with momentum and came back down. This means there is not a lot of buyers out there thinking that price will continue to go up. At least not yet and I am of course not one of them.
RSI is in the oversold area but and still trending down. This signals the possibility of further price drops.
Stoch RSI in overbought. This is interesting because it does not align with regular RSI. This is a red flag indicating we have to watch out for price action to the down side.
Bollinger bands are narrowing. This signals that volatility has been low, hence the lateral move in price. Remember it is harder to make money in a stable market. Volatility is our friend.
Parabolic SAR switch from uptrend to down trend. This is due to the last price drop from $42.87 to currently $41.78. This does not help the case for an up trend.
Awesome indicator nearing 0. This combined with the bollinger bands narrowing could imply a possible move to the up direction. Keep an eye for this.
EMAs not even close to cross in the up trend. This further supports a continuation to the down trend. However they are moving almost horizontally. This is due to the consolidation in price. Remember that after prices consolidate, they move again in one direction or another.
Renko (0.74 brick size) still shows a down trend. However no new bricks. This further confirms horizontal price action.
Stop Loss:
$43.78 - This is our possible entry point still.
Note: You can see why the stop loss is placed at least 2 renko bricks up. If it would have been closer, it would have triggered when the price reached $42.87 earlier today but no real trend was forming
Target:
$48.40 (+10.6 %) - Target is chosen based on current price volume profile. This of course also aligns with the red candle of 14 Nov.
Alarms:
$42.87 - We will keep this alarm here for now.
Conclusion:
Hold. No clear buy setup is currently available. Again, we are trading not gambling. This means we need a clear buy setup before we enter a trade.
------------------------------------------------------------------------------------------------------------------------------------------------------------------------------------
If you like this, you can donate LTC to:
LZKza6vBcBnkfaDMHYXXUd6ud8Jf87Lfm3
Any donations will help me keep posting analysis. Also, don't forget to share your comments!
------------------------------------------------------------------------------------------------------------------------------------------------------------------------------------
***This information is not a recommendation to buy or sell. It is to be used for educational purposes only.**


SYS LOAD FUEL OILSYSBTC
As you see price hit the stop loss and bounce back grab for trader's money.
Finish line and stop loss on the chart.
Play safe GooD LucK
;)

BTC about to blowYes i'm out of bare hibernation mode and turning bullish again. I think BTC 0.08% is finally about to move up. RSI moving up and MACD starting to curl upwards.
Targets are the arrows and fib levels.

XRPUSD 1H EFC TRADING STRATEGYEFC Indicator finds fractal reversal trades
Entry - TP - SL are all listed on the chart
If you have any questions PM me and I will be glad tp help.

A Whale Just Accumulating $WAVES / $BTC ! Should You Follow?WAVES is just one of my favorite big cap, because it's no doubt having a good fundamental and it's quite cheaper and easier to create token on WAVES network. As it ranked #41 right now with only 100 millions circulating supply. Quite reasonable.
I see big volume buying WAVES right now on Binance as I can measure that WAVES already meet the bottom line of line. This kind volume mostly from an institution such hedge fund or investment bank which normally don't really like the volatility and love something that quite "stable" but don't want to affect the price as they are accumulating. This is quite general strategy of them, but at some point they just can't hide it all along because, some indicators, even basic indicators can caught them. Sometimes.
I believe that WAVES just like Stellar Lumens and some other project has been on the list of this this hedge fund / institutions / whale club portfolio list. And because of that, you should doubting the fundamental of WAVES anymore because it's ultimately legit right now, all you need to consider is: are you entering at the right time and the right price. Which by any means, I encourage you to follow this movement. Just follow the trend, they know what will happen in the next few months. Book you seat!

XRP buy setup!Hello my Crypto friends, BITFINEX:XRPUSD seems to be consolidating here. So buying this breakout is a really good idea.
So keep an eye on it, be patient & trade with care!
If you like what i do click that like & follow button.
Likes and followers motivate me to spend my free time posting content for you!
Thank you for your support! :)
Look at my previous XRPUSD analysis!!

BigBear BTC / GranOso BTCIt's my little contribution, you can destroy it if you think it's necessary.
-----------
Es mi pequeña contribución, puedes destruirla si crees que es necesario.

A big drop in bitcoin IncomingIt took me a while to figure out what was going on in this case, as most patterns did not fit the volume identity to be confirmed as a pattern, even this one on the daily does not have strong confirmation from volume , and if we are looking for just patterns, I can find a multitude of patterns, within the same setting, and we are suppose to look at volume for confirmation, and after the last possible continuation pattern, which I stated was NOT confirmed by volume , ended up failing I decided to take a breather from posting, I pulled out of my trades, and took a second to take a look at what is happening, and as a trader, I always like to post ideas on the macro picture, so I understand my trades on the micro end. And I do like to come up with ideas for both the bullish and the bearish and sometimes sideways movement. Here are my ideas:
1.) The continuation inverse head and shoulder, failed which did not surprise me, however it was attempted and I was expecting a movement downwards, but not this strong.
2.) There are two patterns that I can strongly identify, a bullish symmetrical triangle, and another head and shoulder top.
The head and shoulder top(In purple, neckline and shoulders):
My case for it:
The volume on the 4 hour time frame does more to confirm it, and right now selling is strong, much stronger than the buying. Bitcoin -2.19%fell through the support of the large symmetrical triangle (orange line) that used to be its support for the second time. I doubt bitcoin -2.19%and the bulls have the strength to cross it once more, and for this reason, I do believe that an ascending triangle will be made it before another drop with the neckline as a support and the top of the ascending triangle as resistance. If the ascending triangle occurs, it will be enough to confirm the topping pattern. Currently, the resistance of the symmetrical triangle (yellow line) is providing strong support, However, I do believe that bitcoin -2.19%will re-enter this trendline and continue on the same downtrend as before. In addition, the market cap of crypto continues to trend downwards, which makes me believe that the down trend is not over.
My case against it:
The volume on the daily does not confirm it, and the uptrend would be short considering the inverse head and shoulder took nearly 2 months for it to complete, and considering that all things should be relative in respect to time and volatility, I feel like because of the duration and the volatility of that inverse head and shoulder warrants a more moves to the upside, however, there have been moments where something shows and inverse head and shoulder, hits its target and then continues its downtrend. It is possible that this is the case here. The slope of the neckline is really sloped upwards roughly 45 degrees and there is still a good amount of buy pressure.
Head and shoulder itself:
The neckline has an upward sloping angle which just means that it is a normal topping head and shoulder pattern and it does not exactly read into whether the next trend will be bullish, the two other shoulders are much smaller and they are complex shoulders, meaning that they have multiple dips or double shoulders. As for the left shoulder, it should exhibit the same properties as the right shoulder. Its price objective, is roughly 6500 if it can break through the neckline.
The Symmetrical triangle(It is composed of the light blue and the purple neckline):
My case for it:
Right now, on the daily, the volume matches the symmetrical triangle better than the inverse head and shoulder, where the left side has the most volume and then volume is slowly diminishing as the support and resistance lines approaches the apex. The buy volume is still strong especially as the price moves downwards, the bulls and the bears and definitely fighting it out and they have been for a while now. The bulls are not giving this success up without a fight.
My Case against it:
If its valid, it can break both directions.

A trading opportunity to buy in XVGETHTechnical analysis:
. VERGE/ETHEREUM is in a range bound and the beginning of uptrend is expected.
. The price is above the 21-Day WEMA which acts as a dynamic support.
. The RSI is at 59.
Trading suggestion:
. We opened 8 BUY trade(s) @ 0.00005311 (day close price) based on a reversal candle ( Valley ) at 07.30.2018
. Price is in the support zone (0.0000560 to 0.0000482), traders can set orders based on Daily-Trading-Opportunities and expect to reach short-term targets.
Beginning of entry zone (0.0000560)
Ending of entry zone (0.0000482)
Entry signal:
Signal to enter the market occurs when the price comes to "Buy zone" then forms one of the reversal patterns, whether "Bullish Engulfing" , "Hammer" or "Valley" in other words,
NO entry signal when the price comes to the zone BUT after any of the reversal patterns is formed in the zone.
To learn more about "Entry signal" and the special version of our "Price Action" strategy FOLLOW our lessons:
Take Profits:
TP1= @ 0.0000625
TP2= @ 0.0000700
TP3= @ 0.0000796
TP4= @ 0.0000968
TP5= @ 0.0001186
TP6= @ 0.0001453
TP7= @ 0.0002030
TP8= Free

BTCUSD Possible reversal zone!BTCUSD currently moving on the downtrend channel if it couldn't break that channel it can go back down breaking that support level at 7727 towards its next support level at 6864 .

XRPUSD 4H RANGE SHORT TRADEPrice is below 50 sma
Price is falling to bottom of range
Find an entry point on a 5m/15m chart from a pull back
Take Profit at bottom of range
Find a SL that fits your risk/reward
Macd is falling and has wide space between lines

TRX/BTC 2.618 Set upa potential 2.618 setup for TRX/BTC, estimate 55% profit, take it or leave it? what do u think?

Inverse H&S? Usually when everyone expects the same thing.....?Usually when the whole world expects one thing, it doesn't always materialize. Often a variant of it or something quite different.

The Boom was Great! Now What? - Pissible ETHEUR Reversal Road!Hey there,
So, a few days after the Reversal, i've been studying what's the next step on the bullish run. This time i decided to give it a try on ETHEUR, since i found it more clear to see.
If tomorrow morning the candles goes as i suggest, and the next big bang happens as i marked, it will be confirmed the present of Bearish Expanding Triangle Pattern (Lilac Color).
You can check how the ABC are almost the same but in bigger scale. So i measured everything and put it together on every next scale. If it is so, be aware on the downs :P
As usual, this is just an idea, what i see on the charts, on my free time as a hobby. The market is on constantly change, never forget that.
I hope this info could be helpful.
Cheers, and have fun! :)

Bitcoin long entry ideaHello Crypto traders,
This is my idea on how I will be interested to enter BTC/USD on a long position
I'm only risking 5% on my stop loss, please trade carefully and understand this is a market that will take everything if you let it.
Honor the Stoploss and risk what you are willing to put at risk.
I've studied many markets that had similar situations as BTC/USD is at and this is what would make me interested.
Without the confirmation move the idea is invalid, if we reach the confirmation level the the I'll buy as stated on the chart.
Good luck :)
The moon is at 12k not 1 million.

My count on EOSIm expecting EOS to hit red OB because bitcoin will pump to 6705-6750 range and EOS is going to hit the Red OB as well