
ETHEUR Rainy SummerHi Traders!
so far so good ETHEUR
Now we seem to have a little problem though!!
we have a good resistance at about 1600..
if we keep it we will go up if not we will see lower numbers.
but in the long term we will see quite large numbers!!
huge caution with the SL AND TP
be very careful with

My Approach to MEME TradingHi!
If you are even little bit interested in Crypto then you probably have noticed all the buzz and excitement around MEME token launch (especially in Crypto Twitter, now X). Looks like they are stealing all the spotlight with their upcoming Binance listing which should happen tomorrow( Nov 3rd).

ETH Holds the LineThe ETH/EURO Chart is holding at an interesting level
- 200 Week SMA holding
- POC holding also
An ascending triangle or cliff edge? What do you think?


Ethereum RidingHabibi , how are you Guyz ??
today a small scalp in Ethereum....comment your thought habibi
Win or Loose

ETHERIUM / EURO ANALYSIS (TRENDLINE'S)ETHEREUM / EURO has been moving from high to low making a downtrend and a bunch of candles made stronger support and resistance.
This analysis is made only by the TRENDLINE and SUPPORT AND RESISTANCE strategies only
This chart strategy just simply implies that it could go in 3 ways depending upon

Bitcoin devil - COPY BOT / EUR base currency / ETH/EUR=== Time window ===
01 / 01 /2022 - 23 /11/2022
=== Example settings ===
Initial capital = 5000 EUR
Stop loss = 5%
Trailing percentage = average amplitude of weekly price movement
Arm Trailing = standard deviation of amplitude
sell based on strategy = Disabled
DCA = Disabled
Cool down = 1

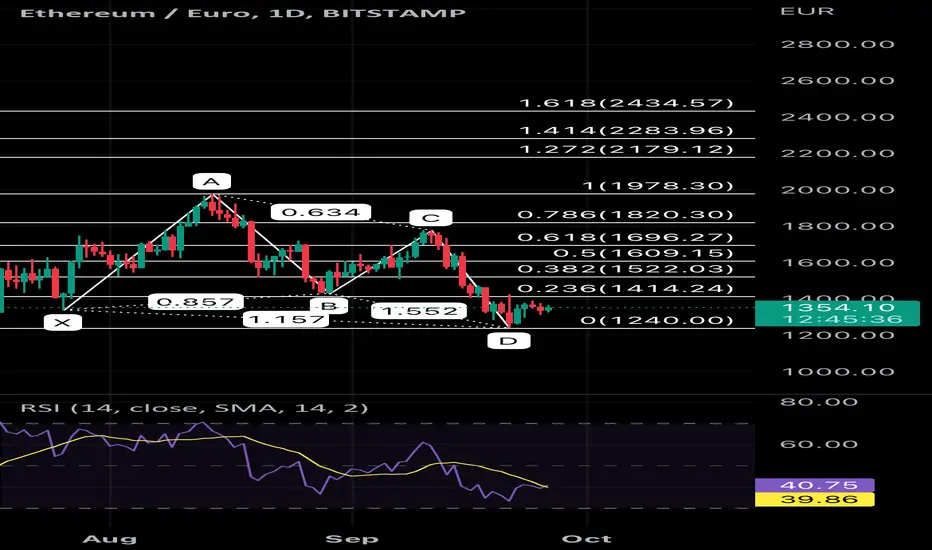
Daily ETHEUR analysisButterfly pattern is available on daily chart, Check the fibo levels for clear vision.
Short opportunity for ETH in the next few days? My thoughts on a possible short position for the next few days.

See all ideas