XRP / USDT — Daily Update (Follow-up)Price continued the downtrend after failing to reclaim the prior breakdown level and has now tapped the lower support zone.
The large wick from the previous move has been fully filled, meaning downside liquidity has been taken.
Current situation
Major support: ~1.25 – 1.35
Reclaim level: ~2.00
Higher resistance: ~3.00
Structure: bearish channel still intact
What this means
The market reached a reaction area where bounces normally occur.
However, as long as price trades below 2.00, the overall structure remains weak and any upside is corrective.
Simple plan
Hold 1.25–1.35 → relief bounce possible
Reclaim 2.00 → short-term strength returns
Break below support → continuation lower likely
Right now this looks like a reaction zone, not a confirmed reversal.
Do you expect XRP to stabilize here or sweep the lows first?
MrC
Crypto

Chainlink: bounce or break? key levels to watch aheadChainlink. Who’s trying to catch this falling knife and actually grab the handle? After the latest risk‑off wave in crypto, LINK got hammered as traders rotated out of DeFi names, and according to market chatter funding flipped heavily negative and sentiment went full doom mode.
On the 4H chart we’re in a clean downtrend, but the last leg looks like a selling climax: long lower wick, big volume, RSI stuck in oversold around 25. Price is sitting below a fat volume node around 8.8–9.0 that used to be support and now looks like the first serious supply zone. So my base case is a relief bounce into that 8.8–9.5 pocket before bears decide what’s next.
✅ Plan: I’m only interested in a counter‑trend long if price holds above 8.0 and starts building a small base, with targets 8.8 then 9.5. ⚠️ If 8.0 gives way on strong volume, I expect a slide toward 7.2–7.0 where the next demand cluster sits. I might be wrong, but shorting straight into an exhausted dump has rarely been a profitable hobby for me.

[BTCUSDT] Bearish Bias · Techincals → ICT ConceptsFundamental Point of View:
We just had neutral data for FOMC.
We might get a strong nfp for usd.
Technical Point of view
We have a strong Resistance of 8100 If it stays strong we can see a little bearish pressure till 71k.
Better Sells are after a retest of POI.
setup fails if we break POI and break a new higher high in a small Time Frame like 1H or 15m.
**Key notes to keep in mind:**
1. BTC is already in a bearish trend.
2. we have broken a 4H Low which is the POI now and might get retested times before playing the sell move again.
3. we can look for 57K in this week or next week
**Current Market Overview:**
Technically we have broken our last Low and its now a point of interest for sellers.
Fundamentally we are bearish as we dont
lets take a look at different Time frames
**1Week TF:**
We have a strong POI for sellers at 72k If price touches it and stays strong we can see a little bearish pressure till 57k.
Better Sells are after a retest of POI.
setup fails if we break POI and break a new higher high in a small Time Frame like 1H or 15m.
**1D TF:**
We have POI close which will be triggered today for sellls. and sell side liquidity might taken out.
**4H TF:**
keeping eye on the candle breaks we have clean range on the left side.
**1H TF:**
we are currently at no trading zone but will see reaction when it starts moving
**Overall Scenario:**
we are looking for Sells only if we are respecting the 4H POI and breaking Sell side liquidity is another opportunity to trade.
**How will setup fail?**
simple if 4H Poi is broken and a small higher high breaks in 15 min or 1H.

TOTAL Market Cap — Weekly UpdateThe market delivered a strong downside displacement and fully mitigated the weekly orderblock that originated after the US election rally.
That means the entire prior expansion move has now been neutralized and liquidity below the range has been taken.
Price is currently reacting from the next higher timeframe demand zone.
Current situation
Upper weekly OB: taken & mitigated
Price swept sellside liquidity
Reaction from lower weekly demand
Large imbalance left above price
What this means
After a vertical move down, markets usually don’t instantly reverse.
They first stabilize.
So this area is a reaction zone — not yet confirmation of a new uptrend.
As long as price stays below the broken range, market structure remains weak.
Only reclaiming higher levels would indicate strength returning.
Simple plan
Hold current demand → stabilization phase
Reclaim prior range → recovery structure
Fail demand → continuation lower
Right now the market is transitioning, not trending.
Do you expect consolidation here or another expansion leg first?
MrC

BTCUSDT Short: Sellers in Control - Next Stop $69,000 SupportHello traders! Here’s a clear technical breakdown of BTCUSDT (3H) based on the current chart structure. BTC previously traded within a well-defined consolidation range, where price moved sideways for an extended period, indicating market balance and accumulation. This ranging phase eventually resolved to the upside, leading to a strong impulsive rally. The bullish expansion culminated at a clear pivot high, where buying momentum began to fade and profit-taking emerged. From this pivot point, market structure shifted, and BTC transitioned into a descending channel, characterized by consistent lower highs and lower lows. Price respected the channel boundaries well, confirming controlled bearish pressure rather than a disorderly sell-off.
Currently, BTC has broken below a key Supply Zone around 73,500–74,000, which previously acted as strong resistance. This breakdown confirms a bearish continuation scenario rather than a temporary pullback. Price briefly attempted to reclaim this zone but failed, suggesting acceptance below former resistance. Below current price, the Demand Zone around 69,000 stands out as the next major area of interest. This level represents a strong historical demand area and a potential zone for buyers to step in.
My primary scenario favors further downside continuation as long as BTC remains below the descending supply line and the broken supply zone. Any pullback toward the supply line or the 73,500 area is viewed as a corrective retest and a potential short opportunity rather than a bullish reversal. The main downside objective remains the 69,000 Demand Zone (TP1), where partial profits can be considered and where a stronger reaction is likely. If price reaches this demand area, market reaction will be critical in determining whether BTC forms a base for a bounce or continues lower. However, a strong reclaim and acceptance back above the supply zone and the descending supply line would invalidate the bearish scenario and signal a potential trend shift. Until that happens, structure, trend, and price behavior continue to favor sellers, with downside pressure dominating the current market phase. Manage your risk!

SOL / USDT — Daily Update (Follow-up)After rejecting the prior resistance zone, price accelerated down and tapped the next higher timeframe support area.
The previous range support failed and turned into resistance — confirming continuation pressure.
Current situation
Major support: ~70 – 80
Resistance: ~125
Major S/R flip: ~140 – 145
Structure: bearish continuation after breakdown
What this means
The market moved from distribution into a displacement phase.
Now price is testing a historical demand zone where reactions normally happen.
This is where either:
A relief rally starts
Or the downtrend expands
Simple plan
Hold 70–80 → bounce toward 125 possible
Reclaim 125 → short-term strength returns
Reclaim 140+ → structure improvement
Lose 70 → continuation lower
Currently price is reacting, not reversing.
Do you expect SOL to form a base here or continue trending down?
MrC

DOGE / USDT — Weekly AnalysisFirst time covering DOGE on the higher timeframe.
On the weekly chart price returned to a major historical level after filling the large downside wick — meaning long-term liquidity has been taken.
Structure overview
Major support: ~0.08 – 0.10
Weekly resistance: ~0.14
Major S/R flip: ~0.20
Market structure: macro range after long distribution
What this means
This area has historically been where accumulation starts, not where trends end.
However — holding the level is required first.
Right now price is sitting at decision support:
Hold → multi-week base possible
Lose → continuation into deeper range lows
Market logic
Higher timeframe levels react slower.
So expect consolidation first before any strong move.
Simple plan
Above 0.10 → basing phase
Reclaim 0.14 → bullish momentum returns
Reclaim 0.20 → trend shift on weekly
Lose 0.08 → bearish continuation
This is not a breakout zone — this is a positioning zone.
Do you think DOGE is entering accumulation or preparing another capitulation?
MrC

EURUSD: Buyers Defend 1.1780 - Upside in Focus 1.1870Hello everyone, here is my breakdown of the current EURUSD setup.
Market Analysis
EURUSD was previously trading within a well-defined downward channel, where price consistently respected the descending resistance and support boundaries, forming a series of lower highs and lower lows. This structure confirmed sustained bearish control and orderly downside continuation. During this phase, several bearish pushes developed smoothly within the channel, highlighting strong seller dominance. After breaking the channel, EURUSD continued higher and successfully reclaimed the Support Zone around 1.1780, which acted as a key decision level. The breakout and subsequent hold above this zone confirmed a change from bearish structure into a bullish recovery phase. Price then accelerated toward the 1.1870 Resistance Zone, where supply became active again, resulting in consolidation and multiple breakout attempts.
Currently, price is trading above the rising trend line, while also forming a descending corrective structure beneath the triangle resistance line. Despite the pullback, the market continues to respect higher lows, suggesting that the recent decline is corrective rather than impulsively bearish. The ability of EURUSD to hold above the support zone keeps the bullish structure intact.
My Scenario & Strategy
My primary scenario favors a long continuation as long as EURUSD holds above the 1.1780 Support Zone and respects the rising trend line. The current consolidation appears to be a corrective pause within a broader bullish structure. A successful break and acceptance above the triangle resistance and the 1.1870 Resistance Zone would likely trigger renewed upside momentum. If buyers manage to reclaim and hold above resistance, the next bullish leg could extend higher, following the direction of the dominant trend.
However, a decisive breakdown below the support zone and trend line would weaken the bullish scenario and signal a potential deeper correction or range formation. For now, structure favors buyers, with pullbacks viewed as opportunities for continuation rather than trend reversal. EURUSD remains at a key technical decision area, and price reaction around support will be critical for the next move.
That’s the setup I’m tracking. Thank you for your attention, and always manage your risk.

LINK / USDT — Daily Update (Follow-up)Price continued the downside after the previous update and tapped the lower liquidity zone.
The large wick has now been **fully filled**, meaning the market removed the imbalance and reached a reaction area.
Current situation
Local support: ~7.5 – 8.2
Reclaim level: ~12.2
Major S/R flip: ~18
Structure still bearish (lower highs & lower lows)
What this means
Right now this is a classic decision point:
After liquidity is taken, the market either bases → relief rally, or continues the macro downtrend.
Holding the current level could start a short-term recovery.
But without reclaiming 12.2, it remains only a bounce inside a bearish structure.
Simple plan
Hold 7.5–8.2 → relief move possible
Reclaim 12.2 → market strength returning
Fail to hold → continuation lower likely
So far this looks like a reaction, not a confirmed reversal.
Do you expect a bounce back into resistance or another sweep below support first?
MrC

RENDER / USDT — Daily UpdateAfter the strong impulse move up, price has now retraced and filled all imbalance (FVG) zones created during the rally.
This usually means the market finished correcting inefficient price action and is moving back into equilibrium.
Current situation
Major support: ~1.20 – 1.30
All bullish FVGs below price → filled
Momentum cooled down after distribution at highs
What this means
With imbalances cleared, the chart is no longer in a forced correction phase.
Now the level itself matters:
If support holds → accumulation range likely
If support breaks → continuation of the macro downtrend
Simple plan
Hold above 1.20 → base formation possible → recovery when market strength returns
Lose 1.20 → next liquidity sits lower → bearish continuation
First bullish confirmation → reclaim prior breakdown area (~1.60 zone)
Right now this is a reaction zone, not yet a reversal.
Do you expect buyers to defend this level or will liquidity below get taken first?
MrC

ENA / USDT — Daily Update (Follow-up)Price kept respecting the bearish structure after the previous update.
The rejection at the trendline confirmed sellers are still in control and the market moved back into the lower range.
Current situation
Local support: 0.095 – 0.115
Mid level to reclaim: 0.131
Key S/R flip: ~0.20
Still trading below descending trendline → bearish pressure remains
What this means
Holding below 0.131 keeps the chart weak → continuation range / grind down likely.
A reclaim of 0.131 opens room for a relief move into 0.20 S/R flip area.
Only above 0.20 the structure actually starts improving.
Simple plan
Below 0.131 → bearish / ranging
Reclaim 0.131 → bounce potential
Reclaim 0.20 → trend shift signal
Market now deciding between accumulation at lows or continuation.
MrC

#EURUSD , Time to Fly?📊 Morning Market Brief | London Session Prep
🔎 Instrument Focus: #EURUSD
⚠️ Risk Environment: High
📈 Technical Overview:
Not a Quality setup at all but with a valid structure we can have it as QuickScalp
🚀 Trading Plan:
• Need Valid momentum Structure Close
• LTF ENTRY NEEDED ‼️
• Just and Only for QuickScalp
🧠 Stay updated with real time news and macro events, visit 👉 @News_Ash_TheTrader_Bot
** Please LIKE 👍, FOLLOW ✅, SHARE 🙌 and COMMENT ✍ if you enjoy this idea! Also share your ideas and charts in the comments section below! This is best way to keep it relevant, support us, keep the content here free and allow the idea to reach as many people as possible. **
#Ash_TheTrader #Forex #EURUSD #MarketInsight #PriceAction #TradingPlan #RiskManagement #LondonSession #Scalping #Futures #NQ #Gold

WLDUSDT.P:short setup from daily support at 0.3640SETUP SUMMARY
Regarding BINANCE:WLDUSDT.P : after a strong drop, the asset has been consolidating for 5 days. Typically, if an asset comes from above and enters consolidation, it will continue in the same direction — downwards.
This move is reinforced by the fact that BINANCE:BTCUSDT.P is dropping heavily today, dragging the entire market with it. BINANCE:WLDUSDT.P could indeed break the level today, even though it has already moved quite a lot relative to its average statistics.
We are currently seeing a pre-breakout base forming right at the level. If volatility decreases even further, it will be an ideal entry point, as it will allow for placing a tight stop loss.
PRO-THESIS FACTORS:
trend alignment
liquidity vacuum beyond level
market correlation
volatility contraction on approach
prolonged consolidation
lack of rejection after false break ADVERSE FACTORS:
high-volatility approach
no near-level base Leave your thoughts on the setup in the comments. Follow this profile to monitor all upcoming ideas.

EURNZD – 1H Chart Targets...EURNZD – 1H Chart Targets 📊
Based on my chart (trendline break + strong bullish impulse + pullback zone):
🔍 Market Bias
Bullish continuation (buy on pullback)
📈 Buy Setup
Buy Zone:
1.9650 – 1.9700 (highlighted demand + cloud support)
Targets:
🎯 TP1: 1.9850
🎯 TP2: 1.9900
🎯 TP3 (Final): 1.9950 ✅ (marked target zone)
Stop Loss:
🛑 Below 1.9580
⚠️ Trade Notes
Previous downtrend already broken
Healthy pullback expected before next push up
Partial profit booking recommended at TP1 & TP2

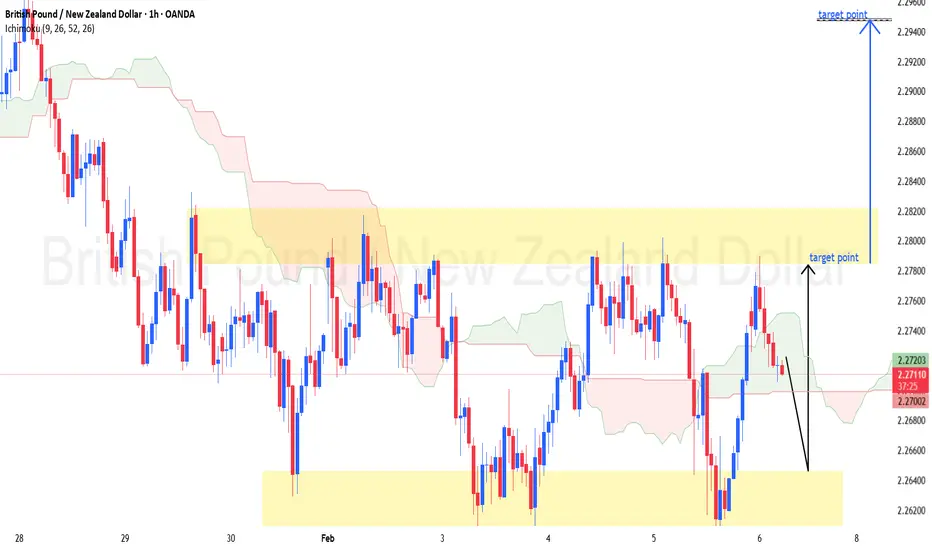
GBPNZD – 1H Chart Targets...GBPNZD – 1H Chart Targets 📊
Based on my chart (range market + demand reaction + Ichimoku in middle):
🔍 Market Bias
Short-term Bullish Pullback from demand
Overall structure still range / corrective
📈 Buy Setup
Buy Zone:
2.2620 – 2.2660 (lower demand zone)
Targets:
🎯 TP1: 2.2780
🎯 TP2: 2.2860
🎯 TP3 (Final): 2.2940 ✅ (upper resistance / marked target)
Stop Loss:
🛑 Below 2.2580
⚠️ Trade Notes
Expect reaction at 2.2780 (mid-range resistance)
Best to secure partial profits
Strong rejection from upper zone may give sell setup later
XAGUSD Rebound from Demand Zone.....Nice setup 👍 This XAGUSD (Silver) 2H chart shows a strong bearish move into support, followed by a reaction from the lower demand area. If you’re planning a **pullback / mean-reversion target**, here are the clean levels:
### 🎯 Upside Targets (from current bounce)
* **Primary Target (TP1): ~90.0 – 92.0**
👉 This matches your marked **range high / target point** and the underside of the Ichimoku cloud (strong resistance zone).
* **Extended Target (TP2, aggressive): ~95.0**
👉 Upper boundary of the previous range + cloud resistance. Only likely if momentum flips bullish and price reclaims the trendline.
### 🔄 Invalidation (keep it simple)
* If price **fails to hold above ~70–72**, the bounce is weak and downside continuation risk increases.

XAUUSD Bearish Bias Summary ....Based on the chart you shared (XAUUSD, 1H), price is trading below the descending trendline and under the Ichimoku cloud, with bearish structure after the CHoCH. The marked projection already aligns well with logical downside targets.
🎯 Downside Targets (Sell Bias)
1st Target (TP1): ~4,600
➜ Nearest horizontal support / previous demand zone.
2nd Target (TP2): ~4,400
➜ Major liquidity pool / lower support zone.
📉 Bearish Bias Summary (Short & Simple)
Price is respecting the descending channel and rejecting the cloud. As long as price stays below the trendline and cloud, continuation toward 4,600 → 4,400 remains likely.
If you want, I can also give you:
A clean title + caption for posting this chart
Or bullish invalidation levels (where this setup fails)

XAGUSD Bearish Continuation ......This is a 2-hour (H2) XAGUSD (Silver vs USD) chart showing a full market cycle: accumulation → bullish trend → breakdown → bearish continuation.
Key structure & concepts shown:
Range / Accumulation (Left side)
Price consolidates in a marked range, indicating accumulation and liquidity build-up.
Bullish Channel (Markup Phase)
Price breaks out and trends higher within a clean ascending channel, respecting dynamic support and resistance.
Trend Failure & Breakdown
Price loses the channel support and breaks below the prior range base (marked as Breakdown), signaling a bearish market structure shift.
Strong Impulsive Sell-Off
Large bearish candles show aggressive distribution and momentum to the downside.
Fair Value Gap (FVG) / Supply Zone Retest
Price retraces into the highlighted FVG / supply zone, where selling pressure is expected to step in again.
Bearish Continuation Target
A projected downside target is marked at prior demand/liquidity levels, suggesting continuation of the bearish leg after the pullback.

Gold H1: Distribution Phase After Break of StructureThis is a 1-hour (H1) XAUUSD (Gold vs USD) chart showing a clear market structure shift from accumulation to distribution, then into a strong bearish trend.
Key phases visible:
Range / Accumulation (Left side)
Price moves sideways inside a marked range, indicating consolidation and liquidity building.
Break of Structure (BoS)
Price breaks above the range high, signaling bullish intent and triggering a markup phase.
Trend Exhaustion & Reversal
After the strong bullish impulse, price forms a top and begins respecting a descending channel, showing a transition into bearish control.
Bearish Impulse (Markdown Phase)
Strong, consecutive bearish candles push price lower, confirming trend continuation to the downside.
Pullback into Rejection Zone
Price retraces into a marked supply / rejection zone (aligned with Ichimoku cloud resistance), suggesting institutional selling pressure.
Target Projection
A downside target is marked near prior lows / demand zone, implying a continuation short setup after rejection.

Bearish Descending Channel with Continuation Setup
This is a BTC/USD 1-hour chart showing a clear downtrend inside a descending channel. Price has been making lower highs and lower lows, respecting the channel boundaries. The Ichimoku Cloud is mostly above price, acting as dynamic resistance, which confirms bearish momentum. A BOS (Break of Structure) is marked, indicating continuation of the bearish move after a pullback into resistance. Price is currently trading near the lower half of the channel, suggesting selling pressure remains strong, with a projected downside target around the lower support zone (near 64k) if the trend continues.

GBPUSD – 4H Chart Targets... GBPUSD – 4H Chart Targets 📉
Based on the chart me shared (descending trendline + price below resistance):
Bias: Bearish (Sell on pullbacks)
Sell Zone:
1.3560 – 1.3600 (trendline / resistance area)
Targets:
🎯 TP1: 1.3500
🎯 TP2: 1.3420
🎯 TP3 (Final): 1.3350 ✅ (me marked target zone)
Stop Loss:
🛑 Above 1.3650 (trendline break & structure invalidation)
Notes:
Price is respecting the descending trendline
Bearish momentum remains strong
Ichimoku cloud resistance above price supports downside continuation
⚠️ Always manage risk properly and wait for confirmation on entry.

ETHUSD (2H) — clear picture...ETHUSD (2H) — clear picture
Here’s the clean breakdown based on what’s on my chart.
Market Structure
Strong bearish trend
Price is below Ichimoku cloud → trend still bearish
Descending trendline holding as resistance
No bullish structure break yet
Sell Targets 🎯
From current price area (~2190–2200):
TP1: 2,050 – 2,020
Minor support / first liquidity grab
TP2: 1,950 – 1,920
Strong horizontal support (my first marked target)
Final Target: 1,750 – 1,700 🔥
Major demand zone
Matches my second target point + full bearish continuation
Invalidation / SL
If 2H candle closes above 2,300–2,330
→ bearish setup weak
Safe SL: above 2,350
Bias
📉 Bearish continuation until ETH reclaims 2,350+ with structure break

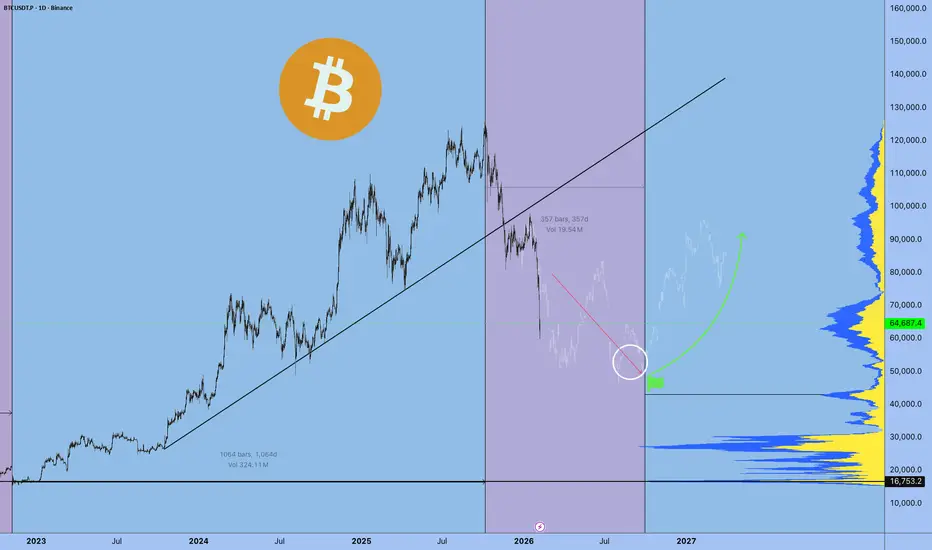
This Isn’t a Reversal — It’s Only Phase Two. $BTC>65k Thank you for your attention! This is exactly what you've been hearing since September 2025. Next, we'll form the bottom, and reaccumulate until October.
A smart person told me to stop posting publicly. Make everything private, but I continue to publish my thoughts for you.
There are no entry points for positions here; my positions are elsewhere.
I accidentally made a private post yesterday
Right now, it’s still too early to talk about any meaningful reversal. We’re not in a recovery phase - we’re in phase two of the market cycle, and this phase tends to last longer than most expect. The structure is forming exactly as it should: slowly, unevenly, with pockets of stress that haven’t fully played out yet.
Bitcoin is dropping, but for me there’s nothing surprising in this move.
If you’ve been following my posts for a while, you know this scenario was not only possible
— it was highly probable. We’ve already reached the first target zones I highlighted earlier, and the market is now moving toward the deeper structural points that complete this segment of the cycle.
There are still shocks ahead, and the system hasn’t finished recalibrating.
This is not a trend market — this is a regime market. And regime markets demand patience, discipline, and the ability to read liquidity, not headlines.
2026: A Year of Market Regimes
2026 feels like a year defined by regimes, not direction.
This is a market that punishes overconfidence and rewards discipline: managing leverage, staying patient, and understanding liquidity matter more than any narrative.
Liquidity today behaves like a system of pipes. Sometimes the taps look wide open, yet the internal pressure shifts so fast that trends break long before the crowd can explain the move with headlines.
In these phases, Bitcoin behaves not like a “legend”, but like the most liquid proxy for risk:
under stress, it’s the first asset sold because reducing exposure through BTC is the easiest and fastest way.
This leads to a key insight:
Even during superficially “risk-on” news cycles, BTC can underperform when several forces align:
- rising demand for USD (dollar squeeze)
- carry trades unwinding
- capital rotating into leading sectors (metals, indices)
- portfolios cutting risk and closing leverage
Three Structural Scenarios for 2026
I avoid guessing levels; instead, I work with structural patterns. For 2026, I see three core possibilities:
1) Capitulation → Base Formation
A sharp washout, volatility climax, then a broad range and gradual base building.
2) Rallies Within a Larger Downtrend
Strong upside moves that turn into distribution.
The market gives hope — and takes it back on retests.
3) Macro Shock
An event in FX, rates, or liquidity triggers fast deleveraging.
Moves overshoot, correlations spike, and a violent mean reversion follows.
This is why my approach now is very simple:
fewer trades, higher quality.
I’m deliberately reducing the number of positions and focusing only on moments where structure provides a clear edge — because in years like this, capital is preserved not by activity, but by the right pauses.
About the Academy
In parallel, I’m updating my Academy in real time: weekly materials, market structure breakdowns, liquidity updates, USD dynamics, and risk indicators.
The access is open and free — anyone can stay aligned with the current regime without noise.
Current Market Structure
Looking at today’s structure, the market is forming precisely the segment I expected.
The key volume level ahead remains intact, and with high probability, price will break through it. Only after that expansion may we see the formation of the first real leg of the next cycle.
The conservative zones I mentioned earlier remain valid. More negative scenarios exist, yes — but the underlying logic does not change:
Accumulate gradually — on fear, liquidations, and liquidity distortions.
The main zone is very close, and that is where, in my view, the most interesting continuation setup will appear.
Best regards EXCAVO