ETH 1H – Holding the Line or Breaking It?ETH 1H – Holding the Line or Breaking It?
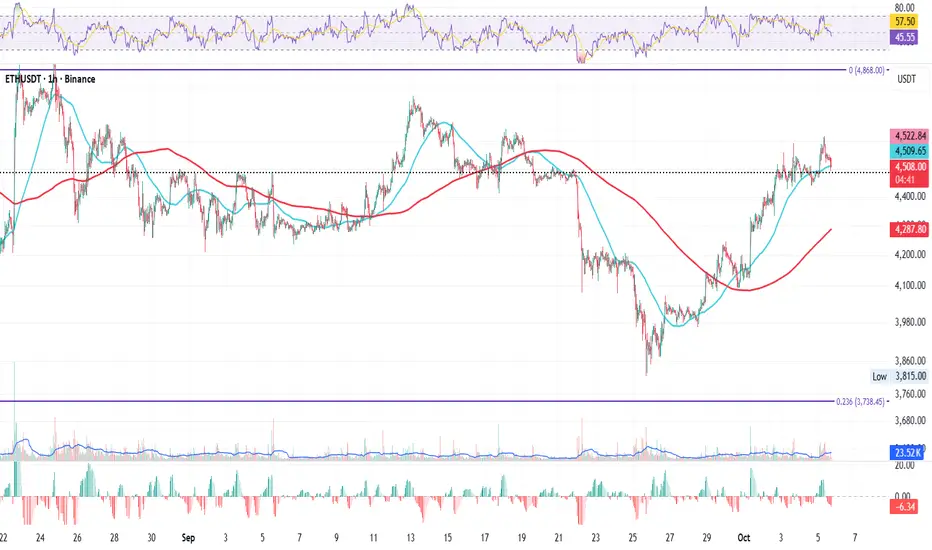
Just like BTC, ETH on the 1H is currently testing the 50MA, the short-term line between strength and weakness.
The question now: will it hold as support, or will price break below and look for shelter near the 200MA?
Right under the 50MA sits yesterday’s close, adding an extra layer of support for the short-term structure.
Today’s close could be decisive for next week’s momentum. 👀
Key notes:
ETH testing the 50MA on 1H
200MA below as next support
Yesterday’s close acting as buffer
Close today could shape next week’s direction
Bias:
Neutral-bullish — momentum intact as long as the 50MA holds.
Always take profits and manage risk.
Interaction is welcome.
Crypto
SHIB Long Idea - DLRMD Model SHIB Swing Long Opportunity - DLRMD MODEL
📊 Market Sentiment
FED has resumed its rate-cutting cycle, starting with a 0.25% cut in September, with two more expected. Institutional liquidity inflows have accelerated as the U.S. officially adopts crypto as part of its reserves. Despite elevated inflation, a weakening labor market is forcing the FED to ease, pushing more capital into risk-on assets.
📈 Technical Analysis
Price is in a higher time frame (HTF) bullish trend, so I’ll only be looking for longs.
Price swept the weekly swing liquidity, closed above, and broke the daily structure — forming a strong daily demand zone. The first tap to this zone generated a solid bullish reaction, confirming its validity.
Currently, price is rejecting from a bearish trendline after running previous liquidity. I assume price now has enough momentum to test and potentially break that trendline for the next leg higher.
📘 Model to be used – HTF Demand w/ Liquidity Run & Max Discount Zone (DLRMD Model)
1-Identify HTF trend direction and only trade in that direction.
2-Locate the HTF demand zone where price can find support and bounce.
3-Wait for LTF liquidity sweep to confirm energy for a reversal.
4- Use Fibonacci retracement to define the max discount zone (around 0.75 retracement).
5- Enter once price shows rejection or bounce confirmation.
📌 Game Plan
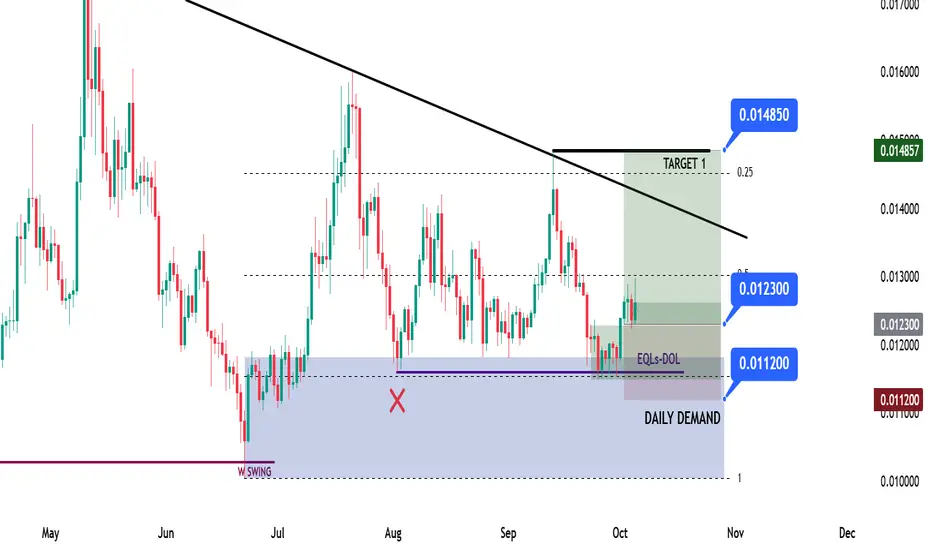
Entry already taken at $0.0123 from the retest of the daily demand + discount zone confluence.
I will hold the position until the bearish trendline and monitor for a breakout.
First target is the bearish trendline; once reached, stoploss will move to breakeven, and the rest will be managed toward the next liquidity level.
🎯 Setup Trigger
Setup is active now.
📋 Trade Management
Entry: $0.0123
Stoploss: $0.0112
Targets: TP1 = Bearish trendline | TP2 = $0.01485
💬 Like, follow, and comment if this breakdown supports your trading! More setups and insights coming soon stay connected!
⚠️ Disclaimer: This content is for informational and educational purposes only and does not constitute financial, investment, or trading advice. Always DYOR before making any financial decisions.
BRIEFING Week #40 : What could cause VIX>100Here's your weekly update ! Brought to you each weekend with years of track-record history..
Don't forget to hit the like/follow button if you feel like this post deserves it ;)
That's the best way to support me and help pushing this content to other users.
Kindly,
Phil

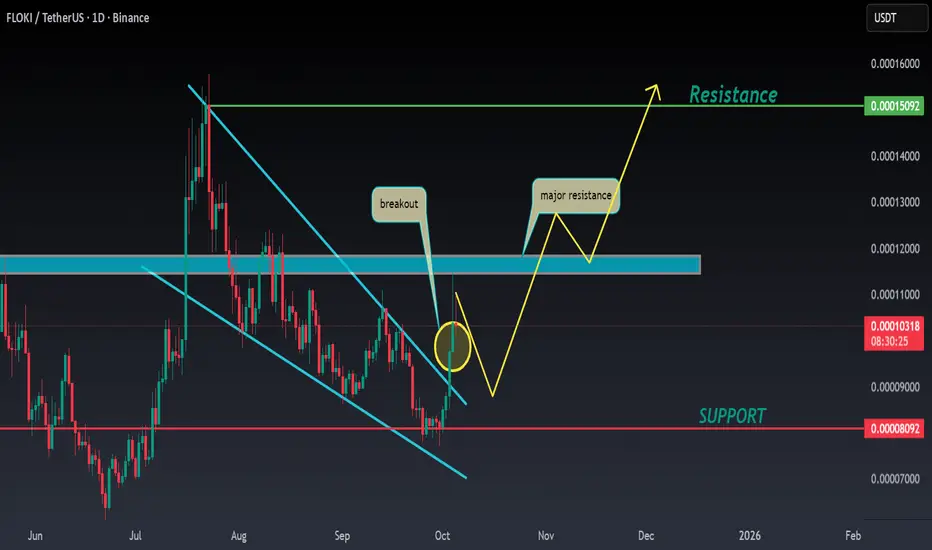
FLOKI ANALYSIS📊 #FLOKI Analysis
✅There is a formation of Falling Wedge Pattern on daily chart with a breakout and currently pullback from its major resistance zone 🧐
Pattern signals potential bullish movement incoming in few days
👀Current Price: $0.00010
🚀 Target Price: $0.00015
⚡️What to do ?
👀Keep an eye on #FLOKI price action and volume. We can trade according to the chart and make some profits⚡️⚡️
#FLOKI #Cryptocurrency #TechnicalAnalysis #DYOR
DOGE Swing Long Idea - TRKZ ModelDOGE Swing Long Idea w TRKZ Model
📊 Market Sentiment
FED has resumed its rate-cutting cycle, starting with a 0.25% cut in September, with two more 0.25% cuts expected in the coming months. Additionally, institutional liquidity inflows have accelerated as the U.S. officially adopts crypto as part of its reserves. While inflation remains elevated, the weakening labor market is forcing the FED to ease, driving more capital into risk-on assets.
📈 Technical Analysis
Price broke the bearish trendline that had been responsible for the bearish trend since December 2024 and closed above, indicating that price will seek higher levels.
Price also broke the HTF Key Level aggressively and closed above. I expect this level to hold and push us higher.
📘 Model to be used – Broken Trendline Retest supported by HTF Key Zone Retest (TRKZ)
In this model, we need to see a HTF trendline broken aggressively with a close above on HTF. Then, we check for a broken HTF Key Zone (Supply–Demand–Support–Resistance) aligned with the trendline break. Finally, we look to enter after the retest of both the broken trendline and the broken Key Zone.
📌 Game Plan
Carry the position toward the December 2024 high at 0.48$ as a mid–long term swing position. Trail the stoploss after taking first TP, move entry to breakeven, and manage forward.
🎯 Setup Trigger
Setup is valid after retesting the broken trendline and HTF Key Level.
📋 Trade Management
Stoploss: 0.18254$
Targets: TP1: 0.308$ | TP2: 0.4344$ | TP3: 0.4842$
Once TP1 is hit, stoploss will be moved to breakeven to secure profits.
💬 Like, follow, and comment if this breakdown supports your trading! More setups and market insights coming soon — stay connected!
⚠️ Disclaimer: This content is for informational and educational purposes only and does not constitute financial, investment, or trading advice. Always DYOR before making any financial decisions.

LINK Swing Long Idea - KZMT ModelLINK Swing Long Idea
📊 Market Sentiment
FED has resumed its rate-cutting cycle, starting with a 0.25% cut in September, with two more expected. Institutional liquidity inflows have accelerated as the U.S. officially adopts crypto as part of its reserves. Despite elevated inflation, a weakening labor market is forcing the FED to ease, pushing more capital into risk-on assets.
📈 Technical Analysis
Price is in a higher time frame (HTF) bullish trend, so I will only be looking for longs.
Price broke the HTF Key Zone and closed above, then retested and rejected from it — confirming the zone as demand.
Price also deviated and tapped back into the HTF bullish trendline, confirming trapped short-sellers and reinforcing bullish momentum.
📘 Model to be used – HTF Key Zone w/ HTF Manipulated Trendline (KZMT)
This model first identifies the HTF trend and only trades in that direction. Next, I locate key zones that support price. Finally, I look for a manipulated HTF trendline that aligns with those zones. When both confluences overlap, conviction for a strong bullish reaction increases.
📌 Game Plan
1)Price to revisit HTF Key Zone.
2)Retest of the HTF bullish trendline.
🎯 Setup Trigger
Limit entry at 22$
📋 Trade Management
Stoploss: Daily close below HTF Key Zone or hard stop at $19.5
Targets: TP1 = $25 | TP2 = $28
💬 Like, follow, and comment if this breakdown supports your trading! More setups and market insights coming soon — stay connected!
⚠️ Disclaimer: This content is for informational and educational purposes only and does not constitute financial, investment, or trading advice. Always DYOR before making any financial decisions.

Bitcoin (BTC) Hits New Highs, Analyzing Future ScenariosBINANCE:BTCUSDT
Bitcoin (BTC) hit a new all-time high today, once again encountering resistance at a long-term slant, extending from the 2017 and April 2021 highs. Since then, a correction of approximately 2% has occurred, forming a long upper shadow on the daily chart. Notably, this trend is displaying a fractal pattern similar to the July 14th peak. If today's daily chart closes with a long upper shadow, it could lead to a short-term sideways or correction phase. Conversely, if it closes with a negative candlestick, this section could be interpreted as a trend reversal signal following the formation of a high.
8-year long-term oblique angle
Your follow and boost would mean a lot. 🚀
I am Korean and I used Google Translate.

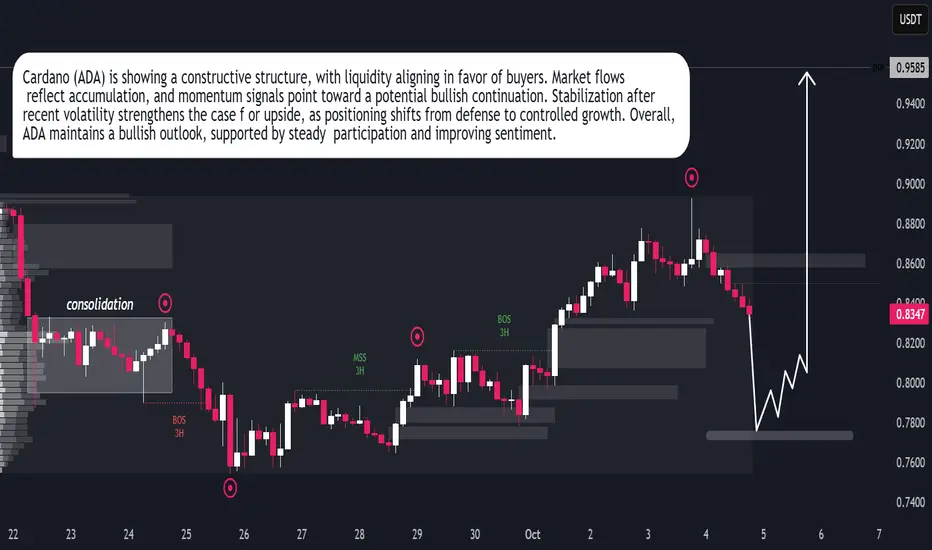
Cardano (ADA) Ready for Bullish ExpansionCardano (ADA) Ready for Bullish Expansion
Cardano (ADA) is building strength as market conditions favor accumulation over distribution. Liquidity behavior shows steady inflows, suggesting participants are positioning for upward continuation. The recent stability reflects confidence, with sentiment gradually tilting toward growth. Momentum indicators align with this view, reinforcing the prospect of a bullish expansion phase. ADA’s structure signals resilience, and the market tone supports the case for sustained upside in the near term.
BTC STILL IN TREND FOR MORE.. UPDATE 04-10-2025📊 Market Update
Bitcoin (BTC):
Bitcoin is maintaining its main upward trend, which continues to define the overall bullish structure. At the moment, BTC is trading in a new lower time-frame zone and needs to hold above $121.6K to confirm a green (bullish) structure on the lower time frame.
Bitcoin is positive until now

fet looking good at least for short termformed falling wedge and approaching towards trend line, expecting breakout soon expecting move towards 1$ in case of successful brreakout

DOGE Breakdown Could Trigger a Major Dump Yello, Paradisers! Have you noticed what just happened with DOGE? The recent price action is sending a clear warning that downside risk is increasing — and fast. Several technical signals are aligning, and ignoring them here could be costly.
💎DOGEUSDT has broken down from its ascending channel structure — a clear shift in trend. More importantly, we’re seeing bearish divergence on both MACD and RSI, confirming that momentum is weakening despite recent price attempts to push higher. When these signals appear together, it often precedes a sharp reversal.
💎Adding to the bearish bias, the price has just formed a double top pattern — and not just anywhere, but exactly at a previous support level that has now turned into resistance. This type of confluence makes the setup even more reliable for a potential move to the downside.
💎From the current levels, the risk-to-reward ratio is already attractive for short positions. However, considering the broader bullish tone of the overall crypto market, it may be wise to size positions conservatively here. Traders who prefer more confirmation might wait for a clean retest of the resistance zone, where a bearish candlestick pattern would provide a higher-conviction entry point.
💎If, however, price breaks back above the resistance zone and closes firmly above the invalidation level, the bearish setup becomes invalid. In that case, it's best to step aside and wait for fresh signals or clearer market structure before acting again.
🎖But it never is, and never will be a free ride. Make sure you play it smart, Paradisers; the next 6–9 months will be juicy for some and painful for others. Discipline, patience, robust strategies, and trading tactics are the only ways you can make it long-term in this market.
MyCryptoParadise
iFeel the success🌴

ETHSimple chart :
- Don’t fight the trend, just stick to your strategy.
- follow the signs.
- Never go all in and always DCA.
Only this way we will learn to master our emotions.
Happy Tr4Ding !

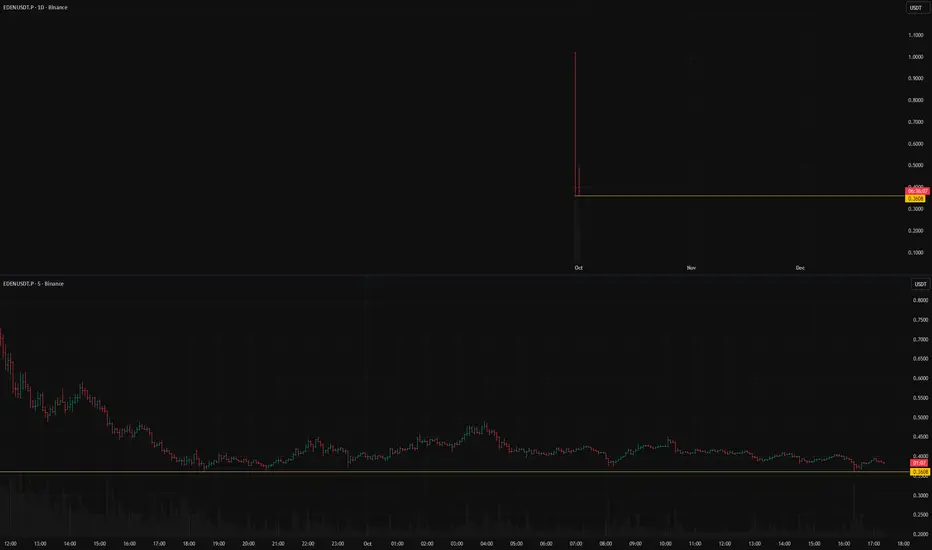
EDENUSDT.P short setup from daily support at 0.3608After its listing, BINANCE:EDENUSDT.P has been moving down and has currently stopped at a level that has already been clearly confirmed.
At the moment, we have a combination of favorable factors for a short: a downtrend, an absence of strong buyers, good volatility, and consolidation.
All that remains is to wait for YOUR OWN entry point according to your trading system.
An important condition is that volatility does not increase as the price approaches the level.
Key factors for this scenario
Global & local trend alignment
Price void / low liquidity zone beyond level
Volatility contraction on approach
Prolonged consolidation
Was this analysis helpful? Leave your thoughts in the comments and follow to see more.
BTCUSD Long: Path to 123000 After BreakoutHello, traders! The prior market structure for BTCUSD saw a significant reversal after the price broke out of a descending channel. This shifted control to buyers and led to a prolonged consolidation phase, with the price auction building a range between the demand zone 2 near 109700 and the supply zone around the 117000 level.
Currently, this long period of balance has been resolved with a decisive breakout. A strong bullish initiative from the demand zone 2 has propelled BTCUSD above the 117000 supply level and out of the consolidation range. The market is now in a clear bullish expansion phase after breaking this key structural point.
My scenario for the development of events is a classic breakout and retest. I expect the price to make a corrective pullback to test the former resistance at the 117000 - 118000 supply zone as new support. In my opinion, a successful bounce from this zone would confirm the breakout's validity and trigger the next impulsive wave higher. The take-profit is therefore set at 123000. Manage your risk.

BITCOIN STILL IN THE ZONE - UPDATE 03-10-2025📊 Market Update
BTC remains positive on the lower time frame at 119.8, while the main trend is holding at 110.3. In the next BTC update, we’ll see whether BTC is still maintaining its positive structure — any new changes will be added.

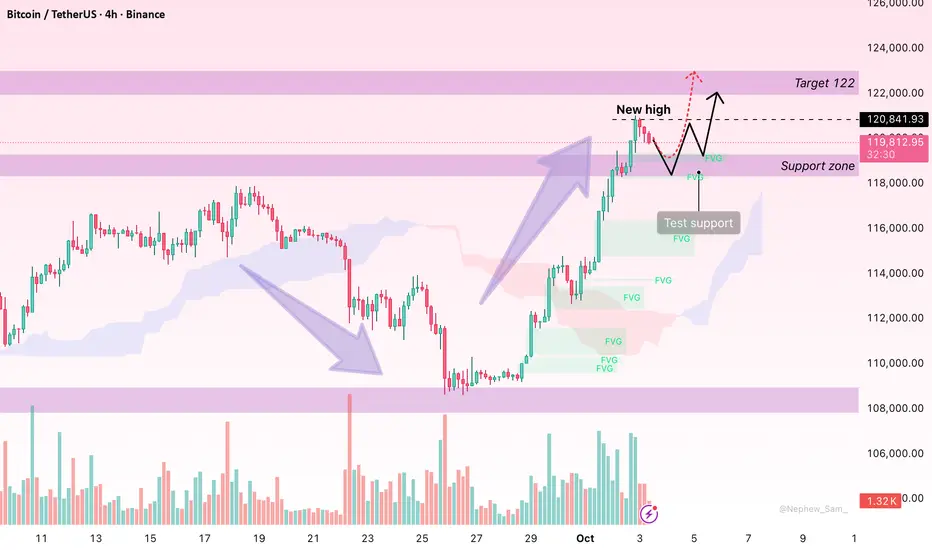
Bitcoin: Mild Pullback Before Eyeing Fresh HighsHello everyone, Bitcoin continues to capture attention after reaching a peak of 120,324 USD before easing slightly to around 119,793 USD. This pullback is viewed as a technical pause within a broader uptrend rather than a sign of reversal.
From a technical perspective, BTC remains above the Ichimoku cloud and is supported by FVG zones around 119,000–118,500 USD. Trading volume surged at the 120,000 USD level, highlighting strong institutional buying and reinforcing the bullish outlook.
On the news front, the US dollar is weakening due to the risk of a government shutdown, while capital inflows from ETFs and major institutions continue to flow into the market. Combined with the current low interest rate environment, Bitcoin increasingly stands out as an attractive safe-haven asset.
In the near term, Bitcoin is expected to hold support at 119,000–118,500 USD and rebound towards 122,000 USD, with extended targets at 125,000 USD and even 128,000 USD if momentum remains strong.
Only a break below 118,500 USD would open the door for a deeper correction towards 117,800–116,500 USD before recovery attempts resume.
What’s your view? Will BTC/USDT hold the line and move on to conquer 125,000 USD?
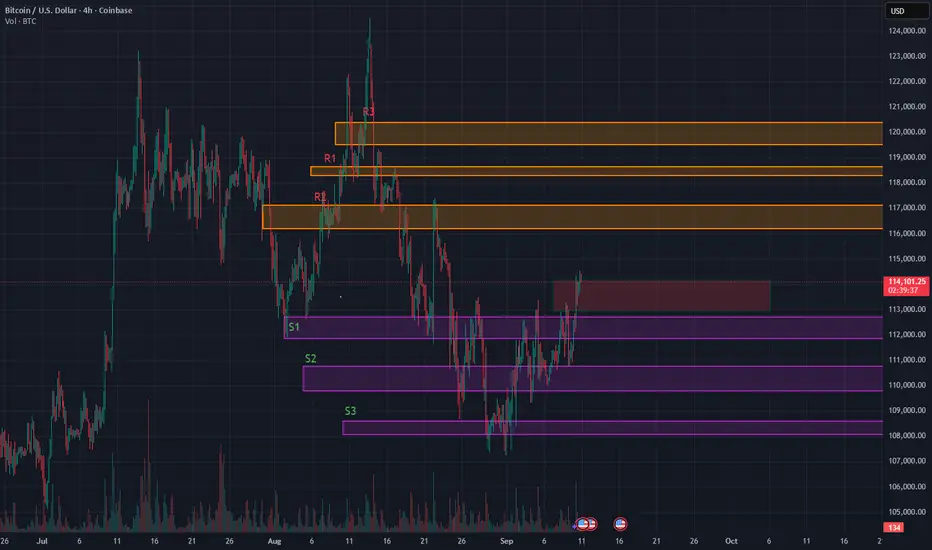
Range-Bound Rocket: BTC’s Coiled Spring Between S1 and R3-ATHRange Bound Rocket: BTC Loaded and Coiled for $120k Retest
Description:
BTC is now trading around $114,260, still inside the range I’ve flagged earlier. We reloaded at our previously posted support zones between $110k and $111k. That gives us a strong base.
I’m watching for acceptance above the $113k to $114k red box, which overlaps with the neckline of a potential reverse Head & Shoulders on the 4‑hour chart. It hasn’t triggered yet but we are in validation mode. (expecting a retest to 113k and then a break up) If we get a breakout with volume expansion and wide‑bodied candles, I’ll treat that as a valid activation. Target remains $119k and above.
This table shows how likely BTC is to stay above certain price levels over the next two weeks based on current volatility. These are not predictions, they represent statistically expected ranges based on price behavior.
2WK/Probability, Price Level, Meaning
90%, ~$96,700 BTC is very likely to stay above this level
75%, ~$103,200 BTC has a strong chance of staying above here
50%, ~$111,000 This is the midpoint, BTC has equal chance of being above or below
25%, ~$119,400 BTC has a one in four chance of closing higher than this
10%, ~$127,400 Only a small percentage of outcomes put BTC above this level
Key takeaways:
BTC is currently trading around $114,260, sitting just above our red resistance zone at $113,000 to $114,000.
Our first upside target, $118,000, lines up with the top 25 to 30 percent range of expected outcomes. This is reachable if the broader market stays supportive.
$120,000 sits closer to the top 20 percent threshold. BTC would need strong momentum and favorable macro data to push there in the next two weeks.
Downside probabilities
While the structure looks bullish, we should still consider these potential retracement levels:
Around 46 percent chance BTC dips below $110,000
Approximately 43 percent chance it drops under $109,000
Roughly 30 percent chance BTC trades below $105,000
These downside paths are consistent with our S2 and S3 support zones, which were successfully defended during the last major pullback.
What I'm doing and suggest :
Breakout confirmation:
I’m looking to add above $113k to $114k only if volume expands and candles show conviction, meaning minimal wicks and strong closes. Weak volume or upper wicks mean the breakout could fail. Main stop is back inside the range. Scalpers can use a tighter invalidation below $112.2k.
Reload zone:
A move into $110k to $109k is a statistically common retest. I’ll look for buyer defense and fading downside pressure to reload.
Volatility risk:
I'm already positioned long from our previously posted support zones around $110k to $111k, so I’m not actively adding or hedging right now. Into CPI and the Fed, I’m staying hands-off unless we get a clear breakout or strong market signal.
For those not in position:
Avoid chasing breakouts before the event
Look for confirmation or reaction post-data
If we get a volatility spike, retests of $110k to $109k are still statistically common and may offer a better entry
The goal is to avoid being overexposed heading into binary catalysts. I’m holding my current spot exposure and letting the trade breathe.
If no breakout forms:
I expect BTC to remain in a range between $111k and $118k. Support zones from prior posts maintained a bullish bias. If BTC consolidates below $114k but keeps forming higher lows, I’ll consider that ongoing accumulation.
Catalysts to monitor:
Nasdaq or NQ breakdown
• Tech strength: Nvidia up ~30% YTD on strong Blackwell Ultra demand, ADI and MX showing strength despite macro headwinds.
Jobless claims rising again
• U.S. jobless claims are rising to 237K, signaling labor market cooling. Continuing claims are easing but job additions in August were weak at just 22K. Recent wide downward revisions (~911K fewer jobs year-to-date) reinforce rate‑cut bets.
Geopolitical risk
• Geopolitical tensions remain tail‑risks.
Fed rate tone and CPI reaction
• Fed tone and CPI outputs are increasingly important as data is tilting soft and markets are pricing in easier policy.
• The USD’s trajectory matters. Further weakness helps BTC and tech space gain more cushion.
Tech remains a key driver. AI and semis continue to lead Nasdaq strength, and BTC still tracks equity moves closely. A soft dollar also reduces market drag and supports upside potential.
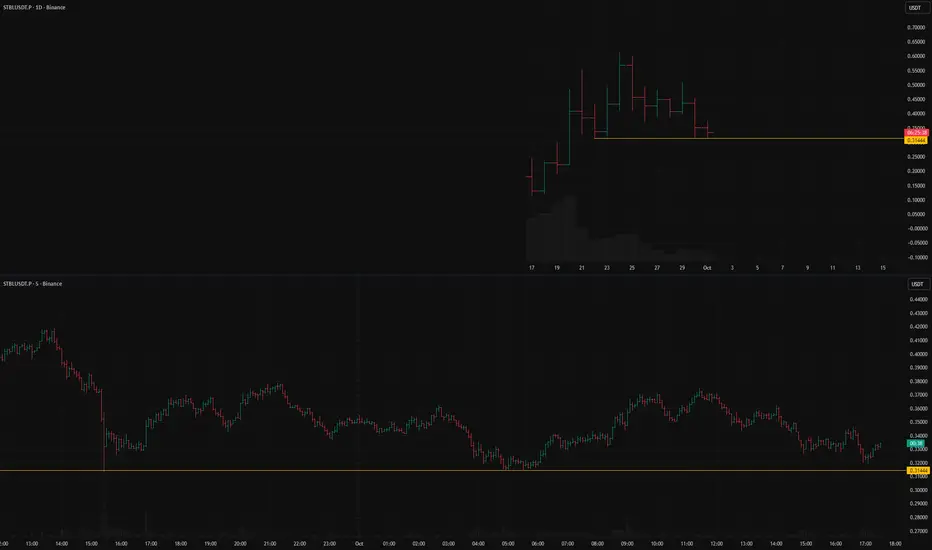
STBLUSDT.P short setup from daily support at 0.31444For the second day in a row, BINANCE:STBLUSDT.P is confirming the strength of the level with clean tests.
Below this level, there are no nearby obstacles that could complicate the asset's fall.
Therefore, it is worth waiting for your own entry point, while carefully monitoring the volatility, as always.
Key factors for this scenario
Price void / low liquidity zone beyond level
Volatility contraction on approach
Immediate retest
Prolonged consolidation
Repeated precise tests of the level
Was this analysis helpful? Leave your thoughts in the comments and follow to see more.
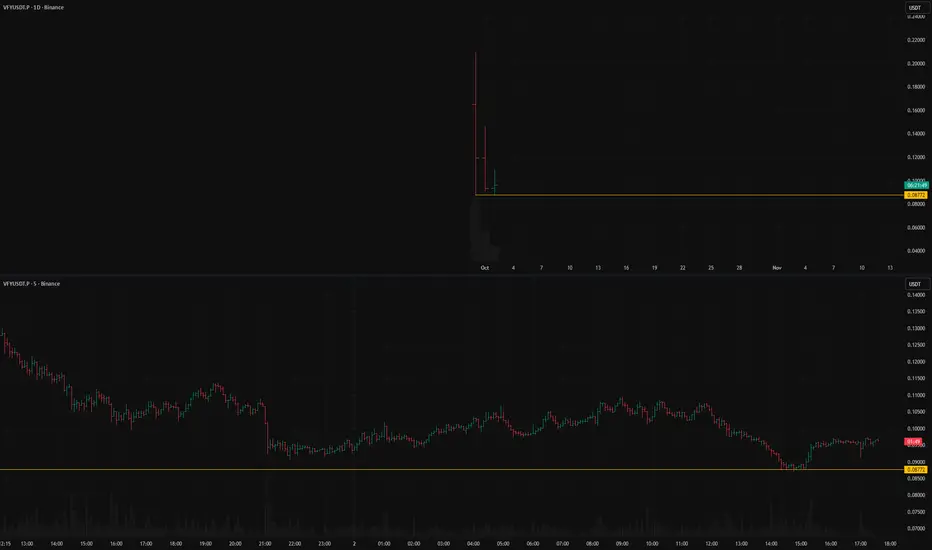
VFYUSDT.P: short setup from daily support at 0.08772BINANCE:VFYUSDT.P has a strong level—its All-Time Low.
Below it, there are no support levels that could slow the decline, so the fall could be very sharp.
Today, there was a good test of the level: the price came right up to it, consolidated on low volatility, confirming it cleanly, and then made a weak pullback.
This weak pullback signals an absence of buyers who might "save" the asset, which is why there could be a good short opportunity here.
Key factors for this scenario
Global & local trend
Price void / low liquidity zone beyond level
Asset decoupled from the market (relative strength/weakness vs. BTC)
Volatility contraction on approach
Immediate retest
Prolonged consolidation
No reaction after a false break Was this analysis helpful? Leave your thoughts in the comments and follow to see more.
Against the trend, risky but worthy trade..I found the head and shoulder potential pattern in BTCUSD today.
As price now is challenging its high and been around 88.6% fibo level as well as the previous swing high (left shoulder), i will entry short from this level..
GOOD RR, i am expecting a correction to 114-115k in upcoming week.
CHEERRRSSS...!!!

DOGEUSDT Forecast: Correction Near EndDogecoin has cycled through an aggressive expansion phase followed by distribution and a clear corrective sequence. The strong rally earlier in September reached exhaustion after buyers failed to sustain momentum, leading to a controlled decline. This retracement phase has pushed price back toward levels where market participants are reassessing risk and value.
Recent flows highlight reduced seller dominance, with price beginning to display characteristics of absorption. Market behavior suggests that liquidity is being tested, creating conditions where a potential recovery phase could emerge. Historical Dogecoin cycles often show this pattern: rapid expansions, corrective cooling, then renewed accumulation before the next impulse.

ETH/USDT | ETH Weekly Setup – Strong Demand Pushes Toward $6K!By analyzing the Ethereum chart on the weekly timeframe, we can see that after entering the $3,800 demand zone, ETH gained strong buying pressure and reached the $4,200 and $4,600 targets.
Currently, Ethereum is trading around $4,500, up about 19%, and I expect further bullish movement soon. The next upside targets are $4,950, $5,500, and $6,000.
THE LATEST TA :
Please support me with your likes and comments to motivate me to share more analysis with you and share your opinion about the possible trend of this chart with me !
Best Regards , Arman Shaban

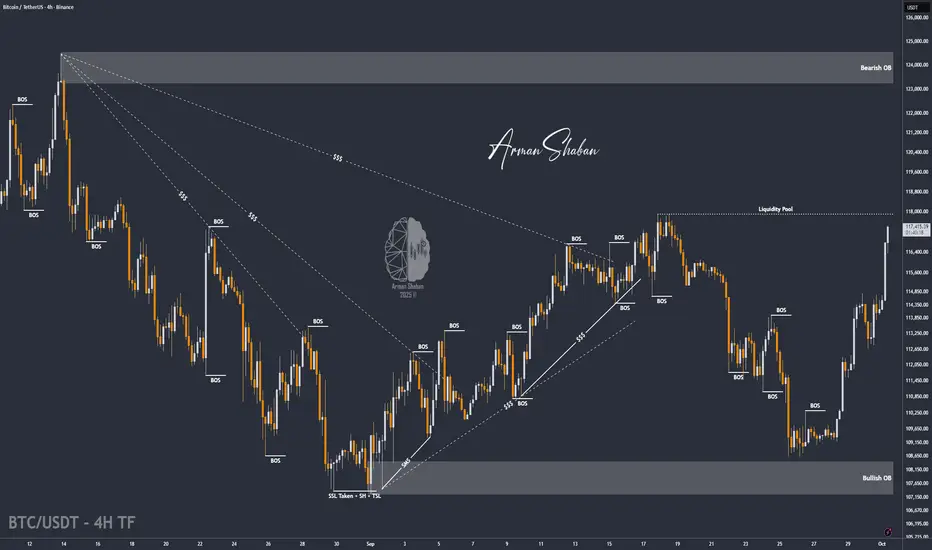
BTC/USDT | BTC Rally +7% Gains – Bulls Still in Control (READ)By analyzing the Bitcoin chart on the 4-hour timeframe, we can see that the price continued its rally as expected, hitting the $115K target and now reaching up to $117,200, just one step away from the next target at $118K. So far, this analysis has delivered more than 7% gains. I hope you made the most out of it!
Please support me with your likes and comments to motivate me to share more analysis with you and share your opinion about the possible trend of this chart with me !
Best Regards , Arman Shaban