Will #XRP Finally Recover or Is This Just Another Trap? Yello Paradisers! Are you keeping your eyes on #XRP? While most traders are zoning out, the next move might catch the crowd sleeping. Let's view #Ripple trading setup:
💎Over the past few weeks, #XRPUSDT has been trading inside a textbook falling wedge pattern on the 4H chart. Just recently, we saw a liquidity sweep below the descending support trendline, an early signal that smart money could be accumulating before a breakout move.
💎The price is currently hovering just above a strong demand zone around $1.73, with a clear descending resistance capping price action. A clean breakout above that resistance, especially if followed by a successful retest and the 50EMA flipping into support, would significantly boost the probability of a bullish move.
💎If this scenario plays out, the first minor resistance for #XRPUSD stands near $1.95, which could act as an initial profit-taking zone. Beyond that, momentum could accelerate toward $2.1951, marked as moderate resistance. But the ultimate upside target is at $2.4175, a strong resistance level with a high volume node, where aggressive sellers are likely to show up.
💎However, caution is key here. If #XRP fails to hold above the current support zone and closes below $1.7366, the bullish setup would be invalidated. That would likely trigger more downside toward $1.70 and possibly lower, especially as weak hands start exiting the market.
Trade smart, Paradisers. This setup will reward only the disciplined.
MyCryptoParadise
iFeel the success🌴
Crypto

BTCUSD Time for LONG1h - bullish divergence
4h - hidden bullish divergence
15m - new low with US open and than it could star the bullrun on 15m
Target for this movement will be 93k
Stay profitable !

EURUSD Short: Supply Holds, Bears in Control, Move To 1.1550Hello traders! Here’s a clear technical breakdown of EURUSD (3H) based on the current chart structure. EURUSD initially traded within a consolidation range, where price moved sideways after a prior decline, indicating temporary equilibrium between buyers and sellers. This range acted as a base for the next directional move. A confirmed breakout from the range triggered a bullish recovery, shifting short-term control to buyers. Following the breakout, price developed a well-defined ascending channel, marked by consistent higher highs and higher lows. Pullbacks during this phase were corrective and respected the channel structure, confirming sustained bullish momentum. However, as EURUSD approached the upper boundary of the channel, upside strength began to fade. A fake breakout above channel resistance signaled buyer exhaustion and increasing sell-side pressure at higher prices. Near the highs, price formed a clear rounding top pattern around a key pivot point, reflecting a gradual loss of bullish momentum rather than an impulsive reversal. This topping structure was followed by a breakdown below internal support, confirming a short-term shift in market control. After losing the ascending structure, EURUSD transitioned into a descending channel, establishing a bearish corrective phase characterized by lower highs and lower lows.
Currently, EURUSD is trading within the descending channel and moving toward a key Demand Zone around 1.1550, which aligns with previous structural support and historical reactions. This zone represents the next important area where selling momentum may slow and buyers could attempt a defensive response.
My primary scenario remains bearish as long as EURUSD stays below the 1.1680 Supply Zone and continues to respect the descending channel structure. Pullbacks into supply that show rejection can be viewed as potential continuation opportunities, with 1.1550 Demand Zone acting as the first downside target (TP1). A clean breakdown and acceptance below 1.1550 would open the door for a deeper bearish continuation toward lower demand levels. However, a strong bullish breakout and sustained acceptance above 1.1680 would invalidate the short bias and signal a possible transition back into consolidation or bullish recovery. Until such a breakout occurs, market structure favors sellers, and upside moves are considered corrective. Manage your risk!

BTCUSDT: Buyers Defends, Preparing for Breakout Above $96.5KHello everyone, here is my breakdown of the current BTCUSDT setup.
Market Analysis
BTCUSDT is trading within a well-defined ascending channel, confirming a strong bullish market structure. After a prolonged consolidation phase earlier on the chart, price successfully broke out to the upside and began forming higher highs and higher lows, signaling renewed buyer strength. Following the breakout, BTC rallied aggressively toward a key Resistance Zone around 96,500, where selling pressure became evident. Multiple tests of this resistance area failed to produce a clean continuation higher, leading price into a range formation just below resistance. This range reflects temporary equilibrium between buyers and sellers after the impulsive move up.
Currently, on the downside, price is being supported by a clearly defined Support Zone around 94,000, which previously acted as a breakout level and is now serving as demand. The market recently tested this support and reacted positively, indicating that buyers are still active and defending the level. Structurally, BTC remains above both the channel support and the horizontal support zone, keeping the broader bullish bias intact. The presence of a descending triangle resistance line within the range highlights short-term compression, suggesting that a volatility expansion may follow once price decisively breaks out of the current structure.
My Scenario & Strategy
My primary scenario remains bullish as long as BTCUSDT holds above the 94,000 Support Zone and respects the ascending channel structure. In this case, I expect price to continue consolidating briefly before attempting another move toward the 96,500 Resistance Zone, with a potential breakout opening the way for further upside continuation.
However, a clean breakdown and acceptance below 94,000 would invalidate the bullish setup and signal a deeper corrective move within the channel, possibly toward lower support levels. Until that happens, the market structure favors buyers, and pullbacks into support are viewed as potential long opportunities, while resistance remains the key level to watch for confirmation.
That’s the setup I’m tracking. Thank you for your attention, and always manage your risk.

BTC — NPOC 90680.38Price held at the NPOC, and activity remained low.
Market data behavior observation.
No prediction. No instruction.
Danel Fadejev
CORE5 Tradecraft

EURUSD Descending Channel Points to Further Downside To 1.1560Hello traders! Here’s a clear technical breakdown of EURUSD (3H) based on the chart structure shown in the screenshot. EURUSD initially traded inside a well-defined ascending channel, confirming a bullish recovery phase after forming a base from the prior decline. Price respected the rising support line and produced higher highs and higher lows, showing strong buyer control. During this bullish phase, the market experienced several breakouts and fake breakouts near the upper boundary of the channel, signaling increasing volatility and early signs of exhaustion. As price approached the upper resistance area, buying momentum weakened, and the market failed to sustain acceptance above the highs. Near the top of the structure, EURUSD formed a clear turnaround and distribution phase, followed by a loss of bullish momentum. Price then broke below the ascending channel, confirming a structural shift. After this breakdown, the market transitioned into a descending channel, where price is now forming lower highs and lower lows. This confirms that sellers have taken short-term control, and bullish moves are now corrective in nature. A key Seller Zone / Resistance Level around 1.1680 was tested multiple times after the breakdown. Each attempt to reclaim this area resulted in rejection, reinforcing it as a strong supply zone. Recent price action shows continued respect of the descending channel resistance, with pullbacks failing and momentum favoring the downside. Currently, EURUSD is trading below resistance and is moving toward the Buyer Zone and Support Level around 1.1560, which aligns with previous structure and demand. This area represents the next key reaction zone and the primary downside objective (TP1). A reaction or temporary pause may occur there, but structurally it remains a bearish continuation zone unless buyers regain control. My scenario: as long as EURUSD stays below the 1.1680 Resistance / Seller Zone and continues to respect the descending channel, the bearish bias remains valid. I expect sellers to push price toward the 1.1560 Support / Buyer Zone (TP1). A clean breakdown and acceptance below this level would open the door for a deeper bearish continuation. However, a strong bullish breakout and acceptance back above 1.1680 would invalidate the short scenario and suggest a shift back toward consolidation or recovery. For now, market structure clearly favors sellers. Please share this idea with your friends and click Boost 🚀

XAUUSD Next MoveXAUUSD continues to trade in a strong bullish continuation structure after a clean breakout and hold above the prior supply turned demand zone, confirming sustained institutional buying interest. The higher highs and higher lows on the daily timeframe reflect strong trend momentum, with price acceptance above the key consolidation range signaling trend continuation rather than exhaustion. Fundamentally, gold remains supported by persistent safe-haven demand, ongoing geopolitical uncertainty, central bank gold accumulation, and expectations around easing monetary policy and lower real yields, all of which favor upside pressure. As long as price holds above the reclaimed demand zone and maintains bullish structure, the market bias remains firmly bullish, with momentum favoring continuation toward higher psychological levels and offering strong trend-following opportunities aligned with smart money flow and broader macro strength.

SOLUSDT: When Capital Pulls Out, Price Never LiesLooking at SOLUSDT through the lens of a trader who has lived through multiple market cycles, it’s clear that the market has decisively shifted its stance.
After the previous rally, SOL lost its bullish momentum as a sharp sell-off broke through the entire underlying support structure. This is no longer a normal pullback, but a clear signal that large capital has exited, making room for active selling pressure. The broader risk-off sentiment across the crypto market merely acted as a catalyst—the core issue is that buyers no longer have the strength to defend higher price levels.
On the H4 chart, price behavior is very telling. SOL broke the ascending trendline, rallied for a retest, and was aggressively rejected around the 133–134 zone, a textbook setup for a developing downtrend. The highlighted areas on the chart make it obvious: each bounce is simply an opportunity for sellers to distribute more, with no signs of absorption or accumulation. Lower highs followed by increasingly pressured lows—the market’s message is loud and clear.
The key level to watch now lies around 122–123. This is not a random target, but a zone where SOL previously built strong accumulation. Given the current downside momentum, a liquidity sweep into this area is increasingly likely, unless a powerful, broad-based reversal across the crypto market emerges—something that has yet to materialize.

Bitcoin Faces Risk-Off: Short-Term Pullback Ahead?In the current environment, BTCUSDT is under short-term corrective pressure as overall market sentiment shifts toward a risk-off stance. Ongoing economic and geopolitical concerns have prompted capital to temporarily move away from risk assets, and Bitcoin is no exception. This explains the price weakness seen over the past 24 hours.
On the other hand, capital inflows into spot Bitcoin ETFs remain positive, providing an important layer of support for the market. This factor has helped prevent aggressive selling, suggesting that the current move is more of a technical pullback than a broad-based sell-off following the previous rally.
In the short term, the higher-probability scenario is for BTCUSDT to move sideways to slightly lower, unless market sentiment clearly shifts back to risk-on. If price manages to hold key support levels, a technical rebound remains possible; however, a clean break below support could open the door to deeper short-term downside.

ETH Sweeps Demand — Reset Before the Next Expansion?ETH has just delivered a sharp sell-off into a clearly defined demand zone, breaking down from the prior upside structure and flushing late buyers. This move looks more like a liquidity reset than a trend reversal, as price is now reacting around a high-interest support area rather than accelerating lower.
The previous accumulation zone has failed, confirming short-term weakness. However, the current reaction inside demand suggests sellers may be losing momentum after the impulsive drop. If ETH holds above the support premium zone, a corrective base could form before price attempts to rotate back toward the 3,27x–3,32x resistance range.
A clean reclaim and acceptance above the former demand-turned-resistance would open the door for a push back into the resistance premium zone near 3,38x–3,40x.
Conversely, failure to hold current support would expose ETH to a deeper pullback toward the 3,05x liquidity zone, completing a full corrective leg before any sustainable upside resumes.
➡️ Key focus: Demand zone reaction and structure shift confirmation.

Bitcoin After the Flush: Structured Recovery or Just a TechnicalOn the BTC/USDT H1 timeframe, price has just completed a textbook distribution-to-expansion sequence, and the current rebound needs to be read very carefully. For most of the session, Bitcoin was capped inside a well-defined accumulation price range around $95,000–$95,600, with price compressing between the EMAs. This behavior signaled order absorption and liquidity engineering, not strength. The failure to hold above the EMA cluster was an early warning that buyers were losing control. That warning was confirmed by the strong bearish expansion candle, which sliced cleanly through the range low and the EMA support a clear range breakdown and distribution confirmation. This move flushed late longs and activated sell-side liquidity, driving price directly into the 92,300–92,600 demand zone, where we now see the first meaningful reaction. The current bounce from this support is technically valid, but structurally it remains corrective, not impulsive. Price has not yet reclaimed the broken range or the EMA, meaning the broader bias is still neutral-to-bearish unless proven otherwise.
Your projected upside path aligns with a multi-step corrective recovery:
- Target 1 (~$93,600): First logical reaction level where short term sellers may defend.
- Target 2 (~$94,600): Former range low /resistance zone this is the key decision area.
- Target 3 (~$95,500): Full range reclaim, which would be required to shift structure back to bullish acceptance.
As long as price trades below $94,600–$95,000, any rally should be treated as a pullback into resistance, not trend continuation. A clean rejection from that zone would favor another leg down or a prolonged consolidation below the range. Only a strong H1 close and acceptance back inside the old accumulation range would invalidate the distribution thesis and open the door for sustained upside.
👉 The bounce is real but the trend is still on trial.
Patience at resistance will reveal whether this is smart money reloading or simply a dead cat bounce after the flush.

Fear vs Greed which actually loses you more moneyWelcome everyone, to another educational article for anyone who wants to grasp the concepts of trading and the trader’s mind.
Today we will look at Fear Vs Greed.
Summary:
Fear and greed, they interlock. They are the two strongest emotions in trading, and in psychology of trading.
A majority of traders blame the market, their broker, their computer. The truth is though, nearly each loss happens because of their own decision making.
Today we will break down:
- What fear and greed really mean in trading
- How each one can cause losses, or continuous losses
- Which emotion actually costs the trader more money
Definitions: Fear in Trading
The emotion “ Fear ” in trading, is a natural response to potential losses, or misses.
It displays itself as:
- Hesitation
- Fear of missing out (Also known as FOMO)
- Doubt
- Anxiety
- Fear of being incorrect
Fear usually causes traders to act too late in the game or not act at all.
This can cause losses.
Definitions: Greed in Trading
The emotion “ Greed ” in trading, is also a natural response. It is the desire for more, than what the set plan allows.
It displays itself as:
- Overtrading
- Breaking Risk Management rules
- Holding trades for too long
- Overleveraging
- Breaking risk management rules
Greed causes the trader to take TO much risk.
Fear and Greed, how they link to Trading Psychology
Both Fear and Greed come from the same place and mind. ( Psychology )
They are natural responses too certain stages of “ Uncertainty ”
- Fear, aims to protect you from the pain of losses.
- Greed, aims to maximize the pleasure from wins.
Neither of which belong in a probability-based environment.
How Traders lose money to FEAR
Fear causes losses in many silent ways.
Traders lose money when fear causes them to:
- Leave valid setups
- Exit trades early
- Miss entries due to multiple losses
- Chasing FOMO prices at the top
Fear is not always passive, but it looks like impulsive buying, driven by the fear of missing out.
Both hesitation and FOMO are just fear based decisions.
How Traders lose money to GREED
Greed causes losses in more “ aggressive ” ways, often a bit more destructive.
Traders lose money when greed causes them to:
- Hold trades with no defined take profit zone, (during short or longs)
- Ignore stop losses when price breaks below
- Increase risk after wins (Ego takes over)
- Overleveraging positions
The emotion of Greed, can convince traders that “ just one more ” or “ a little more ” is worth breaking the plan.
When really, greed blows up the account faster than bad entries every could.
Which loses more money?
The answer depends on the trader.
Some traders lose more from Fear, others.. Greed.
But in the end, the core problem is the same.
Both come from:
- Weak Psychological control
- Lack of discipline
- Poor or ignored risk management
As always, the market doesn’t punish emotions, it punishes emotional behavior.
Same as if it’s to reward, it rewards positive behavior like patience, discipline, psychological control
Final Conclusion | How to Reduce Emotional Losses
Fear and Greed, will forever exist.
The goal is not to terminate them, but to control them.
Ways to reduce these emotional losses are:
- Use demo or paper trading to build confidence without financial pressure
- Trade with money you can afford to lose
- Define risk before entering every trade
- Follow fixed position sizing
- Focus on Process, not profit (Mentioned this in my previous guides)
Imagine the money you trade with, as money that is being burned in front of you.
If you cannot accept that outcome before entering a trade, you should not be in a trade.
Emotions disappear when risk is respected.
I'd like to thank every one of you for your support over the last few months, I greatly appreciate it and I am happy to see that my posts are benefitting most of you during your trading journey.
If you have any questions, or requests for the next post. Let me know in the comments below!

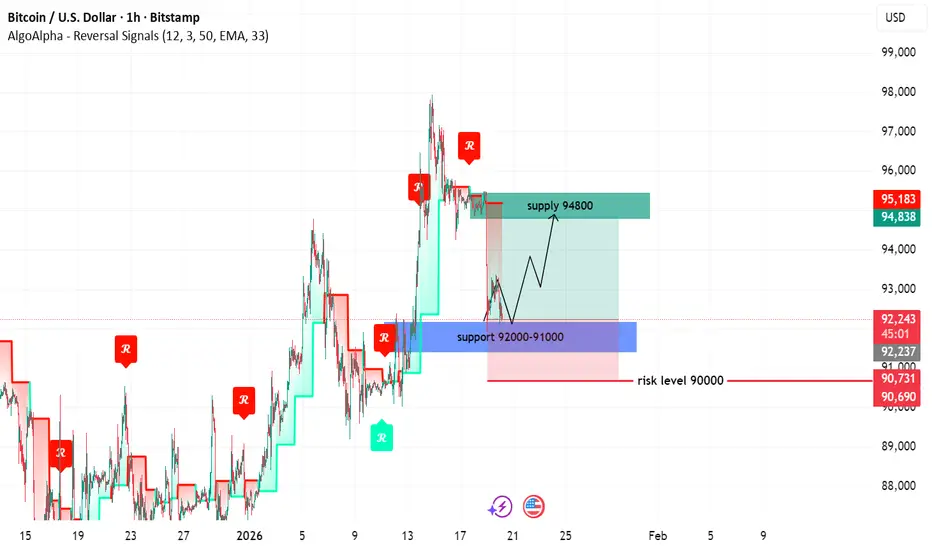
BTCUSD NEXT MOVE (READ CAPTION)Hi trader's what do you think about btcusd
BTCUSD is currently maintaining a bullish market structure, with price holding above a key support zone and buyers remaining active on pullbacks. The overall price action suggests a potential continuation toward higher levels, while risk is clearly defined below.
🔹 Support Zone: 92,000–91,000
This zone represents the primary bullish demand area, where buyers have repeatedly stepped in.
As long as BTC holds above 91,000, the bullish bias remains valid.
🔹 Risk Level: 90,000
This level acts as the invalidation and risk management level.
A sustained break below 90,000 would weaken the bullish setup and signal caution or trend change.
🔹 Supply Zone: 94,800
This is the near-term upside target and supply area.
If bullish momentum continues, price is likely to move toward 94,800, where sellers may attempt to slow the advance or cause short-term rejection.
📈 Market Outlook
Holding above 92,000–91,000 → Bullish continuation expected
Break below 90,000 → Bullish setup invalidated
Upside target → 94,800 supply zone
Overall, the structure supports a bullish pullback followed by continuation, with clearly defined risk control.
please don't forget to live come follow
Bitcoin running to 290k or 440k this yearBitcoin is looking to run up the green trend line until it hits the red resistance line. These are possible paths for when that might occur and the major resistance levels that could stop the rise.
Currently the trend is going quite slow and every time we go up the price is running back into the trend line. The slower this trend goes, and stays closer to the green trend, then the higher we will eventually go before hitting the red resistance. That's why my most likely guess at a reasonable target this year is $440k near the year end. It's possible we could go much higher if the uptrend doesn't venture far from the green trend.
Just keep in mind as we get further and further from the long term trend, which is about a 65% growth every year, the risk of a major correction back to that trend becomes bigger.
Side note, but worth mentioning: Trump is pursuing policies that will continue to devalue and destabilize the Dollar. This is extremely good for Bitcoin. It's always possible with the right conditions Bitcoin could go significantly higher than I'm estimating. Therefore I am not giving targets to open a short position - only targets to close long leverage. The less faith people see in the autonomy of the Federal Reserve the better this is for value flowing into Bitcoin.
Good luck!

BNB USDT Analysis
On the daily timeframe for BNB, I observe that the price is holding above the green trend line. It has recently passed a significant level of resistance/support (marked in pink) and is currently trading above it. For further confirmation, I will be watching for the price to break above the small resistance level indicated in yellow.
Stay Tuned for our next updates!
@SHARP-SHOT

BTC – The Perfect Intersection!I called this area the "perfect intersection" for a reason.
BTC is now reacting around a level where everything lines up:
- the lower blue trendline
- the 90,000 round number
- a clear demand zone
- and prior structure acting as support
When multiple factors meet at one place, I pay attention.
As long as BTC respects this zone, the path remains open for another push higher.
If buyers step in here and defend it, I’ll be looking for continuation rather than guessing tops.
⚠️ Disclaimer: This is not financial advice. Always do your own research and manage risk properly.
📚 Stick to your trading plan regarding entries, risk, and management.
Good luck! 🍀
All Strategies Are Good; If Managed Properly!
~Richard Nasr

ETH – Correction in play, patience matters hereETH did exactly what we were expecting.
Price got rejected from the upper bound of the wedge, and that rejection triggered the correction phase.
Now the focus shifts lower.
As long as ETH holds the lower bound of the wedge, which also aligns nicely with the demand zone, the overall bullish structure remains intact.
I’ll be patiently waiting for trend-following long setups from support, once the market shows clear rejection.
Let the setup come to you...
⚠️ Disclaimer: This is not financial advice. Always do your own research and manage risk properly.
📚 Stick to your trading plan regarding entries, risk, and management.
Good luck! 🍀
All Strategies Are Good; If Managed Properly!
~Richard Nasr

Litecoin 20 -40% move is COMING!!Litecoin 20 -40% move is COMING!!
Price is a range low
all that volume could push LTC to a range high or ven beyond it
at this moment, risk is the lowest

USDT Dominance – Chart Update (4H). USDT Dominance – Chart Update (4H)
• USDT.D is trading below the descending trendline, indicating continued weakness.
• Price is also below the 200 MA and inside/below the Ichimoku cloud → bearish bias remains intact.
• Current consolidation near the horizontal support zone.
Resistance: 6.10% – 6.25% (trendline + MA area)
Support: 5.85% → 5.60%
As long as USDT dominance stays below the trendline, altcoins and BTC remain supportive.
A breakdown below 5.85% can trigger a strong altseason / risk-on move.
Only a strong reclaim above 6.25% would signal temporary risk-off.

No One Is Talking About the Compounding EffectCompounding is the quiet force behind long-term trading performance, yet it receives far less attention than entries, indicators, or win rates. Most traders focus on how much they can make on the next trade. Very few focus on how consistently they can protect capital so growth can stack over time.
Compounding works only when losses are controlled. A small drawdown requires a modest recovery. A large drawdown demands exponential effort just to return to break-even. This is where many traders unknowingly sabotage themselves. They chase higher returns while ignoring how volatility, overexposure, and mistake clustering interrupt the compounding process.
The math is simple, but the behavior is difficult. Consistent gains, even small ones, build on each other. In contrast, irregular large losses reset progress. A trader who averages steady, controlled returns often outperforms one who alternates between big wins and deep drawdowns. The difference is not talent. It is durability.
Compounding is also sensitive to frequency. More trades do not automatically mean faster growth. Each trade carries execution costs, slippage, and decision risk. When frequency increases without a proportional increase in edge, the compounding curve flattens. Fewer, higher-quality trades allow gains to accumulate without being eroded by friction.
Risk scaling plays a critical role. Increasing size because the account grew is logical only when conditions remain supportive.
Scaling during volatility expansion or structural uncertainty increases the chance of giving back compounded gains. Accounts grow fastest when size increases follow stability, not excitement.
Time is another overlooked variable. Compounding rewards patience. It favors traders who stay in the game long enough for probabilities to express themselves. Missing a trade has little impact. Breaking discipline has a lasting one.
The compounding effect does not reward aggression. It rewards consistency, restraint, and respect for risk. Traders who understand this stop measuring success by single trades and start measuring it by how smoothly their equity curve progresses. Over months and years, that mindset separates short bursts of performance from sustainable growth.

qnt looks ready for 150$qnt breaking crucial horizontal area, upon successful breakout it can target descending trendline, and once descending trendline got cleared then it can give rally towards 150 in coming days

$BTC 1D Update: Middle of the RangeBitcoin update.
BTC is still trading in the middle of its higher timeframe range here, so this is not a breakout zone, but I lean bullish overall. Price is holding above the key mid-range support around the low-90s and continues to put in higher lows since the last flush, which suggests buyers are defending value rather than stepping away.
As long as BTC holds this range and doesn’t lose reclaimed support, the path of least resistance remains higher. A clean push back toward the upper range near 108k would be the next meaningful test. Until then, expect chop, but I favor dips over tops while this structure holds.

SUI, volatile, but local uptrend intactCRYPTOCAP:SUI
🎯Price printed a 3 white knight bullish engulfing pattern, reclaiming the daily pivot, now being tested as support. Wave 2 of a new uptrend appears to be underway. Wave 3 has a first target of the daily 200EMA, followed by $3.1
📈 After negating the bearish divergence, daily RSI has unconfirmed hidden bullish divergence forming.
👉 Analysis is invalidated below $1.31, keeping the downtrend alive
Safe trading
