Bitcoin running to 290k or 440k this yearBitcoin is looking to run up the green trend line until it hits the red resistance line. These are possible paths for when that might occur and the major resistance levels that could stop the rise.
Currently the trend is going quite slow and every time we go up the price is running back into the trend line. The slower this trend goes, and stays closer to the green trend, then the higher we will eventually go before hitting the red resistance. That's why my most likely guess at a reasonable target this year is $440k near the year end. It's possible we could go much higher if the uptrend doesn't venture far from the green trend.
Just keep in mind as we get further and further from the long term trend, which is about a 65% growth every year, the risk of a major correction back to that trend becomes bigger.
Side note, but worth mentioning: Trump is pursuing policies that will continue to devalue and destabilize the Dollar. This is extremely good for Bitcoin. It's always possible with the right conditions Bitcoin could go significantly higher than I'm estimating. Therefore I am not giving targets to open a short position - only targets to close long leverage. The less faith people see in the autonomy of the Federal Reserve the better this is for value flowing into Bitcoin.
Good luck!
Crypto

BNB USDT Analysis
On the daily timeframe for BNB, I observe that the price is holding above the green trend line. It has recently passed a significant level of resistance/support (marked in pink) and is currently trading above it. For further confirmation, I will be watching for the price to break above the small resistance level indicated in yellow.
Stay Tuned for our next updates!
@SHARP-SHOT

BTC – The Perfect Intersection!I called this area the "perfect intersection" for a reason.
BTC is now reacting around a level where everything lines up:
- the lower blue trendline
- the 90,000 round number
- a clear demand zone
- and prior structure acting as support
When multiple factors meet at one place, I pay attention.
As long as BTC respects this zone, the path remains open for another push higher.
If buyers step in here and defend it, I’ll be looking for continuation rather than guessing tops.
⚠️ Disclaimer: This is not financial advice. Always do your own research and manage risk properly.
📚 Stick to your trading plan regarding entries, risk, and management.
Good luck! 🍀
All Strategies Are Good; If Managed Properly!
~Richard Nasr

ETH – Correction in play, patience matters hereETH did exactly what we were expecting.
Price got rejected from the upper bound of the wedge, and that rejection triggered the correction phase.
Now the focus shifts lower.
As long as ETH holds the lower bound of the wedge, which also aligns nicely with the demand zone, the overall bullish structure remains intact.
I’ll be patiently waiting for trend-following long setups from support, once the market shows clear rejection.
Let the setup come to you...
⚠️ Disclaimer: This is not financial advice. Always do your own research and manage risk properly.
📚 Stick to your trading plan regarding entries, risk, and management.
Good luck! 🍀
All Strategies Are Good; If Managed Properly!
~Richard Nasr

Litecoin 20 -40% move is COMING!!Litecoin 20 -40% move is COMING!!
Price is a range low
all that volume could push LTC to a range high or ven beyond it
at this moment, risk is the lowest

USDT Dominance – Chart Update (4H). USDT Dominance – Chart Update (4H)
• USDT.D is trading below the descending trendline, indicating continued weakness.
• Price is also below the 200 MA and inside/below the Ichimoku cloud → bearish bias remains intact.
• Current consolidation near the horizontal support zone.
Resistance: 6.10% – 6.25% (trendline + MA area)
Support: 5.85% → 5.60%
As long as USDT dominance stays below the trendline, altcoins and BTC remain supportive.
A breakdown below 5.85% can trigger a strong altseason / risk-on move.
Only a strong reclaim above 6.25% would signal temporary risk-off.

No One Is Talking About the Compounding EffectCompounding is the quiet force behind long-term trading performance, yet it receives far less attention than entries, indicators, or win rates. Most traders focus on how much they can make on the next trade. Very few focus on how consistently they can protect capital so growth can stack over time.
Compounding works only when losses are controlled. A small drawdown requires a modest recovery. A large drawdown demands exponential effort just to return to break-even. This is where many traders unknowingly sabotage themselves. They chase higher returns while ignoring how volatility, overexposure, and mistake clustering interrupt the compounding process.
The math is simple, but the behavior is difficult. Consistent gains, even small ones, build on each other. In contrast, irregular large losses reset progress. A trader who averages steady, controlled returns often outperforms one who alternates between big wins and deep drawdowns. The difference is not talent. It is durability.
Compounding is also sensitive to frequency. More trades do not automatically mean faster growth. Each trade carries execution costs, slippage, and decision risk. When frequency increases without a proportional increase in edge, the compounding curve flattens. Fewer, higher-quality trades allow gains to accumulate without being eroded by friction.
Risk scaling plays a critical role. Increasing size because the account grew is logical only when conditions remain supportive.
Scaling during volatility expansion or structural uncertainty increases the chance of giving back compounded gains. Accounts grow fastest when size increases follow stability, not excitement.
Time is another overlooked variable. Compounding rewards patience. It favors traders who stay in the game long enough for probabilities to express themselves. Missing a trade has little impact. Breaking discipline has a lasting one.
The compounding effect does not reward aggression. It rewards consistency, restraint, and respect for risk. Traders who understand this stop measuring success by single trades and start measuring it by how smoothly their equity curve progresses. Over months and years, that mindset separates short bursts of performance from sustainable growth.

qnt looks ready for 150$qnt breaking crucial horizontal area, upon successful breakout it can target descending trendline, and once descending trendline got cleared then it can give rally towards 150 in coming days

$BTC 1D Update: Middle of the RangeBitcoin update.
BTC is still trading in the middle of its higher timeframe range here, so this is not a breakout zone, but I lean bullish overall. Price is holding above the key mid-range support around the low-90s and continues to put in higher lows since the last flush, which suggests buyers are defending value rather than stepping away.
As long as BTC holds this range and doesn’t lose reclaimed support, the path of least resistance remains higher. A clean push back toward the upper range near 108k would be the next meaningful test. Until then, expect chop, but I favor dips over tops while this structure holds.

SUI, volatile, but local uptrend intactCRYPTOCAP:SUI
🎯Price printed a 3 white knight bullish engulfing pattern, reclaiming the daily pivot, now being tested as support. Wave 2 of a new uptrend appears to be underway. Wave 3 has a first target of the daily 200EMA, followed by $3.1
📈 After negating the bearish divergence, daily RSI has unconfirmed hidden bullish divergence forming.
👉 Analysis is invalidated below $1.31, keeping the downtrend alive
Safe trading

SOL, uptrend intactCRYPTOCAP:SOL
🎯Price caught a bid moving bullishly above the daily pivot, now being tested as support. Wave 2 of a new motif wave appears to be underway with an inital target of the daily 200EMA.
📈 Daily RSI is back to the EQ, restting quickly. A good sign for bullish continuation.
👉 Analysis is invalidated below wave C, $110
Safe trading

ONDO, rekt, fresh low...LSE:ONDO
🎯Price printed a 3 white knight bullish engulfing pattern, jumping above the daily pivot before being rejected hard to fresh lows, keeping the downtrend intact. The 0.786 Fibonacci retracement has been penetrated as price loses the High Volume Node support. S1 pivot is the next target, $0.3.
📈 Daily RSI is showing unconfirmed bullish divergence.
👉 Analysis is invalidated above $0.5 swing high.
Safe trading

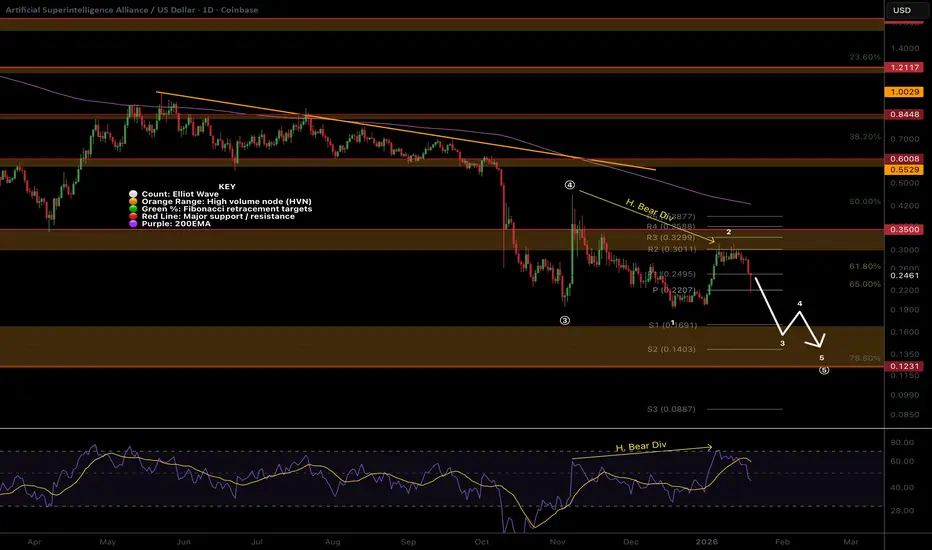
FET looking for new lows, downtrend in tact, h. bear divNYSE:FET
🎯The downtrend is intact, with wave 2 appearing complete. Wave 3 down is strong and hard. Price appears to want to continue lower to test the altCoin golden pocket at 0.786 Fibonacci retracement.
📈 Daily RSI went too high, too fast, and printed hidden bearish divergence at a High Volume node. The rejection was hard and swift.
👉 Analysis is invalidated above wave 2 swing high, $0.3.
Safe trading
ETH, trying to breakout, multiple attempts 200EMA and R1 pivotCRYPTOCAP:ETH
🎯Wave 1 appears to have completed a leading diagonal. Wave 2 appears complete with the recent higher low, but we need to break above wave 1 for confirmation. Price was rejected at the daily 200EMA and R! pivot, but is attempting to break through again. Overcoming this will be very bullish, especially as we are above the daily pivot.
📈 Daily RSI is printed hidden bearish divergence, followed by another bearish divergence. A move above wave (1) is essential to negate this, or prices could head to new local lows.
👉 Analysis is invalidated below wave (2)
Safe trading

DOGE, testing daily pivot as support, not much changed in a weekCRYPTOCAP:DOGE
🎯 Price printed a bullish engulfing 3 white knight candle pattern. It is above the daily pivot, yet testing as support. A critical level to hold. DOGE is still below the daily 200EMA. Overcoming this will be very bullish. The Elliot wave count remains tricky, so I will await more confirmation.
📈 Daily RSI printed bullish divergence, then negated the bearish divergence. The RSI shot up too hard and fast, which often results in a reversal. The reversal took place and tested the daily pivot as suggested last week.
👉 Analysis is invalidated below the swing low, keeping the downtrend alive
Safe trading

BTC bearish divergence negated, 200EMA not yet testedCRYPTOCAP:BTC
🎯The bottom appears to be in as Bitcoin climbs the wall of worry once more. BTC showed strength this week, rejecting just below the daily 200EMA. This isn’t a great sign, I would like to have seen it tested to show strength. Still a possibility from here as price tests resistance, flipped support. Wave (3) appears to be underway; we should expect a strong move in the coming days/weeks. The first resistance will be the daily 200EMA; overcoming this will be bullish. Price is above the daily pivot, showing a bullish trend emerging.
📈 Daily RSI is creeping to overbought, bearish divergence was negated.
👉 Analysis is invalidated below wave (2), bringing up the downside target $76600
Safe trading

AAVE Hidden bearish divergence on the daily playing outEURONEXT:AAVE
🎯 The path from last week’s analysis is being followed, so far. Price printed a bullish engulfing candle breaking above the daily pivot, but was ultimately rejected at the R1 pivot, now testing the daily pivot and High Volume Node as support. The downtrend is intact. The first target for continued upside is the daily 200EMA and High Volume Node resistance at $210. Overcoming the daily 200EMA will add confluence to a major bottom being in. Wave (C) of triangle wave (D) appears to be underway.
📈 Daily RSI printed hidden bearish divergence which is playing out.
👉 Analysis is invalidated if we drop below $148, keeping wave (B) alive.
Safe trading

XAUUSD: Bullish Channel Intact - Upside Toward 4,660 in FocusHello everyone, here is my breakdown of the current XAUUSD setup.
Market Analysis
XAUUSD is trading within a broader bullish structure, supported by a well-defined upward channel that has guided price action from the recent swing lows. Inside this channel, gold has consistently formed higher highs and higher lows, confirming sustained buyer control. During the advance, price experienced several corrective pullbacks, all of which were contained within the channel, highlighting strong demand on dips. As price moved higher, XAUUSD broke above a prior consolidation area and successfully retested the former resistance as support, confirming the strength of the breakout. This area is now marked as a clear Support Zone around 4,570–4,580, which aligns with the mid-channel structure and previous breakout reactions.
Currently, price is consolidating just below a major Resistance Zone near 4,650–4,660, located at the upper boundary of the ascending channel. Multiple tests of this area show hesitation, but there is no clear bearish rejection yet. The price action near resistance appears corrective and controlled, suggesting consolidation rather than distribution. As long as price holds above the key support zone, the bullish structure remains intact.
My Scenario & Strategy
My primary scenario remains bullish while XAUUSD trades above the 4,570–4,580 Support Zone and continues to respect the upward channel structure. A sustained hold above support increases the probability of another attempt to push toward the 4,650–4,660 Resistance Zone. A clean breakout and acceptance above this resistance would confirm bullish continuation and open the door for further upside expansion.
However, a strong rejection from resistance followed by a decisive breakdown below the support zone would weaken the bullish bias and signal a deeper corrective move within the broader structure. Until that happens, market structure favors buyers, with dips into support viewed as potential continuation opportunities.
That's the setup I'm tracking. Thank you for your attention, and always manage your risk.

BERA - Dead Cat Bounce or Bear With a Jetpack?BERA – Dead Cat Bounce or Bear With a Jetpack?
Question of the day:
Can BERA sneak higher while Bitcoin finishes today’s flush and stops acting dramatic?
Short answer: maybe yes, but don’t marry it.
⸻
🧠 The Chart Story (aka Why This Looks Spicy)
BERA already did the classic “new coin goes brrr” move. Big pump, fireworks, CT victory laps.
Then reality checked in.
Price pulled back cleanly to the EMA 50, politely swept liquidity there, and bounced.
For my gameplan, this is chef’s kiss territory. 🍳
Not random. Not chasing. A+ retrace setup.
This is the kind of move where:
• late longs get shaken out,
• stops get harvested,
• and the chart quietly reloads like “round two?”
If BTC stops faceplanting and just behaves like a neutral adult, BERA can move independently for a bit.
⸻
🎯 Trade Plan (Simple, No Hero Mode)
Bias: Cautious LONG
Logic: Trend pullback + liquidity taken + EMA support
Plan:
• Ride the bounce toward TP1
• At TP1:
• Take ~40% off
• Move stop-loss to break-even
• Emotional damage = reduced
• From there:
• Let the rest run
• Manage like a civilized trader, not a dopamine addict
This is not a “YOLO all-in bear market retirement plan.”
This is a structured trade, not a personality trait.
⸻
⚠️ The Big Fat Risk (Read This Twice)
Yes, BERA looks juicy.
Yes, the setup is clean.
But…
🐘 Token unlocks exist.
🐘 And they do not care about your EMA.
There’s a real possibility of unlock-related selling pressure, which means:
• random red candles
• vibes ruined
• Twitter pretending they “knew it all along”
I’m aware of the risk.
I’m choosing to take it with size control and rules, not blind optimism.
⸻
🧬 Fundamentals (Quick Reality Check)
• Mainnet live ✅
• Solid TVL and liquidity ✅
• Strong VC backing ✅
• Trading ~0.88 USD in post-launch chaos 🌪️
Translation:
This is not a dead coin, but also not a safe one.
Perfect conditions for a trade, not an investment thesis.
⸻
🧠 Mental Model
Think of BERA like:
• a strong athlete
• coming out of rehab
• with a scheduled drug test (token unlocks)
It can sprint.
It just might trip randomly.
⸻
🧾 Final Take
• Chart: Bullish pullback setup
• Structure: EMA 50 + liquidity grab
• Plan: TP1 → partial → BE → manage
• Risk: Unlocks can nuke vibes anytime
• Confidence level: Calculated, not cocky
I’ll take the trade.
I’ll respect the stop.
And if unlocks dump it, I won’t tweet “market manipulation.”
Enjoy, bears 🐻📉📈

19/01/26 Weekly OutlookLast weeks high: $97,925.71
Last weeks low: $90,140.82
Midpoint: $94,033.27
So close, yet so far!
After a strong start to the week BTC pushed through the all important $94,000 level with strength and purpose reaching a high of ~$98,000, shy of the bullish target at $100,000. However the resistance approaching that level is clearly strong as price was quickly rejected and pushed towards retesting the $94,000 level.
This coincided with last weeks outlook as the weekly high, after two clear retests price consolidated above the level, price compression takes place and from there the probability of a breakdown increases dramatically. Which is how we have started this week with an aggressive move lower within the opening hour of the week. In essence the bulls are back to square one, trying to flip the $94,000 level.
The bears are still in control on the larger time frame, the Midpoint is the key battleground area once again with whoever controls that line looking to push towards either the weekly high for the bulls or the weekly low for the bears.

BTC Is Stalling at Resistance — Distribution Before the Next Dro1. Current Market Structure
Bitcoin remains in a broader bullish context, but the short-term structure on H1 is showing clear signs of exhaustion. After a strong impulsive rally from the 91K–92K region, price expanded aggressively into the 97.5K–98K resistance zone. Since then, momentum has faded and the market has shifted into sideways-to-lower consolidation, suggesting buyers are no longer in full control. This is not a reversal yet, but it is no longer a clean continuation either.
2. Key Zones & Market Positioning
Major Resistance Zone: 97,600 – 98,000 → Multiple rejections and long upper wicks indicate heavy sell pressure
Immediate Support: 95,700 → Breakdown here would confirm short-term weakness
Dynamic Support (EMA 89): ~94,100
Deeper Support Targets:
- 93,100
- 91,800 (major demand / prior base)
As long as price trades below the resistance zone, upside potential remains capped.
3. Liquidity & Price Behavior
The rally into 98K appears to have swept buy-side liquidity, followed by rejection a classic sign of distribution at the highs. The current choppy price action reflects order absorption, not accumulation. Buyers are defending locally, but without strong follow-through, increasing the probability of a downside rotation.
4. Short-Term Market Scenari os
🔽 Primary Scenario – Bearish Pullback (Higher Probability)
Price fails to reclaim 97.6K–98K
Breakdown below 95.7K confirms distribution
Price rotates toward EMA 89 (~94.1K)
Extension targets: 93.1K → 91.8K
🔼 Alternative Scenario – Bullish Continuation (Lower Probability)
Clean breakout and acceptance above 98K
Strong volume expansion
Opens the path toward higher highs above 100K
Without a confirmed breakout, this scenario remains secondary.
5. Trading Perspective
Bias: Sell rallies into resistance, not chase longs
Best approach: Patience wait for confirmation below support
This is not accumulation at the highs; it is a pause after expansion
Summary
Bitcoin is no longer trending impulsively.
It is stalling at resistance, distributing liquidity, and preparing for a corrective leg.
As long as the 97.6K–98K zone holds, the roadmap remains clear:
Rejection → Breakdown → Pullback to key demand zones.

BTCUSD Facing Rejection at Seller Zone - Short Scenario in PlayHello traders! Here’s my technical outlook on BTCUSD (1H) based on the current chart structure. BTCUSD is currently trading within a broader corrective-to-bearish structure after failing to sustain bullish momentum near the recent highs. Earlier in the session, price moved inside an ascending channel, where higher highs and higher lows suggested temporary buyer control. However, as price approached the major Resistance Level / Seller Zone around 97,100, bullish momentum began to weaken significantly. At this resistance, BTCUSD printed a fake breakout, signaling exhaustion of buyers and strong seller presence. The inability to hold above the Seller Zone marked a local top and triggered a structural reaction. Following this rejection, price started to compress between a descending resistance line and a rising support line, forming a tightening structure that reflects increasing selling pressure and distribution near the highs. Prior to this move, BTCUSD had traded within a well-defined range, where price consolidated before breaking out impulsively to the upside. That breakout led directly into the Seller Zone, but the lack of acceptance above resistance confirms that the breakout was likely a liquidity grab rather than a true continuation. Since then, price has moved back below the resistance level and is now trading under the key intraday structure. Currently, BTCUSD is holding below the Seller Zone (97,100) and failing to reclaim the resistance line, which keeps the short-term bias tilted to the downside. Below current price, the Support Level / Buyer Zone around 93,100 stands out as the next key area of interest. This zone aligns with previous range support and represents a logical TP1 target, where buyers may attempt to step back in. My scenario: as long as BTCUSD remains below the 97,100 Resistance Level and continues to respect the descending resistance structure, the bearish bias remains valid. I expect price to continue lower toward the 93,100 Support Level (TP1). A clean breakdown and acceptance below this support could open the door for a deeper corrective move. However, a strong bullish reclaim and acceptance above the Seller Zone would invalidate the bearish scenario and signal a potential continuation to the upside. For now, market structure favors sellers while price trades below resistance. Please share this idea with your friends and click Boost 🚀

When Capital Flows Back Into CryptoBTCUSDT is still trading within a clear bullish trend, supported by both macro news and solid technical structure.
From a macro perspective, Bitcoin’s recent rally was triggered by the latest Bureau of Labor Statistics report, showing that U.S. inflation remains relatively stable. This has strengthened expectations that the Federal Reserve may begin easing monetary policy later this year, creating a favorable environment for risk assets like Bitcoin. Capital flows have responded positively, with Coinbase shares rising nearly 3% and Strategy gaining over 6%, reflecting growing market confidence.
On the technical side, BTCUSDT continues to move steadily within an ascending price channel on the H12 timeframe. The higher high – higher low structure remains intact, confirming that buyers are still in control. The current pullbacks are corrective in nature and do not threaten the overall bullish structure.
The 92,500 USDT area is acting as a key support zone. As long as price holds above this level, the preferred scenario remains a continuation toward 98,300 USDT, with the psychological 100,000 USDT level as a potential next target in the near term.
