ETH/USDT: Holding Above 3,000 as Bulls Eye 3,300 ReboundETHUSDT is stabilizing after a sharp drop, finding support near the key 3,000 psychological level and respecting the rising trendline. Despite the recent sell-off, the structure remains bullish with higher lows intact, signaling accumulation rather than distribution.
As long as ETH holds above the 3,000–3,050 zone, a recovery toward 3,300 remains likely. A breakout above that resistance could open further upside.
➡️ Primary scenario: support holds → recovery toward 3,300
❗️ Risk scenario: breakdown below 3,000 could trigger deeper pullback toward 2,900.
Crypto

The RENDER Chart Is Quietly Turning Constructive Again* The Render price looks like it’s settling down after the dip, with buyers starting to step in and defend higher levels.
* On-chain data indicates this move isn’t driven by panic or hype, but by a market that’s slowly finding balance again.
* Support and resistance zones are becoming clearer, which usually matters most right before the next meaningful move.
When you step back and look at what Render has been doing lately, the mood feels very different from before. There is no panic, no sudden plunge, no sensation of a market making a run for the exits.
After its bounce from the lower levels, it seems that the RENDER price has stopped moving downwards and has started moving in a horizontal fashion.
Over the last period, the Render price has stayed inside a fairly tight range. That kind of action can feel frustrating if you’re expecting quick follow-through. Volume cools off, momentum fades, and attention drifts because nothing dramatic seems to be happening.
But this is actually the part that matters. Render isn’t slipping back into its old downtrend. When price dips, buyers show up. When it moves higher, it pauses at resistance. Sellers aren’t pressing anymore, and buyers aren’t chasing.
What you’re seeing is balance, and balance often appears when a market is adjusting after a structural shift. This behavior is typical early in trend changes. Markets rarely move straight up after long declines. They pause, compress, and force patience before making their next decision.
On-chain data supports that view. Render’s market cap isn’t bleeding during this sideways phase. It’s holding steady, which suggests capital isn’t leaving the market.
What’s next for RENDER?
From here, structure matters more than hype. As long as the RENDER price holds higher support while grinding under resistance, the setup stays constructive. Render is quiet right now, but that kind of calm is often what shows up before a meaningful move.

BTC/USDT | A massive drop! (READ THE CAPTION)In the 4H chart of BTCUSDT we can see that after reaching 94,789 level and sweeping the liquidity there, BTC experienced a massive drop all the way to 89,641 and hitting the IFVG High, it has retraced and it is now being traded at 90,600. For the time being, these are the targets for BTCUSDT: 91,200, 91,700, 92,200 and 92,700.

Ethereum at a Structural Pivot: Continuation Reload 📊 MARKET STRUCTURE & PRICE ACTION OVERVIEW
Ethereum remains in a broader bullish market structure, characterized by higher highs and higher lows following a strong impulsive advance. After the expansion leg, price transitioned into a range-bound consolidation, reflecting temporary equilibrium between buyers and sellers rather than trend exhaustion.
Multiple attempts to push higher were met with sharp reactions, suggesting active supply near the highs, yet downside momentum has remained limited. This behavior indicates that sellers are reacting, but have not taken control of structure.
The market is now coiling within a defined support–resistance box, preparing for its next expansion phase.
🟦 SUPPLY & DEMAND – KEY ZONES
Key Resistance Zone:
The 3,300–3,310 area acts as a clear supply cap, where prior bullish momentum stalled and aggressive selling emerged. This zone represents institutional selling pressure and remains the level bulls must reclaim for continuation.
Primary Demand / Support:
The 3,240 zone is a critical demand area, aligning with:
Previous breakout structure
Horizontal support
Rising EMA (dynamic demand)
Secondary Demand:
Below that, 3,215–3,220 serves as deeper demand and structure protection. A move into this area would still be considered corrective unless followed by acceptance below.
🎯 CURRENT MARKET POSITION
Currently, ETH is trading near the lower boundary of its consolidation range, sitting directly above demand. This places price at a decision point, where buyers are expected to defend structure if the bullish trend is to remain valid.
The absence of strong bearish follow-through on recent pullbacks suggests selling pressure is corrective, not impulsive.
🧠 MY SCENARIO
As long as Ethereum holds above the 3,240 support zone, the broader bullish structure remains intact, and current price action can be treated as a corrective pullback within an uptrend. A sustained bounce from demand would likely lead to another test of the 3,300–3,310 resistance, and acceptance above this zone could open the door for continuation toward higher highs.
However, a clean breakdown and hourly acceptance below 3,240 would weaken bullish control and signal a deeper retracement toward the 3,215 demand zone. Only a failure to hold that lower demand would suggest a more meaningful structural shift.
For now, Ethereum remains in compression, not reversal.
⚠️ RISK NOTE
Price is sitting at a critical structural level. Wait for confirmation, respect key zones, and always manage your risk.

ETH/USDT | new ATH ahead in 6 Months! (READ THE CAPTION)Ethereum rallied to $3,300 and is currently attempting to hold above this level. If price stabilizes above $3,300 within the next 24 hours, the next short-term targets are $3,450 and $3,620. A clean break above $3,620 could accelerate momentum toward $3,850 and $4,000. The $2,100–$2,700 demand zone remains a strong institutional support, and as long as Ethereum stays above it, the medium-term outlook remains bullish with a high probability of reaching a new all-time high in the first half of the year.
Please support me with your likes and comments to motivate me to share more analysis with you and share your opinion about the possible trend of this chart with me !
Best Regards , Arman Shaban

ADA – BTC-Driven Upside ScenarioContext:
ADA remains largely beta to BTC. Any impulsive move toward BTC 100k—especially on favorable macro—creates a window for sympathetic upside on ADA. This is a conditional trade, fully dependent on BTC follow-through.
⸻
Macro Backdrop
• Current macros look constructive, but not confirmed yet
• NFP (Friday) is the key volatility catalyst
• Outcome-dependent scenario:
• Better-than-expected NFP: Risk-on spike → BTC momentum continuation
• Hot / disappointing NFP: Risk-off → BTC upside invalidated quickly
➡️ This is a “wait-for-confirmation” macro environment, not front-run blindly.
⸻
BTC → ADA Transmission
• BTC pushing 100k = headline momentum + liquidity expansion
• ADA historically reacts with:
• Delayed impulse
• Higher % move than BTC once triggered
• No independent ADA catalyst → pure correlation trade
➡️ BTC moves first, ADA follows if liquidity spills.
⸻
ADA Price Action Thesis
• ADA currently in compression / reactive mode
• No breakout yet → setup, not signal
• Trigger conditions:
• BTC acceptance above local highs
• Volume expansion on BTC spot
Without BTC confirmation → no trade
⸻
Execution Framework
• 🟡 Pre-NFP: Observe only, no size
• 🟢 Post-NFP (Bullish):
• BTC impulsive move → look for ADA momentum entry
• Target = relative expansion vs BTC (beta play)
• 🔴 Post-NFP (Bearish / Mixed):
• Thesis cancelled
• Stand down, reassess next week
⸻
Risk Notes
• This is event-driven, not technical-only
• ADA underperforms if:
• BTC spikes and instantly fades
• Macro creates volatility without direction
• Avoid leverage before NFP
⸻
Verdict
ADA upside is real—but conditional.
If NFP supports risk-on and BTC accelerates toward 100k, ADA likely follows with a lagged expansion move.
Until then: patience > prediction.

LINKUSDT: long setup from daily resistance at 13.355Regarding BINANCE:LINKUSDT.P the level of 13.355 (formed on Dec 5) has been identified. Look at how precisely the price hit it today.
However, the asset has already covered nearly twice its average daily range compared to the last two weeks. Due to this, the probability of a breakout drops slightly — the asset might simply lack the energy to break through.
Nevertheless, the clear confirmation of this level means it is definitely worth watching. If a clean entry point forms, specifically with low volatility right in front of the level, that will be a signal for a Long.
The scenario I expect:
Volatility contraction on approach
Momentum stall at the level
Prolonged consolidation │ Довга консолідація
Closing near the level
Closing near the bar's extreme
The chart displays negative factors:
Yesterday's bar closed far from the level
Was this analysis helpful? Leave your thoughts in the comments and follow to see more.

TON/USDT | TON Coin Rallying Over 20%, Bullish Momentum ContinueCRYPTOCAP:TON has surged from $1.65 to $1.95, delivering over 20% return since our last analysis. Price has held above the key $1.58 level and is now pushing aggressively higher, confirming short-term bullish momentum.
If strength continues, next bullish targets to watch are $2.07, $2.22, $2.38, and $2.60.
Please support me with your likes and comments to motivate me to share more analysis with you and share your opinion about the possible trend of this chart with me !
Best Regards , Arman Shaban

SUI Pullback Setup – Eyeing the Next Leg UpSUI has rallied impressively from the ~$1.40 area into strong resistance at $2.00. This move confirms bullish strength, but we’re now seeing signs of exhaustion near this resistance zone. A short-term pullback is expected, which could offer a better entry point for the next leg higher.
📍 Entry Zone: Watching for a dip toward $1.65, which aligns with potential support from previous structure and could act as a launchpad for buyers to re-enter.
🎯 Targets:
• TP1: $2.20 – $2.50
• TP2: $3.00 – $3.30
❌ Stop-Loss: Just below $1.50, to protect against a deeper correction or invalidation of the bullish setup.

BTC/USDT | More Bullish Move Ahead ? Let's See!By analyzing the CRYPTOCAP:BTC chart on the Daily timeframe, we can now confirm a powerful breakout above previous resistance. Bitcoin surged to $94,800 and is currently trading around $92,500.
If price manages to sustain above the key $90,000 level, the bullish scenario strengthens, and we may see an extension toward higher targets. The next key resistance zones to watch are $97,000, $99,000, $101,400, and $104,000.
The bias has shifted from bearish to bullish, but only if $90K holds as new support. Momentum remains in buyers’ hands as long as structure and volume confirm this shift.
Please support me with your likes and comments to motivate me to share more analysis with you and share your opinion about the possible trend of this chart with me !
Best Regards , Arman Shaban

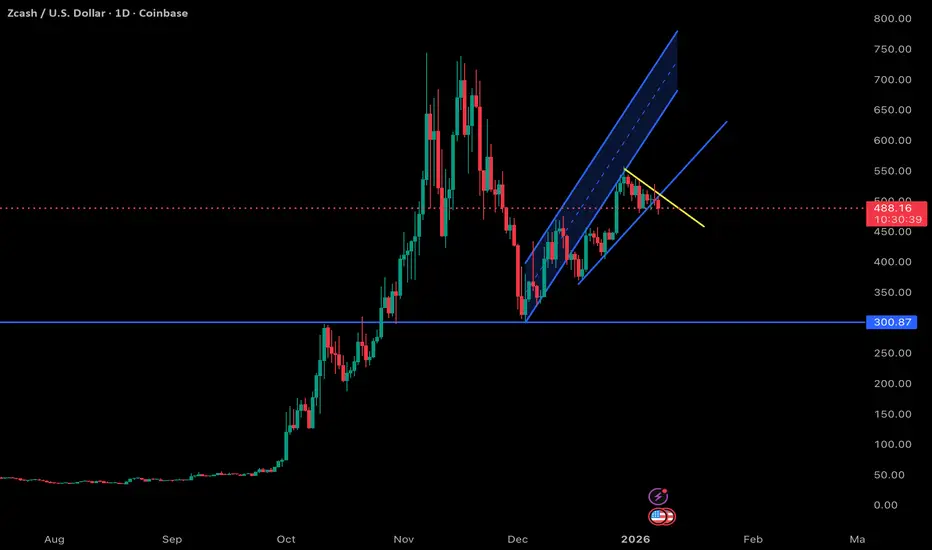
ZEC 1D Update: Bucking the uptrend again ZEC is bucking the uptrend again in the short term, and the price action is starting to look more volatile rather than clean continuation. After riding the rising channel higher, price has rolled over near the upper portion of the structure and is now slipping back toward the mid-range instead of holding the highs.
This kind of behavior usually signals that the market isn’t ready to trend yet. Momentum has cooled, upside follow-through stalled, and price is breaking short-term support, which opens the door for more back-and-forth and potentially another push lower before any sustained move higher develops.
Importantly, this doesn’t break the broader bullish structure. As long as the larger support levels hold, this still looks like digestion after a strong advance rather than a full trend failure. ZEC has a history of being messy before it really starts moving, and this volatility fits that pattern.
My base case here is more chop and possibly lower prices in the near term, shaking out late longs and resetting momentum. If that happens while higher timeframe support remains intact, it likely sets the stage for a stronger move once it finally gets cooking. For now, patience matters more than prediction.
The Robinhood vs. Coinbase War is raging. Is the Battle decided?While Robinhood has certainly been faster at launching traditional banking features, Brian Armstrong has explicitly confirmed a pivot for Coinbase to become a "financial super app" (or "everything app") to directly compete in that same space.
As of late 2025 and early 2026, Armstrong has shifted Coinbase’s narrative from being just a "crypto exchange" to becoming a "bank replacement"
The Coinbase "Everything App" Pivot
In his 2026 roadmap and recent interviews, Armstrong outlined a vision that looks very similar to what Robinhood is building, but powered by blockchain rails:
The "Everything Exchange": In December 2025, Coinbase officially launched tokenized stock trading and prediction markets (via Kalshi) within its main app. They also flagged plans for 24/7 perpetual futures on both crypto and stocks for 2026.
Primary Financial Account: Armstrong stated his goal is for Coinbase to be a "bank replacement" where users handle all spending, savings, and investing. This includes an aggressive push for the Coinbase Card and using stablecoins (USDC) for everyday payments.
On-Chain "Super App": Coinbase recently rebranded its wallet as an "everything app," integrating messaging, social networking, and "mini-apps" that run on its Base network. This model is more akin to China’s WeChat than a traditional US brokerage.
Robinhood currently feels like the "Amazon of Finance" because they already offer the full "Prime" experience (credit cards, 3% IRA matches, and gold subscriptions) using traditional rails.
Coinbase’s counter-argument is that traditional rails are "outdated". Armstrong's bet is that by building the same services on Base (their Layer 2 network), they can offer faster, cheaper, 24/7 global services that Robinhood’s traditional banking partners can't match—like instant 200-millisecond transaction "Flashblocks".
What do you think?

2026 Bitcoin OutlookAs a new year begins, it's time to zoom out and analyze Bitcoins structure going into 2026.
Last month we saw BTC lose the bullish trend that has been supporting price since Q4 2023. Not only is this a worry for the bulls, the way in which this level was lost is more of the problem. No bounce off the level that also coincides with 2025's yearly open shows an exhaustion from the bulls, whereas in the past revisits of the trendline a wick into the level and strong move away continues the rally.
What is being displayed currently is the same in the opposite direction, wicks into the underside of the trendline (resistance) with rejections off the level. Also this trendline resistance coincides with 2025 Yearly open resistance ($93,350).
For me currently, it's clear that the bulls must flip 2025 Yearly open and the trendline reclaim. With the Fed now starting up the money printers again and a fresh year bringing more liquidity, a continuing rate cut cycle and midterms at the end of the year in the US I think it's possible. $108,000/2024's Yearly high would be the natural target, should this be the case it would print a "right shoulder" on a head and shoulders pattern.
However the chart as it stands has the bears in control. Having closed the year as a red candle pushing price below the trendline and maintaining resistance at $94,000. Next stages for the bears would be to push below the 2026 Yearly open which then opens the door to target 2025's Yearly low ($74,500)
In conclusion the targets for both the bulls and the bears are quite clear on the weekly time frame. The bulls certainly need to get back above the trendline, with the Fed QE, Midterms and rate cuts all favor the bulls.
The bears are currently in control and looking very strong structurally so for me in Q1 the bears must do as much damage as possible before the bulls gather momentum into the midterms in Q4.

ADA/USDT | Going higher? (READ THE CAPTION)As you can see in the 4h chart of #ADAUSDT, we can see that after Cardano hit the IFVG High, it dropped in price all the way from 0.4374 to 0.4211, just above the FVG high. Currently ADA is being traded at 0.4160.
The targets are: 0.4180, 0.4193, 0.4205 and 0.4218.

XAUUSD Long: Demand Holds at 4,400 - Push Toward 4,500 in FocusHello traders! Here’s a clear technical breakdown of XAUUSD (2H) based on the current chart structure. XAUUSD previously moved within a steady bullish structure, respecting a rising trend line that supported price during multiple pullbacks. After a strong impulsive rally, Gold transitioned into a consolidation phase, forming a well-defined range that highlighted temporary balance between buyers and sellers. This range eventually resolved to the upside with a breakout, confirming bullish continuation and renewed buyer control.
Currently, XAUUSD is trading between the 4,400 Demand Zone and the 4,500 Supply Zone, with price holding above the rising trend line. This shows that bullish structure is still intact, but price is once again approaching a key resistance area where a reaction is likely.
My scenario: as long as XAUUSD holds above the 4,400 Demand Zone and respects the rising trend line, the broader bullish bias remains valid. A clean breakout and acceptance above the 4,500 Supply Zone would confirm continuation toward higher levels. However, if price is rejected from supply and breaks back below demand, this could trigger a deeper corrective move toward the trend line. For now, price is compressing between demand and supply, and a decisive move is expected soon. Manage your risk!

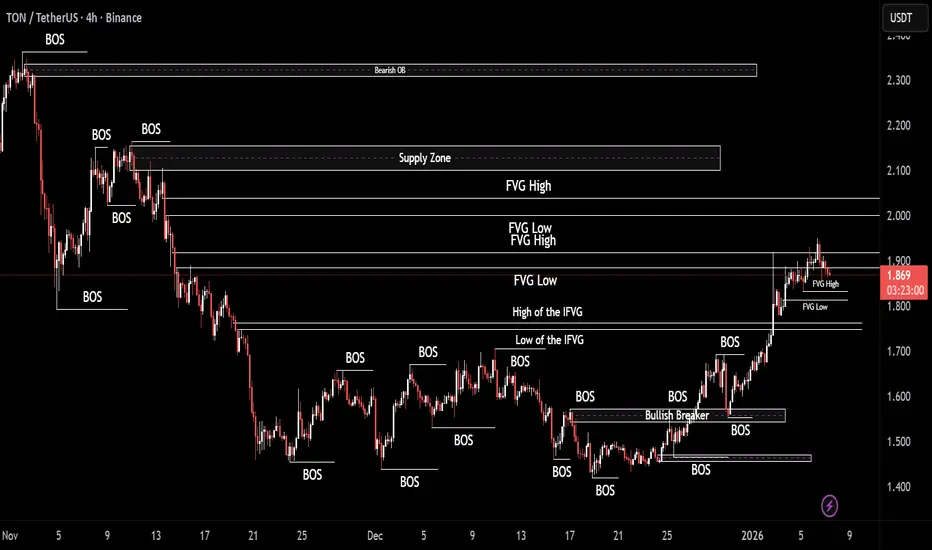
TONUSDT | Where is it headed? (READ THE CAPTION)As you can see in the 4H chart of TONUSDT, yesterday it made it out of the FVG zone, going as high as 1.950, but then it dropped and went below the FVG at 1.852, and currently being traded 1.875. I'd like to see it drop to the FVG High below it at 1.833 to see a reaction.
Bullish targets, if it bounces back up: 1.880, 1.895, 1.910 and 1.925.
If it fails and drops further, the targets are: 1.865, 1.850 and 1.835.
How to audit your own trades like a risk manager would Auditing your trades is not about replaying charts to confirm whether you were right or wrong. A risk manager audits to protect capital durability, reduce mistake frequency, and identify exposures created by process, not emotion. When you adopt this mindset, performance leaks become easy to detect and easier to correct.
A professional audit begins with environment classification. Every trade is labeled by the market phase it was executed in. Volatility is assessed as expanding or compressing. Liquidity incentives are identified before execution, not after it. For example, BTCUSDT and SOLUSDT produce wider candle ranges during expansion and thinner order books when liquidity drains. These are high-invalidation conditions. If you increased size here, you paid an execution tax without a volatility reason. A risk manager never scales into widening ranges. They scale into tightening ranges.
The second step is measuring invalidation distance. Risk officers place stops beyond structure, not arbitrary percentages. A stop below a random 1% or 2% rule means nothing if the structure required 3.5% distance to invalidate the narrative. Your stop must sit beyond the point where the market proves the opposite story. If your invalidation distance widens while volatility expands, that is alignment. If it widens while volatility contracts, that is a process breach.
Next comes execution quality scoring. Professionals deconstruct execution into sequence components: liquidity sweep first, micro-structure break second, displacement third, retest respected fourth, impulse continuation fifth. A trade that triggered on the first touch of a level without displacement is not a good fill. It is the fill the market used for liquidity. Score execution quality based on whether the sequence completed before entry, not whether the P&L was positive.
The fourth layer is correlation risk. Risk auditors measure how many positions were open simultaneously on the same asset or narrative theme. One trade rarely kills a small account. Correlated trades during the same thesis do. Mistake correlation compounds drawdown faster than strategy flaws ever could. Limit correlation by design, not hindsight.
Finally, audit outcomes against process wins. A trade that worked without a reason is not audit approval. A trade that worked because it followed a reasoned sequence is. When you measure behavior instead of candles, you gain intervention points. Intervention points protect capital. Reflection points identify capital already lost.
Small accounts scale when traders audit like capital protection matters more than capturing the entire move. Your audit should produce fewer open questions and more closed rules. The goal is not to defend the trade. The goal is to defend the account.

RSI Is Not a SignalRSI is one of the most widely used tools in trading, yet it is also one of the most misunderstood. Many traders approach it as a switch. When the line reaches a certain level, they expect price to react. When it does not, frustration follows. The issue is not the indicator itself, but the expectations placed on it.
RSI reflects how aggressively price has been moving over a recent period. It gives insight into pressure, participation, and pacing. What it does not do is decide when price should reverse or continue. Markets can remain stretched far longer than most traders anticipate, especially during strong trends. When that happens, RSI staying elevated or depressed is a sign of persistence rather than exhaustion.
Context changes everything. In a clearly trending market, RSI often settles into a higher or lower band and fluctuates within it. Pullbacks that look extreme on the oscillator are often normal pauses in price rather than warnings of a reversal. Traders who react to those readings without considering structure often find themselves trading against the dominant flow.
Range-bound conditions tell a different story. When price rotates between defined highs and lows, momentum naturally fades near the edges. In those environments, RSI extremes tend to align more closely with short-term turning points. The same indicator behaves differently because the market itself is behaving differently.
Another source of confusion comes from fixed thresholds. Levels such as 30 and 70 are treated as universal rules, even though they were never meant to apply across all instruments and conditions. Some markets trend with RSI rarely dropping below 40. Others rotate for weeks without ever reaching classical extremes. Blindly applying static levels removes nuance from decision-making.
RSI becomes useful when it is read as part of a broader process. Structure, liquidity, and location should come first. Momentum then helps assess whether price behavior supports the idea or raises caution. When used this way, RSI adds clarity instead of pressure.
Traders who struggle with RSI are often searching for certainty. RSI does not provide certainty. It provides information. Those who learn to interpret that information within market context stop forcing trades and start aligning with what price is actually doing.

XAUUSD: Buyers Defend Support, Retest of 4,490 ResistanceHello everyone, here is my breakdown of the current XAUUSD setup.
Market Analysis
Gold previously traded under pressure near a descending triangle resistance line, where price action was compressed before buyers stepped in. After forming a solid base, XAUUSD broke above the triangle resistance and confirmed a bullish structural shift. This breakout initiated a steady upside move, supported by a rising trend line and a clear sequence of higher highs and higher lows. Following the initial breakout, price entered a range, signaling temporary consolidation and accumulation. Buyers eventually gained control again, leading to a clean breakout above the range and continuation higher. This move brought gold into the key Resistance Zone around the 4,490–4,520 area, where price was recently tested and met with strong selling pressure.
Currently, after the rejection from resistance, XAUUSD pulled back sharply but found demand near the Support Zone around 4,310, which aligns with a previous breakout level and the rising support line. The current price action shows a corrective pullback rather than a full trend reversal, with buyers stepping in to defend this support area. The structure remains constructive as long as price holds above this key demand zone.
My Scenario & Strategy
My primary scenario: as long as XAUUSD holds above the 4,310 Support Zone and respects the rising support line, the bullish bias remains intact. I expect buyers to continue defending this area and attempt another push toward the 4,490 Resistance Zone as the next upside objective.
However, a decisive breakdown below support would weaken the bullish structure and open the door for a deeper corrective move. Until that happens, the overall structure favors continuation to the upside after consolidation.
That’s the setup I’m tracking. Thank you for your attention, and always manage your risk.

EURUSD Breakdown Confirmed, 1.1640 Support in FocusHello traders! Here’s my technical outlook on EURUSD (2H) based on the current chart structure. EURUSD initially traded within a well-defined ascending channel, showing a strong bullish structure with higher highs and higher lows after the market started to grow from the lower levels. This bullish phase reflected steady buyer control, supported by a rising support line and multiple clean reactions along the channel structure. Eventually, price broke above the channel resistance, signaling momentum expansion. Following the breakout, EURUSD entered a clear range, where price consolidated between key highs and lows, indicating temporary balance between buyers and sellers. Multiple internal reactions and false moves within this range highlighted uncertainty and distribution near the highs. After topping out, price turned around and transitioned into a short-term descending channel, marking a shift in momentum. During this pullback, EURUSD broke below the range support and the descending channel support, confirming increasing bearish pressure. Price is now trading below the Resistance Level near 1.1720, which aligns with the former breakout area and the Seller Zone, reinforcing it as a strong supply region. The recent breakout below this level suggests sellers are gaining control in the short term. Currently, price is reacting around the Buyer Zone near the Support Level around 1.1670. This area aligns with prior demand and has already produced a small bounce, indicating potential short-term reaction. However, the overall structure remains corrective within the broader move. My scenario: as long as EURUSD remains below the 1.1720 Resistance Level, bearish pressure is likely to persist, with TP1 targeting the 1.1640 Support Level. A clear breakdown below support would open the door for further downside continuation. Conversely, a strong reclaim and acceptance back above resistance would invalidate the bearish bias and signal a potential trend shift. For now, price is at a key decision zone where sellers hold the advantage while support is being tested. Please share this idea with your friends and click Boost 🚀

BTCUSDT - Upper-Range FadeA) Market Summary
BTC is spending the morning hovering around 88.6–88.9k, basically doing cardio without going anywhere.
Intraday range so far: 87.5k low → 88.9k high, slightly green day after yesterday’s close near 88k.
The vibe?
👉 Post-New-Year indecision.
👉 Everyone waiting for a breakout…
👉 90k still acting like a bouncer with a very strict guest list.
Below 87k sits the first “oh no” intraday support. Until one of these breaks, BTC is just ping-ponging inside the box.
⸻
B) Trade Decision
✅ Intraday trade available
Yes, we trade boredom too.
⸻
C) Setup – Range Fade Short @ 88.9–89.3k
Because when the market refuses to trend, you fade the edges.
• Direction: Short
(mean-reversion, not a heroic top call)
• Entry (limit): 88,900 – 89,300
(aka “just below where Twitter gets bullish”)
• Stop-loss: 90,200
(Above short-liq heaven and fake-breakout territory)
• Take-profit:
• TP1: 88,000 (pay yourself, feel good)
• TP2: 87,400 (pay yourself again, feel smarter)
• R:R: ~1 : 2.0 – 1 : 2.5
• Time validity: Today only, until end of US session (~22:00 CET)
After that → this trade turns into a pumpkin 🎃
⸻
D) Trade Logic (Why This Isn’t Random Gambling)
Macro context
• No FOMC. No NFP. No Powell jump-scares.
• Post-holiday sentiment is mildly optimistic, but not “send it” bullish.
• Translation: price respects levels, not headlines.
⸻
Market structure & liquidity
• BTC has been stuck between ~87k support and ~90k resistance for days.
• Today’s high at 88.9k sits right under the 90k short-liq danger zone.
• Until 87.5k breaks, structure = range, not trend.
This setup is simply:
👉 Sell the ceiling,
👉 Buy it back closer to the floor.
Not sexy. Just effective.
⸻
Derivatives & positioning
• BTC futures open interest dropped ~5% into year-end and is only slowly rebuilding.
• This is a post-leverage hangover environment, not a squeeze factory.
• Less fuel for a violent breakout → more room for range fades.
Bonus:
Recent liquidations were not massive, meaning the 90k short-liq cluster is still juicy and untouched.
⸻
Order book – confirmation / warning signs
• Aggregated L2/L3 data shows:
• Asks stacked above 89k
• Real bids waiting lower near 88k → 87.5k
That’s textbook fade conditions.
⚠️ Warning:
• If a fat bid wall suddenly camps at 89k and absorbs everything → this short idea gets demoted to “nice try”.
Right now though, 90k looks more like supply than support.
⸻
E) Invalidation Rules (How Not to Die on a Hill)
Price-based
• Hard invalidation:
• 15M close above 90,200
• Or a fast, impulsive move above 90.5k with volume and no rejection
At that point, this is no longer a fade — it’s a breakout audition.
You exit. You don’t argue.
• If price never reaches 88.9–89.3k → no trade.
Do not short the middle of the range like a bored raccoon.
⸻
Time-based
• Valid only today.
• After 22:00 CET:
• Either TP/SL hit
• Or close manually and sleep like a responsible adult
No overnight “hopium holds”.
⸻
Macro-based
• Surprise ETF headlines, regulation bombs, or major hacks?
• Instantly changes the game.
• In that case: close first, think later.
⸻
Order-book-based
• Strong, persistent bid absorption at 88.9–89.3k → skip or exit.
• Spoof asks above 89k + fast wick rejection → good fade confirmation.
• Clean acceptance above 90k → hands off, no revenge trades

XRPUSD: Important Breakout
XRP violated a significant daily resistance cluster yesterday.
The broken structure turned into an important demand zone now.
With a high probability, the price will go up from there and reach 2.51 level soon.
❤️Please, support my work with like, thank you!❤️
I am part of Trade Nation's Influencer program and receive a monthly fee for using their TradingView charts in my analysis.

BTC - Mid-Bull Chill ModeA) Market Overview
BTC is hanging out in the 92–93k chill zone after doing a classic liquidity wick → emotional damage → immediate recovery move.
Trend is still mid-cycle bullish, ETFs are casually stacking sats (+70M+ weekly), open interest is flexing at ~62B, and bull-market peak indicators are sitting at a comfy 0/30.
Translation:
👉 No top signals. No sirens. No reason to wear a helmet.
⸻
B) Trade Decision
Swing trade available – Long
Yes, we’re still buying dips.
No, we’re not trying to short the cycle top that doesn’t exist yet.
⸻
C) Setup – “Buy the Dip, Not the Drama” Edition
• Direction: Long
• Entry zone: 91,500 – 92,500
• Stop-loss: 90,000 – 90,500 (where bad ideas go to die)
• Targets:
• TP1: 96,000
• TP2: 100,000+ (psychological damage zone)
• Holding period: 1–3 weeks (not a scalp, go touch grass 🌿)
⸻
D) Trade Thesis – Why This Isn’t Hopium
• Cycle & macro:
We’re in a mid-bull expansion phase. Coinglass peak dashboard: 0/30 triggered (historically ~43% when nearing tops).
Payrolls/JOLTS consensus is dovish → risk assets get the green light, not the speeding ticket.
• Market structure:
Clean HTF higher highs & higher lows. The dip under 92k was a liquidity sweep, not a breakdown.
91.5k is behaving like a proper adult support inside an ascending channel.
• Derivatives & leverage:
OI up +6% to ~62B, funding positive but not euphoric.
Big long-liq cluster still chilling below 90k, meaning downside flush potential exists… but upside remains the path of least resistance.
• ETF & on-chain flows:
ETFs printing +70M+ weekly (FBTC leading the charge), treasuries growing, on-chain profit-taking still low.
In other words: institutions are buying, not distributing.
• Order book confirmation:
Heavy bids around 91.5–92k absorbed the wick like a sponge.
No scary ask walls above → buyers are active, not hiding.
⸻
E) Invalidation Conditions – When to Admit You’re Wrong Like an Adult
• Structural:
Daily / 4H close below 90,500 with volume → channel broken, thesis dead, ego humbled.
• Macro-based:
Surprise hawkish US data (ADP/JOLTS smashing expectations) or DXY > 106 → risk-off mode, step aside.
• Order-book-based:
If bids under 91.5k vanish and thick ask walls stack above 92.5k without price progress → buyers tapped out, no dip-buying heroics.
⸻
🧾 TL;DR
BTC dipped, shook out weak hands, and said “we’re fine.”
ETFs are buying. Cycle is intact. Structure is clean.
This is a buy-the-dip swing, not a top-calling competition.
