SHIB: breakout or dead cat bounce? key levels to watchSHIB. Still waiting for this dog to wake up or is it just pretending to be alive? Meme coins have cooled off again according to market chatter, with flows rotating back into majors while SHIB burns keep growing but price refuses to follow. That combo usually means only speculators are left in the game, not real trend buyers.
On the 4H chart price is stuck in a tight range around local support near 0.0000060 after a brutal downtrend, with a staircase of red supply zones right above. RSI is climbing from oversold but still under 50, so it looks more like a relief bounce than a reversal. Volume profile shows the real liquidity sitting slightly higher, so I expect a push up into the 0.0000066–0.0000070 zone first, then sellers to hit it again.
My base plan ✅ wait for price to spike into that supply, watch for rejection wicks and fading RSI, then look for shorts back to 0.0000055–0.0000050. If buyers suddenly punch through and we start closing 4H candles above 0.0000072 with decent volume, I’ll flip to a long idea toward the next red zone higher. I might be wrong, but for me SHIB still looks more like a dead cat bounce setup than the start of a new meme season.
Crypto

EURUSD Long: Demand Support Fuels Potential Upside Move Hello traders! Here’s a clear technical breakdown of EURUSD (3H) based on the current chart structure. EURUSD previously traded within a well-defined consolidation range, where price moved sideways for a prolonged period, signaling temporary equilibrium between buyers and sellers and gradual liquidity buildup. This ranging phase eventually resolved to the downside, leading to a sustained bearish move that developed into a clean descending channel, characterized by consistent lower highs and lower lows. Price respected the channel structure well, confirming controlled bearish pressure rather than panic selling. The decline culminated at a clear pivot low, where selling momentum weakened and buyers began to step in, triggering a structural shift. Following this pivot point, EURUSD broke out above the descending channel resistance, initiating a sharp bullish impulsive move. This rally reclaimed key levels and pushed price into the former Supply Zone around 1.1860–1.1870, where bullish momentum stalled.
Currently, EURUSD is consolidating above the Demand Zone and along the rising Demand Line, suggesting that the pullback is corrective rather than the start of a new bearish trend. Multiple reactions from this demand area indicate active buyer interest and defense of the level. As long as price continues to hold above the Demand Zone and respects the rising demand structure, the broader bias remains cautiously bullish.
My primary scenario favors upside continuation after consolidation. A successful hold above demand opens the door for a push back toward the 1.1870 Supply Zone (TP1), which represents the first major upside objective and a logical area for partial profit-taking. A clean breakout and acceptance above this supply level would confirm bullish continuation and signal potential expansion toward higher highs. On the other hand, a decisive breakdown and acceptance below the Demand Zone and the rising demand line would invalidate the bullish recovery scenario and signal a deeper corrective move. Until such confirmation appears, current market structure suggests balance with a bullish continuation bias from demand. Manage your risk!

Bitcoin Back Above $70,000. Here Are Key Levels to Watch NowA trip to $60,000 and back before coffee.
Bitcoin BITSTAMP:BTCUSD spent the end of last week doing what it does best: reminding traders that fire-breathing dragons aren’t in fairytales only.
After a sharp drop to $60,033 on Thursday torched thousands of long positions, the world’s largest cryptocurrency bounced hard. By Friday, it had clawed its way back above $70,000. Still, that dip was the orange coin’s lowest level since October 2024 and roughly 52% below last year’s record of $126,000 .
By Monday morning, Bitcoin looked almost calm. It hovered around $70,700, barely changed on the day. The contrast with last week’s price action felt dramatic. Bitcoin rarely travels in straight lines, and this was another reminder.
🤔 Buy the Dip or Declare It Gone?
As always, opinions split fast. Some traders rushed to declare Bitcoin’s demise (for the 463th time – there’s a website for that ). Others quietly loaded up, calling the move a classic paper-hands shakeout.
Markets, by nature, lean optimistic. The real question is whether optimism has enough fuel to pull Bitcoin out of its recent slump and into a renewed upside phase. The bounce has been impressive, an 18% upswing, but conviction remains fragile.
🌪️ Volatility Is a Feature, Not a Bug
Extreme volatility comes with the territory. Bitcoin’s slide from a $126,000 peak in October arrived despite a crypto-friendly White House and accelerating institutional adoption.
For some investors, that raised uncomfortable questions about Bitcoin’s role during periods of geopolitical stress.
Digital gold? Perhaps. Perfect hedge? That debate remains open.
🧊 The Market Finds Its Feet, Carefully
The broader crypto market has stabilized, though nerves remain close to the surface and Bitcoin still commands the lion’s share, according to the dominance chart . Traders describe the tone as cautious rather than confident. Or every analyst’s favorite expression: cautious optimism.
One level stands out on everyone’s chart. The $60,000 threshold has emerged as the primary near-term support. It marked the floor of last week’s selloff and remains the line bulls prefer not to revisit anytime soon.
On the upside, $75,000 carries symbolic weight. A sustained break above that zone would strengthen the case that the worst of the bear phase has passed and that buyers are regaining control.
📈 Institutions Quietly Step Back In
While price action grabbed headlines, flows told a quieter story. US Bitcoin exchange-traded funds recorded $221 million in inflows on February 6, suggesting that some investors viewed the selloff as an opportunity rather than a warning sign.
Institutional participation tends to move slowly and deliberately. These flows do not guarantee higher prices, but they add some confidence during moments of stress. For a market built on confidence, that matters.
🧮 The Levels That Matter Now
If Bitcoin is serious about $70,000, attention turns to a handful of technical levels that traders are watching closely.
But before that, let’s talk about the 200-week moving average near $58,000, a level Bitcoin respected during the recent dip. Holding above it keeps the longer-term structure intact.
Next sits the $73,000 to $75,000 zone, an area packed with prior support and resistance. Clearing it convincingly would signal momentum shifting back toward the bulls.
Beyond that, the path opens toward $81,000, a level that could act as the next magnet if sentiment continues to improve.
Again, that is if the OG coin manages to reel itself out of the sub-$70,000 area. The bounce from $60,000 reminded traders that sharp selloffs often attract bargain hunters and dip scoopers.
Off to you : So where do you stand right now? Are you holding your Bitcoin, exploring alternatives, or watching from the sidelines? Share how you are navigating this market in the comments.

BTCUSDT Lower Highs, Lower Lows - Bears in Full ControlHello traders! Here’s my technical outlook on BTCUSDT (3H) based on the current chart structure.BTCUSDT previously traded within a well-defined ascending channel, where price consistently respected both the rising support and resistance lines. This structure reflected a controlled bullish trend with higher highs and higher lows, supported by steady buyer demand. After reaching the upper boundary of the channel, price failed to sustain bullish momentum and formed a clear turning point near the channel resistance. This loss of momentum marked the beginning of a structural shift, as buyers were no longer able to defend higher levels. After the range breakdown, BTC entered a sharp descending channel, characterized by strong impulsive bearish candles and brief, shallow pullbacks. Price respected the descending resistance line well, confirming that sellers remained in control and that each rebound was being sold into. This structure highlights aggressive distribution rather than healthy consolidation. As price accelerated lower, it approached a key Resistance / Seller Zone around the 67,000 area, where previous reactions occurred. Currently, BTC has broken below this Seller Zone and is pushing into the Buyer Zone around the 62,300–63,800 region, which aligns with a major horizontal support level. This area represents the first significant demand zone where buyers may attempt to slow or temporarily halt the decline. The sharp move into this zone suggests strong bearish momentum, but also increases the probability of a short-term reaction or consolidation. My primary scenario favors bearish continuation as long as BTC remains below the broken Seller Zone and continues to respect the descending channel structure. Any pullback toward the 67,000 resistance area is viewed as a potential short opportunity rather than a sign of trend reversal. The first downside objective lies near the 62,300 Support Level (TP1), where partial profits can be considered due to expected demand reaction. However, if BTC shows strong acceptance and sustained buying strength above the Seller Zone, this would weaken the bearish bias and signal a possible deeper corrective phase. Until that happens, structure, trend, and momentum all favor sellers, with the market firmly positioned in a bearish continuation phase. Please share this idea with your friends and click Boost 🚀

GBPUSD –2CHART PATTERN)...GBPUSD –2CHART PATTERN).
Bias: Bullish retracement / reversal 📈
(Fall completed → higher lows forming + trendline pressure)
Buy Zone:
🔹 1.3560 – 1.3520
Targets:
🎯 TP1: 1.3620 – 1.3650
🎯 TP2: 1.3720 – 1.3750
🎯 TP3 (Main Target): 1.3880 – 1.3950 🚀
Stop Loss:
❌ Below 1.3470
Notes:
Strong bounce from demand zone
Corrective move toward descending trendline
Partial profit at TP1 recommended, trail SL after TP1

EURUSD – 1H CHART PATTERN )...EURUSD – 1H CHART PATTERN ).
Bias: Bullish 📈
(Descending trendline breakout + demand zone hold)
Buy Zone:
🔹 1.1820 – 1.1800
Targets:
🎯 TP1: 1.1865 – 1.1880
🎯 TP2: 1.1950 – 1.1970
🎯 TP3 (Main Target): 1.2050 – 1.2100 🚀
Stop Loss:
❌ Below 1.1760
Confirmation Notes:
Strong breakout above trendline
Price holding above demand + Ichimoku cloud support
Bullish structure (higher lows)
📌 Tip:
Book partial at TP1, move SL to breakeven, let runners aim for TP2 & TP3.Bias: Bullish 📈
(Descending trendline breakout + demand zone hold)
Buy Zone:
🔹 1.1820 – 1.1800
Targets:
🎯 TP1: 1.1865 – 1.1880
🎯 TP2: 1.1950 – 1.1970
🎯 TP3 (Main Target): 1.2050 – 1.2100 🚀
Stop Loss:
❌ Below 1.1760
Confirmation Notes:
Strong breakout above trendline
Price holding above demand + Ichimoku cloud support
Bullish structure (higher lows)
📌 Tip:
Book partial at TP1, move SL to breakeven, let runners aim for TP2 & TP3.

Dogecoin (DOGE) Price Analysis: Analyst Predicts a Bounce* Dogecoin is drifting down into a support zone that a lot of analysts are keeping a close eye on for a possible bounce.
* The charts still look weak overall, but the price is stretched enough that a quick rebound wouldn’t be surprising.
* On-chain activity is starting to pick up again, which could mean traders are getting active around these levels.
If you zoom out on Dogecoin right now, the main thing you notice is how tense the chart feels. Not in a hype-filled way, but in that quiet, uncomfortable way markets get when they’re slipping into a level that actually matters.
The DOGE price has started drifting lower, and it’s now sitting around the $0.09 area. That’s the kind of zone where traders stop scrolling and start paying attention. The downtrend is still there, no question, but the move is also getting stretched enough that a sudden bounce wouldn’t be shocking.
On the bigger monthly chart, one level keeps standing out: $0.054. That’s the major support Ali Martinez highlighted, and it’s basically the last serious historical floor beneath the current range. Dogecoin already failed to reclaim levels like $0.157, and it’s been stuck under that mid-range ceiling for a long time.
On-chain activity is starting to pick up again. Active addresses are climbing, transfers are increasing, and that usually happens when price enters a zone where positioning starts to matter. It doesn’t automatically scream accumulation, but it does tell you the network is waking up again near a decision point.
The daily chart fits the same vibe. The DOGE price still looks like a slow bleed lower, almost like a staircase down, with every bounce getting sold under the 100-day moving average. RSI is crushed in the mid-20s, which doesn’t guarantee a reversal, but it does show Dogecoin has been sold hard enough that sharp relief moves can happen fast.
And when you zoom into the 4-hour chart, you can see Dogecoin trying to stabilize after that recent flush. Levels like $0.094 are the first real “prove it” line. If the DOGE price can reclaim that cleanly, the door opens for a grind back toward $0.116 and maybe even $0.128. But if it can’t, then the market stays pointed toward that deeper $0.067–$0.07 support band.

SILVER (XAGUSD) – 1H CHART PATTERN)...SILVER (XAGUSD) – 1H CHART PATTERN).
Bias: Bullish
(Descending trendline breakout + higher lows)
Buy Zone:
🔹 80.00 – 78.70
Targets:
🎯 TP1: 84.00 – 85.00
🎯 TP2: 92.00 – 96.00
🎯 TP3 (Main Target): 118.00 – 120.00 🚀
Stop Loss:
❌ Below 76.50
Notes:
Strong rejection from demand zone
Trendline breakout confirmed
Price holding above Ichimoku cloud = bullish continuation
Book partial profit at TP1, move SL to breakeven

BTCUSD – (1H chart)...BTCUSD – (1H chart).
Bias: Bullish (trendline breakout + consolidation above support)
Buy Zone:
🔹 70,200 – 69,800
Targets:
🎯 TP1: 71,500
🎯 TP2: 73,000
🎯 TP3 (Main Target): 75,000 – 75,500
Invalidation / SL:
❌ Below 69,200 (daily close)
Notes:
Price has broken the descending trendline and is holding above the demand zone.
A clean hold above 70K increases probability toward 75K.
Partial profits recommended at TP1 & TP2, trail stop after TP1.

Bitcoin on critical supportThis area is a very critical support for bitcoin, the last bull market top.
its very likely that bitcoin hold it and continue for a new bull run soon

SOLUSD (2H) chart pattern...SOLUSD (2H) chart pattern.
Market Structure
Strong overall downtrend (lower highs + lower lows).
Price is below the descending trendline.
Current price is consolidating inside a supply / resistance zone (red box).
Ichimoku cloud is above price → bearish pressure intact.
Bias = SELL continuation unless trendline is broken strongly.
🎯 Sell Targets (Primary Scenario) 🔴
Target 1 (TP1)
➡ 82.0 – 80.0
Recent demand
First liquidity pool
Target 2 (TP2)
➡ 75.5 – 74.0
Previous strong rejection area
Matches my marked TARGET POINT
Extended Target (If momentum is strong)
➡ 70.0 – 68.0
❌ Invalidation
A clean 2H close above 92.5–94.0
Break & hold above trendline + cloud = bearish idea fails
📌 Trade Plan Idea
Sell zone: 90.0 – 92.0
SL: Above 95.0
TPs: 82 → 75 → 70
Summary
✅ Trend intact
✅ Supply respected
⚠️ Wait for rejection candle for safest entry

XAUUSD (2H) (chart pattern)...XAUUSD (2H) (chart pattern).
Current Structure
Price bounced strongly from demand (blue arrow).
Market broke the descending trendline → bullish shift.
Now trading inside / just above the red supply zone (key decision area).
🎯 Bullish Targets (Primary Bias) 📈
Target 1 (TP1)
➡ 5,300 – 5,320
First marked TARGET POINT
Previous structure + liquidity resting here
Good partial profit zone
Target 2 (TP2)
➡ 5,480 – 5,520
Upper major resistance
Matches my top projected arrow
Strong sell reaction expected here
❌ Invalidation / Risk
If price closes back below 4,950–4,900, bullish idea weakens.
Below 4,850, structure turns bearish again.
📌 Trading Plan Idea
Buy on pullback near 5,000–4,980
SL: Below 4,880
TPs: 5,300 → 5,500
Bias Summary
✅ Trendline break
✅ Higher low formed
⚠️ Watch reaction inside red zone

ADAUSDT (2H CHART PATTERN) (Bullish)...ADAUSDT (2H CHART PATTERN) (Bullish).
Buy / holding zone:
0.268 – 0.275
Target 1 (near resistance):
0.300 – 0.305
(first supply zone / MY lower target)
Target 2 (main target):
0.330 – 0.335
(major resistance / trend continuation target)
Extended target (only with strong market momentum):
0.350 – 0.360
🛑 Invalidation / Stop idea
Below 0.255 A clean close below this level puts price back under cloud → bullish idea weak.
Bias summary
Above 0.265 → Buy on dips
Break & hold above 0.305 → Fast move toward 0.33+
Below 0.255 → Reassess

Bitcoin weekly—Relief rally (inverted correction) vs bear marketBitcoin just ended a major correction, a classic ABC. It was 53.56% strong (-53.56% from top to bottom).
The last weekly session produced the highest volume on the sell side since March 2024. The last bullish move started August 2024. This volume signal reveals that lower prices are likely in the latter part of 2026. It also reveals that any bullish action that starts now should be short-lived, short-term, and should end in a lower high.
The correction bottom reached $60,000 on a wick. Multiple support levels were pierced. The weekly session close happened at $70,330.
Bitcoin closed below the 0.5 Fib. retracement level in relation to the long-term market cycle, which sits at $70,839, but above the 0.618 level ($57,772). The fact that the 0.618 Fib. retracement level missed completely calls for some sort of relief rally, short-term bullish action.
This opens up two targets mainly right away, without going through too many calculus: 1) The previous high around $98,000 and 2) the 0.382 Fib. retracement level in relation to the current correction, which sits at $85,288. The latter is an easy, high probability target. This is the minimum price Bitcoin will challenge in the coming weeks.
We can speculate about other developments; the wave's size, shape and duration, but this is all irrelevant at this point. The most basic fact that can be extracted from this chart is that Bitcoin is going up as a market reaction to the strong down-move, an inverted correction.
This up-wave is bound to happen regardless of past cycles, ETFs, the news, astrology, moon landing, etc. The chart calls for a relief rally and this is what we will get. The rest is just hocus pocus and much speculative opining.
The most important development on this chart is the most recent move. Its duration was 119 days based on the weekly candles. The inverted correction's duration will happen in relation to this move because the market is reacting to it. The market is reacting to the fact that Bitcoin hit $60,000. To the fact that it pierced several strong long-term support levels but failed to close below them. The market will exploit this and push prices higher.
The inverted correction can last a maximum of 60 days, which is around half the time the duration of the main move.
39% of 119 days gives us 46 days. We are starting to form a picture as to the duration of the relief rally and I think this is enough for today.
While the inverted correction takes place on Bitcoin, the altcoins market will blow up.
Thank you for reading, your continued support is highly appreciated.
If you enjoyed the content, make sure to comment.
Namaste.

XRPUSD – 2H chart pattern)...XRPUSD – 2H chart pattern).
What I see
Strong downtrend earlier, now trendline breakout
Price is holding above Ichimoku cloud support
Current structure = base → accumulation → upside continuation
This supports the bullish targets me marked.
🎯 XRP Targets (Bullish)
Buy / holding zone:
1.42 – 1.48
Target 1 (nearest resistance):
1.65 – 1.70
(previous supply zone + my first blue box)
Target 2 (main target):
1.90 – 1.95
(major resistance + trend continuation)
Extended target (only if market momentum stays strong):
2.05 – 2.10
🛑 Invalidation / Stop idea
Below 1.34 – 1.32 If price goes back under cloud and closes there, bullish bias weakens.
Bias summary
Above 1.40 → Buy on dips
Break & hold above 1.70 → Expect fast move toward 1.90+
Below 1.32 → Reassess

ETHUSD – 2H (Chart pattern)...ETHUSD – 2H (Chart pattern).
What the chart is saying
Overall downtrend (descending trendline).
Price has broken above the trendline and is now holding above Ichimoku support (yellow cloud).
This looks like a trend reversal / pullback-buy structure, not a continuation sell.
Key levels I see
Current zone (buy area):
2,050 – 2,090
(inside the cloud + above broken trendline → good base)
🎯 Targets (Bullish continuation)
Target 1 (safe / partial):
2,300 – 2,350
Target 2 (main):
2,450 – 2,500
Target 3 (extended, only if momentum stays strong):
2,800 – 2,900
These match my marked “target points” on the right side of the chart.
🛑 Invalidation / Stop idea
Below 1,980 – 1,950 If price goes back under the cloud and holds there, bullish idea is weak.
Bias summary
Above 2,050 → Buy on dips
Below 1,950 → Avoid longs / reassess

XLM — ABC Delivered, WCLs Now in PlayPrice has reached the bearish ABC C target on the 4H.
That’s a fact, not a forecast.
What happens next is not guaranteed .
Often after a sequence delivers, price looks for relief and retracement toward nearby liquidity — and in this case, the unreached WCL zones above are the obvious magnets.
But let’s be clear:
ABC delivery ≠ trend reversal
Price can accept the C target and continue lower
Or it can retrace toward WCLs before the next decision point
Both outcomes are valid until price accepts or rejects .
So the framework is simple:
If price retraces into WCL and rejects → bearish continuation remains intact
If price accepts above WCL → bias shifts and the structure changes
No assumptions.
No calling bottoms.
Just reacting to where price shows acceptance.

Early bear market bottom? Kaspa is bullish & ready to grow next!I like Kaspa very much right now and I can no longer say that a lower low is necessary down the road. You know some projects can detach completely from the rest of the market, many projects. This can be one of those.
The truth is that KASUSDT reached as low as July 2023 this week. That's basically an entire bullish cycle completely eradicated, nullified—reset.
What's to like? Where is the good news?
The good news is that Kaspa is trading at bottom prices. A major low came in recently and the week is closing green with a strong volume breakout, the highest volume since November 2025.
It all depends on how this bullish phase develops but a strong rise would reveal the start of a new uptrend. Say, if KASUSDT were to hit $0.19 in the coming months, this would be enough for the ensuing correction to end as a higher low, keeping the chart technically bullish.
Maybe a rise to $0.14 can also support a higher low. On the other hand, if the current move, the one that is starting just now, peaks at only $0.095 then we can expect a major crash right after with new lows, lower lows.
This wouldn't be bad either, it would simply mean better entry prices Q3 2026 in anticipation of years of growth. Remember, after Bitcoin's bear market bottom is in, the market will grow for years to come.
Ok. So Kaspa is bullish and ready to grow next. This is very easy to predict.
Thank you for reading.
Namaste.

TRADOORUSDT.P: long setup from daily resistance at 1.34SETUP SUMMARY
BINANCE:TRADOORUSDT.P has been in accumulation for a long time, forming a U-shaped rounding pattern, and the wider this accumulation, the larger the position built.
The 1.34 level was clearly confirmed by several taps over the last two days, and this is actually very technically played out, as the base of the level was formed back on 15.01.26.
Yesterday's close was not far from the level and near the daily high. Today we pulled back slightly from the level, but over the last few hours, we are approaching it again.
I don't like the occasional volatility spikes, so this needs to be watched. I am waiting for an approach to the level with low volatility, and then a trade is possible.
PRO-THESIS FACTORS:
liquidity vacuum beyond level
volatility contraction on approach
close retest
prolonged consolidation
precise level testing
price compression (Squeeze)
at-level close
extreme close Leave your thoughts on the setup in the comments. Follow this profile to monitor all upcoming ideas.

How Prop Firm Rules Quietly Shape Your Trading BehaviorProp firm rules are usually framed as simple risk controls. Daily drawdowns, maximum loss limits, and consistency requirements appear straightforward on paper. In practice, they do much more than protect capital. They subtly reshape how traders think, feel, and behave in the market.
Every decision inside a funded account is made under the awareness of a hard stop. Losses are not just part of the distribution. They are existential. This creates a constant background pressure that influences execution. Traders hesitate to take valid setups after an early loss, even when conditions are favorable. Others rush into trades to recover equity before the day ends. These reactions are often misdiagnosed as psychological weakness, when they are actually rational responses to the structure.
Daily loss limits are a clear example. They encourage caution, but they also compress decision-making into shorter time windows. Traders may avoid higher-quality setups later in the session because they no longer have room for normal variance. The result is fewer trades taken from fear, or lower-quality trades taken out of urgency.
Trailing drawdown rules add another layer. As equity rises, so does the level at which failure occurs. This encourages early profit-taking and discourages holding positions through normal pullbacks. Traders begin to optimize for equity protection rather than trade quality. Over time, this conditions behavior that may not translate well outside the prop environment.
Consistency rules also influence strategy selection. Traders gravitate toward lower volatility approaches, smaller targets, and frequent trades to smooth equity curves. These choices are logical within the ruleset, but they are responses to constraints rather than pure edge.
Understanding this dynamic is critical. Prop firm performance is not only about strategy and discipline. It is about adapting to an incentive structure. Traders who recognize how rules shape their behavior can adjust expectations, execution, and self-assessment more accurately. The problem is rarely the trader. It is often the environment quietly steering their decisions.

AIOUSDT: short setup from daily support at 0.0700SETUP SUMMARY
BINANCE:AIOUSDT.P is showing anomalous behavior after a very strong drop: instead of a correction, the price has been consolidating all day. Additionally, every high is lower than the previous one (4h TF). Sellers are dominating, and I think this will result in an even stronger drop.
Right now, I am missing a consolidation right at the level on the 5-minute TF. Also, volatility during the level test will be critical for me — it must be low before a true breakout.
Of course, this assumes no market "anarchy" occurs, which is indeed possible right now given the drop in Bitcoin and the rest of the altcoins. This is just something to keep in mind.
PRO-THESIS FACTORS:
trend alignment
liquidity vacuum beyond level
volatility contraction on approach
impulse absorption at the level
close retest
price compression (Squeeze) ADVERSE FACTORS:
no near-level base Leave your thoughts on the setup in the comments. Follow this profile to monitor all upcoming ideas.

$ETH 1W Update: Zoomed out thoughts Ethereum remains constructively bullish on the weekly timeframe despite the recent sell-off, which has brought price back into a major historical demand zone around 2,000–2,100. This area has acted as a long-term pivot multiple times in the past and aligns with prior range support, making the current pullback look corrective rather than trend-breaking. ETH has rejected from the upper resistance at 4,700, but the broader structure still resembles a large multi-year range, with price now rotating back toward the lower-mid portion of that range. As long as ETH holds above ~2,000, the higher-timeframe market structure remains intact and favors consolidation followed by continuation. A sustained reclaim of 2,726, then 3,488, would signal momentum recovery and open the door for a renewed push toward range highs. Failure to hold the 2k region would weaken the bullish thesis, but at present this move fits a standard bull-market retracement, with patience favored while ETH builds a base at support.

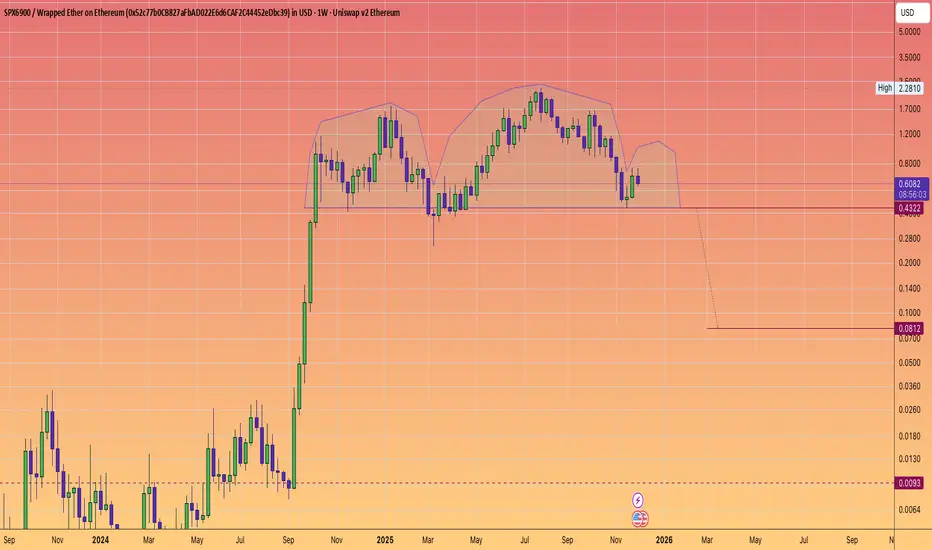
SPX6900 The meme with no community and doomed to crash.The S&P500 is at 6900
so why hold a memecoin for a target that has already been met.
SELL!
SELL!
SELL!
In true Cramer fashion :)
You will be glad you did if you are still holding, hoping and praying.