Solana (SOL/USDT) – 4H Technical AnalysisSolana is currently consolidating within a tight range after failing to sustain momentum above the short-term moving averages. Price continues to trade below the 200-EMA, which keeps the broader 4H trend tilted to the bearish side.
Key Levels
Immediate Resistance:
$135–136 zone where price recently faced multiple rejections.
Short-term EMAs are also flattening near this region, creating additional overhead pressure.
Major Supply Zone:
$168–175 (highlighted red area).
This remains a strong higher-timeframe resistance where sellers previously dominated.
Immediate Support:
$128–130 (blue demand zone).
Price rebounded from here several times, showing active buyers.
Market Structure
Price attempted a short-lived recovery but failed to break above the 200-EMA. The market is forming lower highs, indicating weakening bullish attempts. Unless SOL makes a decisive close above the $135–136 region, upside continuation remains limited.
A sweep of liquidity into the $128–130 support zone is still possible, especially if momentum weakens further.
RSI Momentum
The RSI is hovering around the mid-zone (~45–47), reflecting indecision and lack of strong directional momentum.
No major bullish or bearish divergence is present on the current 4H structure.
As long as RSI remains below 50, bulls are not in clear control.
Possible Scenarios
Bullish Case
A clean breakout and 4H close above $136 could open room for a move toward $142–145, followed by a potential retest of the $155–160 region.
However, the 200-EMA overhead means buyers need strong volume to shift structure.
Bearish Case
If price breaks below the $128–130 demand zone, SOL may revisit $122–124, where the next support cluster is visible.
Failure to hold these levels could extend the corrective structure.
Neutral Summary
SOL is currently range-bound between $130–136, with neither side showing strong conviction. Traders may prefer waiting for a breakout from this range or a clearer reaction at the major support zone before taking directional positions.
This analysis is for educational purposes only and reflects general market observations, not financial advice.
Cryptoanalysis

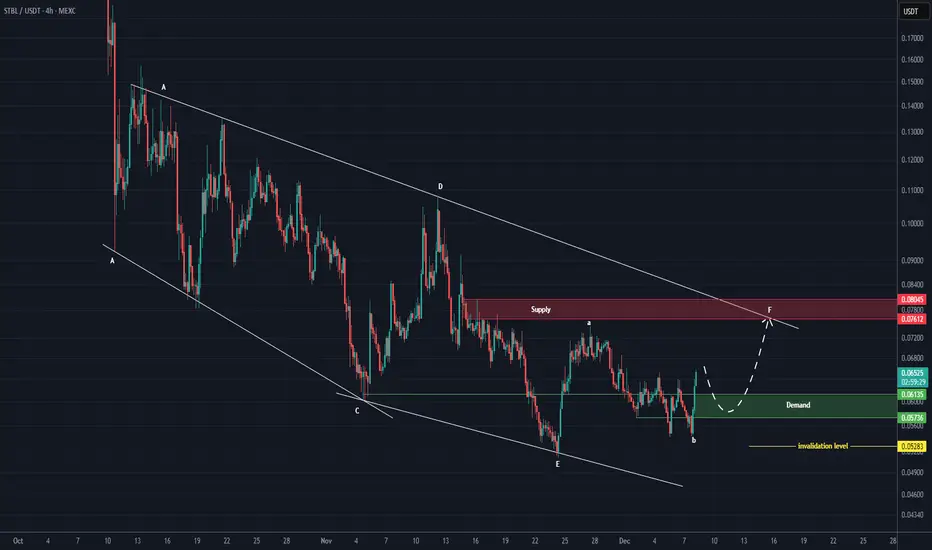
STB Analysis (4H)It seems that the STB coin is in a corrective diametric pattern, and we are currently in wave F of this diametric.
Wave F itself appears to be an ABC structure, and we are now at the end of wave B.
If a pullback forms, a long buy position can be taken at the green zone for the targets of wave B of F.
The targets are marked on the chart.
A daily candle closing below the invalidation level will invalidate this analysis.
For risk management, please don't forget stop loss and capital management
When we reach the first target, save some profit and then change the stop to entry
Comment if you have any questions
Thank You
Sideway but Dangerous – SOL Is About to Choose a Direction!If I had to pick a market that is “walking instead of running”, SOLUSDT is the perfect example right now . Recent news has been mixed: on one hand, ETF flows, staking, and long-term optimism are supportive; on the other hand, broad crypto selling pressure prevents SOL from making a clean breakout. The result: price is stuck in a tight tug-of-war zone , unable to rise strongly but also not breaking down clearly.
On the chart, price is moving inside a sideway box around 2,790 – 3,210 USDT , with the long-term descending trendline and the Ichimoku cloud acting as dynamic resistance. Every time price approaches 3,200, selling pressure emerges, and when price retreats toward 2,800, buying support shows up. This structure signals that SOL is currently in an accumulation – waiting phase, not firmly controlled by bulls or bears.
Given this backdrop, I do not see this as a perfect moment to trade strong trends. Instead, it makes more sense to trade the range : look for bullish reactions around 2,790–2,800 for short-term buys, and consider taking profits when price retests 3,200–3,210. Only if SOL breaks clearly outside one of these boundaries (especially a decisive breakout above the descending trendline) will the situation turn into a true trending market; for now, SOLUSDT remains a sideway market, better approached with range strategies rather than predicting a breakout too early.

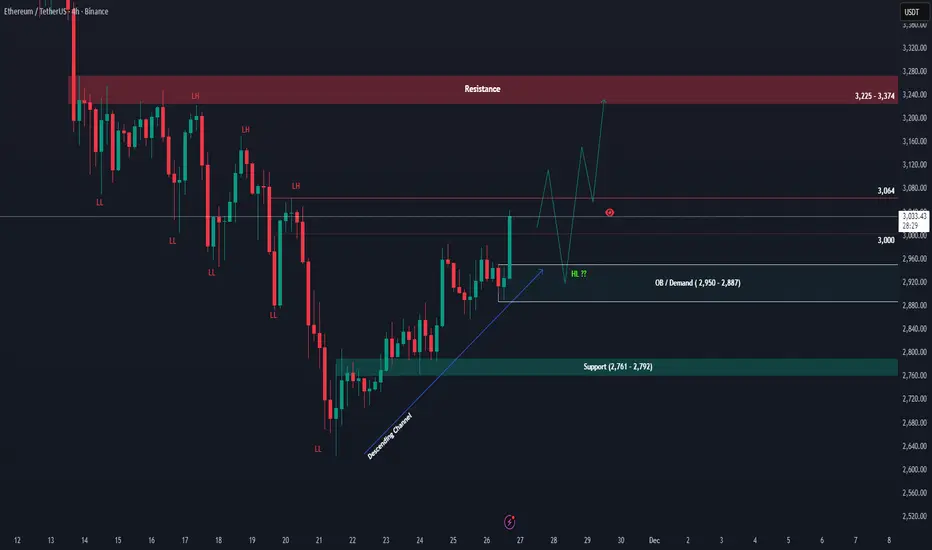
ETH Is Quietly Setting Up a Massive Reversal — Don’t Miss This!ETH 4H & Daily Outlook Update
ETH continues to follow the broader plan we've been watching over the last few days. After tapping the monthly demand zone, price reacted strongly and rebounded from the daily order block, confirming that the higher-timeframe accumulation area is still holding well. This zone remains the key foundation for ETH’s medium-term structure.
On the 4H timeframe, the trend is still technically bearish, with a series of lower highs visible. Price is now testing the supply zone and sitting right around the previous lower low at 3,064. If ETH can break and hold above this level, it would be the first meaningful sign of a trend shift, opening the door for a move toward the major resistance band at 3,225 – 3,374.
If buyers can push higher, a pullback into support or even a revisit of the 2,950 – 2,887 order block is still likely, forming a higher low before continuation. As long as this OB area remains intact, ETH maintains a strong chance to extend upward and retest the resistance zone. But if this OB breaks, the structure weakens and price could slide back toward the deeper support at 2,761 – 2,792.
Overall, ETH returning to the monthly OB was a healthy reset. As long as this region is protected, the higher-timeframe accumulation narrative remains valid.
Stellar (XLM) Approaching a Decision Zone inside the Descending Stellar continues to move inside a broad descending channel, a structure that has been guiding price since the October high. The recent decline found support at the lower boundary of this channel, where buyers stepped in and created a short-term reaction. This zone now acts as an important decision point for the next directional move.
Price is currently retesting a mid-range support cluster that includes the fifty percent and sixty-one point eight percent retracement levels of the latest impulse. This confluence zone often acts as a turning area when paired with a corrective decline inside a channel. If the market holds this level and pushes above the minor trendline resistance, the structure allows room for a broader recovery toward the upper boundary of the channel.
A confirmed breakout from the channel, followed by a successful retest, would open the path toward the mid-term resistance near zero point three one. This level aligns with previous supply and serves as the next major upside objective.
However, failure to hold the current support zone may send Stellar back toward the channel’s lower boundary around the zero point two one region. A breakdown below this area would signal continuation of the descending trend and postpone any meaningful recovery attempts.
Key Technical Notes:
Price remains within a well-defined descending channel on the four-hour timeframe.
Current structure is respecting a support cluster formed by Fibonacci retracements and previous demand.
Break and hold above the minor descending trendline would confirm bullish momentum.
First upside target sits at zero point two six, extended target near zero point three one.
Loss of the support zone exposes zero point two one and below.
Bias:
Neutral until the breakout is confirmed. Balanced risk on both sides with clear invalidation levels.

YB Buy/Long Setup (4H)From the point where we placed the red arrow on the chart, the correction of YBUSDT has begun. It now appears to be in wave C of this correction.
We are looking for buy positions around the green zone.
Targets are marked on the chart.
A daily candle closing below the invalidation level will invalidate this analysis.
For risk management, please don't forget stop loss and capital management
When we reach the first target, save some profit and then change the stop to entry
Comment if you have any questions
Thank You

TAG Analysis (12H)Before anything else, please note that this coin has high volatility.
This coin is completing a bullish structure. The pattern is a bow-tie diametric, and we are currently in its G wave.
In the red zone, the G wave is expected to finish, and we anticipate a drop.
In the red zone, we will be looking for sell/short positions.
Targets are marked on the chart.
A daily candle closing above the invalidation level will invalidate this analysis.
For risk management, please don't forget stop loss and capital management
When we reach the first target, save some profit and then change the stop to entry
Comment if you have any questions
Thank You

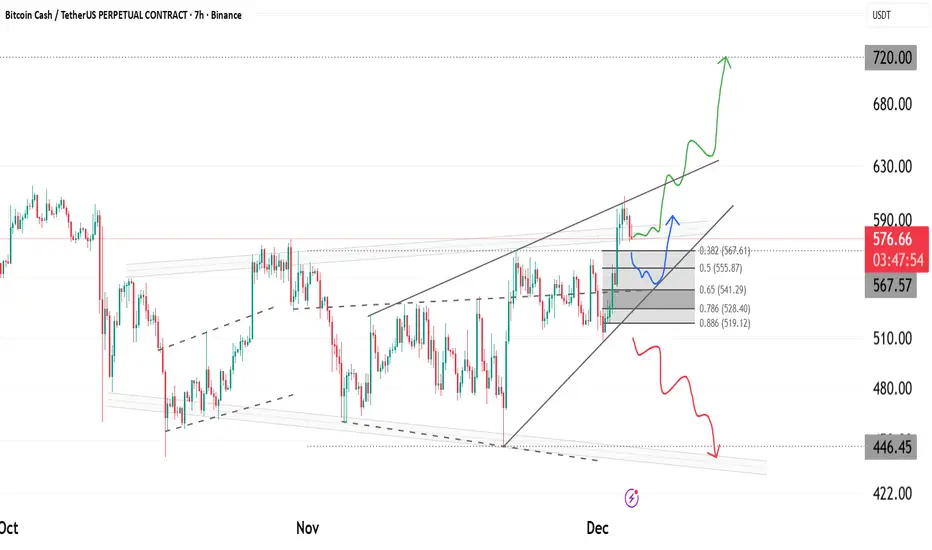
Bitcoin Cash (BCH) Preparing for a Breakout MoveBCH is currently trading inside a rising wedge structure, where price keeps creating higher lows while struggling to clear the upper resistance. This pattern often appears before a decisive expansion in volatility, either as a continuation or as a reversal depending on how the breakout occurs.
Recent price action shows rejection at the upper boundary, followed by a pullback into a fib cluster between 0.382 and 0.786. This zone acts as a short term decision point, where the next directional move is likely to originate.
The market structure remains constructive as long as BCH holds above the rising wedge support. A controlled retracement into the grey demand block keeps the bullish case intact, while a deeper breakdown would shift momentum in favour of sellers.
Key Technical Notes:
• Rising wedge structure guiding current trend
• Clear fib retracement confluence inside the demand block
• Higher lows indicate buyers are still defending structure
• Breakout above the wedge can trigger an impulsive move
• Breakdown from wedge support opens a larger correction
Bullish Scenario:
A bounce from the fib cluster and a breakout above the wedge resistance can open a rapid expansion toward the 720 region. Momentum would accelerate if buyers reclaim the mid channel levels with strength.
Bearish Scenario:
Losing wedge support flips the entire structure short. In that case, BCH may slide toward 446 where major liquidity sits.
In simple terms:
BCH is compressing inside a rising wedge. A breakout means continuation toward 720, while a breakdown exposes 446. Watch the fib cluster for confirmation of direction.
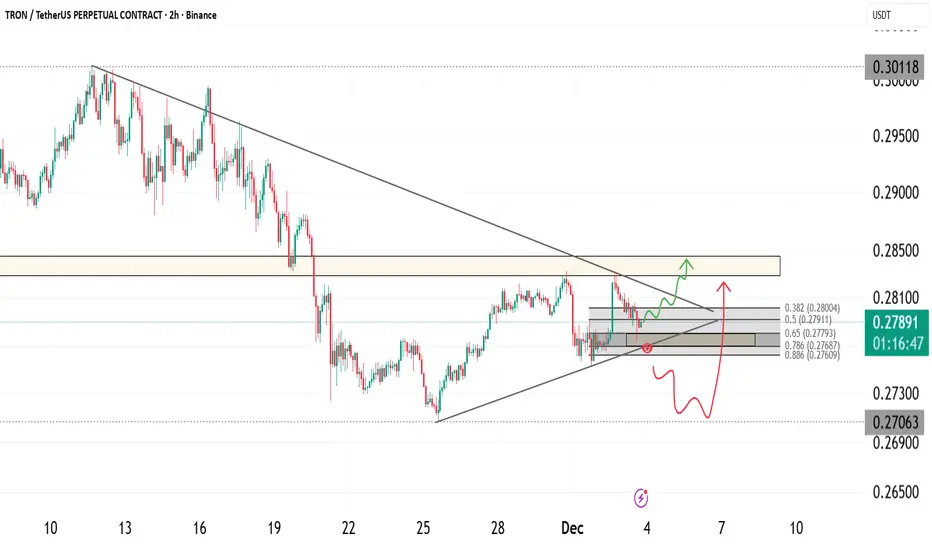
TRX Approaching Key Breakout Zone as Structure TightensTRX is approaching a critical decision point inside a compressing structure where price is being held between diagonal resistance and a rising support line. The market has printed a clean series of higher lows while repeatedly testing the same resistance, suggesting growing pressure beneath the price.
The current reaction inside the grey fib zone shows that buyers are active, and as long as this support holds, TRX can attempt another push into the supply region highlighted above. The behaviour inside this zone will determine whether price continues upward or rejects for a deeper pullback.
The zone around 0.282 to 0.286 is the important breakout region to watch. If price reclaims it, momentum can shift upward rapidly toward the next liquidity pockets.
Key Notes
• Price is compressing into an apex between support and diagonal resistance
• Fib retracement region is holding as intraday support
• Liquidity sits above the 0.282 to 0.286 supply region
• Higher lows suggest accumulation behaviour
Bullish Scenario
If TRX continues to hold the fib support and breaks above 0.282, the structure opens room for a move toward the upper supply zone with potential follow through.
Bearish Scenario
Failure to hold the grey support region can push price back to retest the lower trendline around 0.270.
Invalidation
A clean break and continuation below 0.270 invalidates the bullish setup and delays any potential breakout.
Simple explanation
TRX is squeezing into a decision point. Holding support gives it room to break out. Losing support sends it back to the lower trendline. Watch how price behaves around 0.282 because that level decides everything.
ASTER New Analysis (4H)This analysis is an update of the analysis you see in the "Related publications" section
The supply zone we identified in the previous analysis, after rejecting the price multiple times, was eventually cleared. It was a good order zone, and we marked the touches and rejections with orange circles. However, based on wave structure and price action, we are not buyers at these points.
This wave is very likely an X-wave, and if the price doesn’t drop from the current levels, it will drop from the upper red zone. We will only look for buy opportunities in the green zone.
The buying pressure you see is due to news and marketing around this token, as Binance funders created this coin.
For risk management, please don't forget stop loss and capital management
When we reach the first target, save some profit and then change the stop to entry
Comment if you have any questions
Thank You

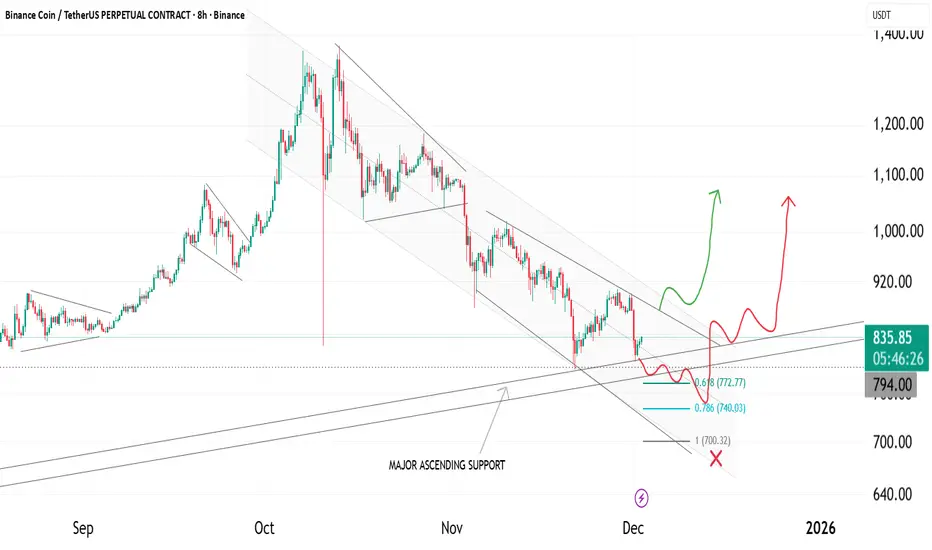
BNB at Make-or-Break Support– Final Sweep or Major Reversal ZoneBNB is approaching a very important area where two major structures meet: the descending channel and the long-term ascending support. This region has historically triggered strong reactions, and price is now retesting it again.
The recent drop pushed BNB directly into the confluence of
• 0.618 fib (772)
• 0.786 fib (740)
• major ascending support
• the bottom of the falling channel
This combination forms a high-value reaction zone where volatility usually expands.
If price holds this zone and reclaims the smaller descending trendline, the market can begin the next corrective leg to the upside. However, failure to hold this support may trigger a deeper sweep before any recovery attempt.
Key Structure Notes
• BNB is trading inside a falling channel
• Price is sitting at a multi-month ascending support
• Fib confluence strengthens the potential for a rebound
• A clean reclaim of the inner trendline would confirm strength
• A breakdown below 740 would invalidate this scenario
Invalidation
A confirmed close below 740 invalidates the bullish recovery idea and opens the door for a deeper move toward 700.
Simple Explanation
BNB is sitting at a major support cluster. If this area holds and the trendline is reclaimed, upside continuation can follow. If it breaks, expect another sweep lower before any meaningful bounce.
SEI Looks Bearish (3D)First of all, pay attention to the timeframe | it’s the 3D timeframe.
It seems that, in the larger view, SEI is within a major corrective pattern, and wave D of this pattern has recently been completed.
It appears that wave E of the higher-degree corrective structure on SEI has begun. The price is expected to be rejected from the red zone for several months to form wave E.
A daily candle closing above the invalidation level will invalidate this analysis.
For risk management, please don't forget stop loss and capital management
Comment if you have any questions
Thank You

BTCUSDT 30M Analysis: Reverse Zone Re-Test Before Major Drop 📊 BTCUSDT 30-Minute Technical Analysis – Reversal Zone Under Pressure
This 30-minute BTCUSDT chart highlights an important bearish setup forming after a sharp downside move. Bitcoin is currently consolidating near a Reversal Zone, suggesting that price may attempt a retest before continuing lower.
🔻 Market Structure Overview
Bitcoin recently experienced:
A strong impulsive sell-off
A brief consolidation phase
A minor recovery back into a previous support now acting as resistance
This structure indicates that sellers are still in control.
🟥 Reversal Zone (Major Resistance Area)
The highlighted red zone is the primary bearish reaction area.
Why this zone matters:
Price broke below this level with strong momentum
It is now acting as a potential supply zone
A bearish candlestick pattern in this area would confirm sellers stepping in
Your chart clearly notes: “Bearish Pattern Need On That Zone.”
A rejection here is the most important bearish confirmation.
🟦 Mini Reversal Zone (Previous Demand Area)
Below current price sits a smaller demand zone.
This zone previously showed:
Buyer reactions
Short-term reversals
Support in the recent downtrend
If price breaks below this mini zone, BTCUSDT may aim for deeper liquidity levels, confirming bearish continuation.
📉 Expected Price Behavior
Based on the projected path drawn on your chart:
Price will retest the Reversal Zone
A bearish engulfing, pin bar, or rejection wick may form
Price may drop aggressively after confirmation
Final target is a deeper zone around the previous swing lows
The downward arrow illustrates the expected continuation if bulls fail to defend nearby support.
⭐ Key Takeaways
Bitcoin remains in a bearish structure on the 30M timeframe
A strong bearish pattern in the Reversal Zone is required for confirmation
Rejection from this resistance may trigger another downside wave
Break and hold above the zone would invalidate the short-term bearish outlook
🧠 Short Summary for Minds
Bitcoin is approaching a key Reversal Zone on the 30-minute chart. If a bearish pattern forms here, BTCUSDT may continue dropping toward lower support levels. Sellers remain strong unless bulls break above the resistance zone.

MYX Analysis (1D)From the point where we placed the red arrow on the chart, the MYX correction has begun.
The corrective phase is either an ABC pattern or a more complex structure. We are currently in Wave B of this phase. Wave B itself is an ABC, where Wave B of B formed a triangle that has now completed, and the price is currently in Wave C of B.
If the price reaches the red zone, we will look for sell/short positions.
The targets are marked on the chart.
A daily candle closing above the invalidation level will invalidate this analysis.
For risk management, please don't forget stop loss and capital management
When we reach the first target, save some profit and then change the stop to entry
Comment if you have any questions
Thank You

Zcash(ZEC/USDT) | Don’t Get Caught in the Whales’ Trap🧠 ZEC/USDT – Smart Money Trap Before the Drop?
Zcash just swept liquidity below a key short-term low 👀 — now reacting from a demand zone, but volume confirms weak bullish intent.
Expect a liquidity grab + distribution phase before price dives toward the $300–$350 range, aligning with higher-timeframe imbalance fills and unmitigated demand below.
Smart Money might be engineering one last bull trap before the real markdown begins.
📉 Watch for rejection from the $620–$650 supply zone to confirm the move!
#ZECUSDT #Zcash #CryptoAnalysis #PriceAction #SmartMoneyConcepts #LiquidityGrab #BearishSetup #CryptoTraders #TradingView #Fibonacci #SwingTrade #MarketStructureBreak #Wyckoff #SMC
💬 What’s your bias — bull trap or reversal? Drop your thoughts below 👇

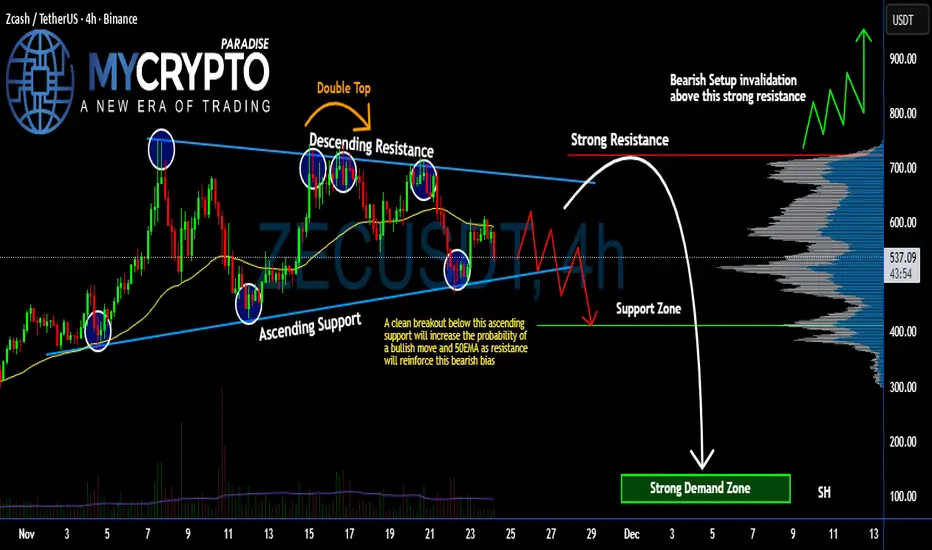
Is #ZEC Showing Signs of Weakness? Bears Ready to take Control Yello Paradisers! #ZECUSDT is flashing some serious structural clues—and if you’re not watching closely, you might miss a textbook bearish setup forming right under your nose. Let’s break down the #Zcash setup:
💎#ZEC has been trading between a clean symmetrical triangle, creating a tightening structure. This squeeze has already produced multiple strong rejections from the descending trendline, including a clear Double Top, which only strengthens the bearish narrative.
💎Current price of #ZECUSD is $536, sitting right above the ascending support. A clean breakdown below this support, especially with the 50 EMA now acting as resistance, would significantly increase the probability of deeper bearish continuation. A bearish retest from below would be the confirmation signal the market is waiting for.
💎If the breakdown plays out, the first target lies at the support zone around $411. But the real liquidity sits much lower, inside the strong demand Zone, where aggressive buyers could re-emerge. A sweep into that zone could fuel a powerful reaction… assuming sellers don’t maintain full control.
💎Bearish setup invalidation kicks in only if #ZEC reclaims the $724 strong resistance level. A breakout and hold above this zone would flip the entire structure and open the gates toward a bullish rally, potentially targeting much higher levels next.
Trade smart, Paradisers. This setup will reward only the disciplined.
MyCryptoParadise
iFeel the success🌴
Is ETH About to Drop Hard?From my perspective, ETHUSDT is showing clear weakness when combining the latest news with the current price action on the chart.
In the final days of November, the USD strengthened and risk-off sentiment spread across the crypto market , causing liquidity to stall. ETH had no positive catalysts , and multiple reports showed that price continued to remain “stuck” below the 3,000–3,100 USD zone — an environment that leans more toward downside than upside.
On the H4 chart, the 3,100 USD zone has become extremely strong resistance . ETH has been repeatedly rejected at the descending trendline — exactly the same pattern as previous reversals. Buying pressure is very weak , showing the market is not ready for a breakout.
Ichimoku also leans bearish: price is below the cloud , the future cloud is thin and sloping downward , signaling weak bullish momentum. The lower-highs, lower-lows structure further reinforces the downside bias.
If ETH continues to be rejected at 3,100, the highest-probability scenario is a pullback toward 2,950–2,980, before potentially dropping further. A very achievable target is 2,870 USD, which aligns with the support zone shown on the chart. If the market weakens further, the 2,750–2,800 zone may also be retested.

SOL , Final Liquidity Zone Before Expansion?SOL has tapped into a major confluence zone combining Fibonacci supports, structural demand and RSI compression. Price is currently reacting from the 0.618–0.786 golden pocket, forming a potential pivot area where reversals often begin.
The descending structure has guided price into a layered support block that has repeatedly acted as a re-accumulation area in previous cycles. The current reaction is still early, but market behaviour suggests that sellers may be losing momentum.
Key Technical Notes:
• The 0.618, 0.786 and 0.886 retracement levels align perfectly with previous demand
• Price is inside a falling wedge, a pattern that often precedes expansion
• RSI is forming a descending resistance line, hinting at a potential bullish breakout
• The higher-timeframe support remains intact as long as SOL holds above the zone
• Liquidity beneath the prior lows has been swept, reducing downside inefficiency
Structural View:
SOL’s corrective leg is nearing exhaustion. If price maintains structure above the golden pocket and breaks the wedge resistance, the next impulsive wave could begin, targeting mid-range levels first, followed by major resistances.
Invalidation:
A daily close below 106.40 would invalidate this structure and open deeper retracement scenarios.
Simple Explanation:
SOL is in a key discount zone. Fibonacci levels, demand and RSI all support the possibility of a reversal. A breakout above the trendline can ignite the next wave. Until then, the zone acts as a crucial turning point

CHZ Looks Bullihs (2H)It appears that an ABC pattern has formed on the chart, with wave B being a completed diametric pattern. We are now only looking for an entry opportunity for a buy/long position, with the low-risk zone highlighted in green on the chart.
The targets are also marked on the chart.
A 4-hour candle closing below the invalidation level will invalidate this analysis.
For risk management, please don't forget stop loss and capital management
When we reach the first target, save some profit and then change the stop to entry
Comment if you have any questions
Thank You

YALA Analysis (8H)The YALA coin appears to be forming a diametric/symmetrical pattern on the hourly timeframes.
It seems we are currently in Wave F. The red zone is an appropriate area for Wave F to complete. In the red zone, we will look for sell/short positions.
The targets for Wave G are marked on the chart.
A daily candle closing above the invalidation level will invalidate this analysis and outlook
For risk management, please don't forget stop loss and capital management
When we reach the first target, save some profit and then change the stop to entry
Comment if you have any questions
Thank You

Title: FARTCOIN | Breakout Retest and Long-Term Structure PlayAfter a long period of compression, FARTCOIN (FART/USDT) is showing early signs of a potential trend reversal on the 1D chart.
Price has respected a descending resistance line for months while simultaneously forming higher lows on the ascending yellow trendline — signaling that bullish pressure may be building.
Currently, price is testing the intersection point between descending resistance and ascending support, forming what could be a symmetrical triangle breakout setup.
If we can hold above the breakout area and reclaim the mid-structure level (~0.40–0.42), the next technical objectives would be:
TP1: 0.56 – Retest of prior structural resistance
TP2: 0.73 – Measured move from the breakout pattern
TP3: 1.00+ – Potential full cycle expansion target
⚠️ Invalidation:
A daily candle close below 0.30 would suggest a failed breakout and continuation of the prior downtrend.
Educational Breakdown:
This setup is designed to teach how trendline confluence + structural compression can reveal early trend reversal zones.
Notice how the breakout leg aligns with a swing projection pattern, confirming momentum shift probability.
Bias:
Directional Bias: Bullish
Setup Type: Breakout + Retest (Mid-term swing)
Timeframe: 1D

REDSTONE – Major Support Bounce or Break? Critical Level AheadREDSTONE is sitting at a major decision point.
Price has been compressing under a descending trendline while holding a long-term support zone (highlighted in brown). This combination usually leads to an explosive move — either a breakout reclaim, or a full breakdown into the lower liquidity pocket.
Key Breakdown:
• Long-Term Support Zone:
Price continues to respect this demand block, showing buyers are still active here.
• Descending Trendline:
Price has tapped this line multiple times. A clean daily candle close above it would confirm a structural shift.
• Two Possible Scenarios:
🔵 Bullish Case (Blue Path)
Break & close above the descending trendline
Reclaim of the minor structure (red box)
Potential continuation toward $0.38 → $0.45
This path follows a standard reversal pattern after a long accumulation period.
⚪ Bearish Case (White Path)
Failure to break the trendline
Breakdown from the brown support zone
Full liquidity sweep into the untested zone around $0.16 – $0.18
This level aligns with previous inefficiency + untouched demand.
Why This Matters:
REDSTONE is compressing — and historically, this type of compression leads to large directional moves. This chart is not a signal, but a structural expectation map showing the most probable paths based on trendline behavior + support strength.
📘 Disclaimer (Education Only)
This post is for educational and informational purposes only. It is not financial advice, and I am not a financial advisor.
All analysis reflects my personal opinions and charting for learning purposes.
Always do your own research and manage your own risk before making any trades.

Is #HBAR Finally Ready to See a Massive Rebound or Not? Yello, Paradisers! Is this breakout from the falling wedge the beginning of a real trend reversal on #HBARUSDT, or not? Let’s break down #Hedera setup:
💎#HBAR is currently trading around $0.145, and after weeks of downtrend within a clearly defined falling wedge, we finally saw a breakout above descending resistance. This is the first bullish signal, but it’s not yet confirmed.
💎For real confirmation, we need to see the 50EMA hold as support in the coming candles. If that happens, the probability of a sustained bullish move increases dramatically.
💎On the upside, the immediate target is the Moderate Resistance at $0.177. A break above that zone, ideally on strong volume, would open the path for a larger move toward the Strong Resistance level at $0.209, and that’s where bulls will likely take significant profits.
💎However, if #HBARUSD fails to hold above the support zone near $0.134, and especially if price dips back into the wedge structure, we’ll likely revisit the Strong Demand Zone at $0.110. Below that, the entire bullish setup gets invalidated, and we’ll expect a retest of the recent lows, with increased downside pressure from short setups forming below.
Strive for consistency, wait for clear confirmations, and remember that discipline always beats chasing quick profits.
MyCryptoParadise
iFeel the success🌴
