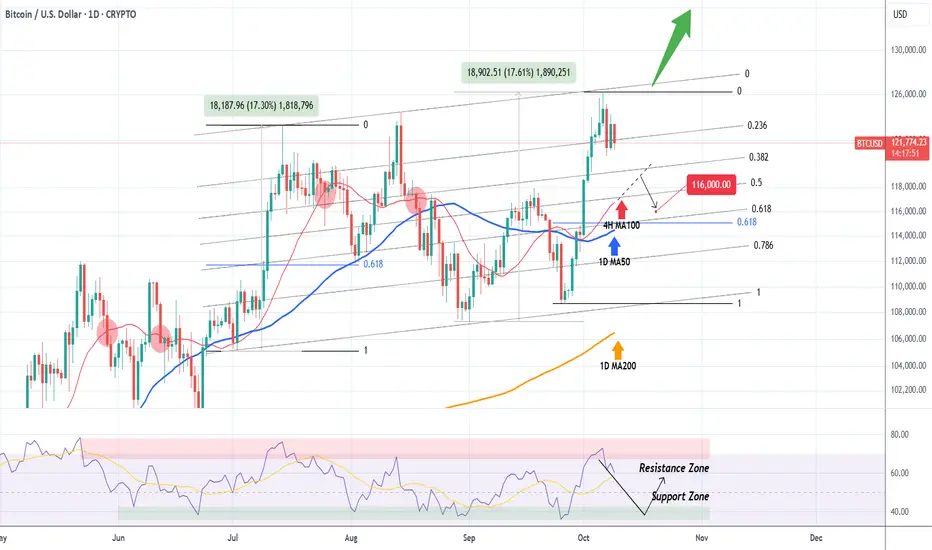
BITCOIN How low can it pull back??Bitcoin (BTCUSD) got rejected on the Higher Highs trend-line we mentioned on our last analysis and is already pulling back. The question is how far can it drop?
Today we expand on that analysis by applying the Fibonacci Channel on the Higher Highs trend-line. Instantly we can see that the Channel Up has two almost perfectly symmetrical Bullish Legs (+17.30% and +17.61% respectively).
The key on this pattern is the 4H MA100 (red trend-line). Every time BTC broke below it since May 29, the decline extended all the way to at least the 1D MA50 (blue trend-line).
Since the 1D RSI also got rejected on its Resistance Zone, we expect a pull-back towards its Support Zone and if the 4H MA100 breaks, further extension towards the 1D MA50. We estimate a potential target to be $116000, which is marginally above the 0.618 Fibonacci retracement level, where the August 02 bounce took place. Needless to say, a break (and 1D candle close) above the Channel's top (Higher Highs trend-line), invalidates any pull-back scenario and, as mentioned previously, constitutes a bullish break-out to a new pattern/ rally.
What do you think will happen next? Feel free to let us know in the comments section below!
-------------------------------------------------------------------------------
** Please LIKE 👍, FOLLOW ✅, SHARE 🙌 and COMMENT ✍ if you enjoy this idea! Also share your ideas and charts in the comments section below! This is best way to keep it relevant, support us, keep the content here free and allow the idea to reach as many people as possible. **
-------------------------------------------------------------------------------
💸💸💸💸💸💸
👇 👇 👇 👇 👇 👇
Cryptocurrencies
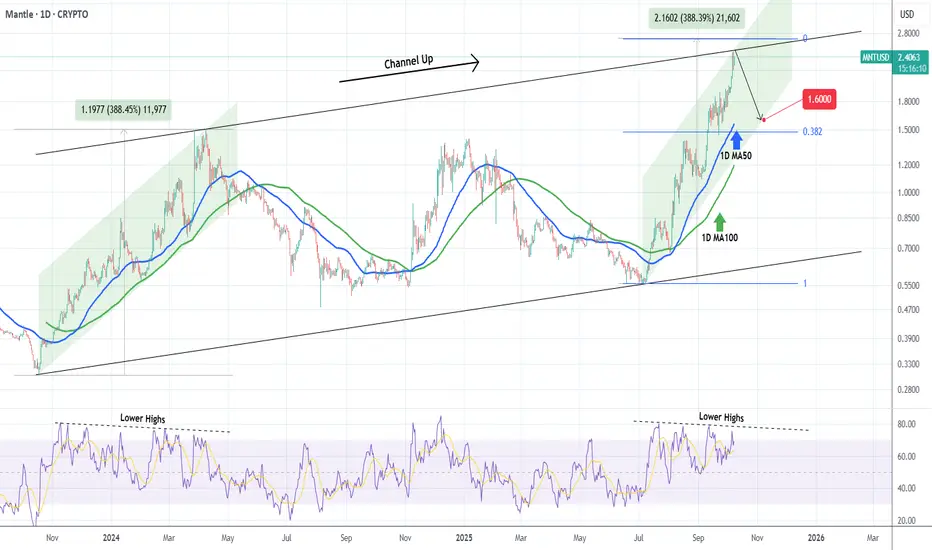
MANTLE Hit the top of its 2-year Channel Up. Correction ahead?Mantle (MNTUSD) has been trading within a Channel Up since its October 18 2023 market bottom and right now the price just hit the top (Higher Highs trend-line) of this pattern.
The current Bullish Leg has almost risen as much as the first one (+388.45%) so technically a pull-back wouldn't be unexpected at this point. Before it resumes the long-term trend and potentially breaks above the Channel Up, we expect the price to test at least its 1D MA100 (green trend-line), which is the typical Support during such Legs, a 1.600.
-------------------------------------------------------------------------------
** Please LIKE 👍, FOLLOW ✅, SHARE 🙌 and COMMENT ✍ if you enjoy this idea! Also share your ideas and charts in the comments section below! This is best way to keep it relevant, support us, keep the content here free and allow the idea to reach as many people as possible. **
-------------------------------------------------------------------------------
💸💸💸💸💸💸
👇 👇 👇 👇 👇 👇
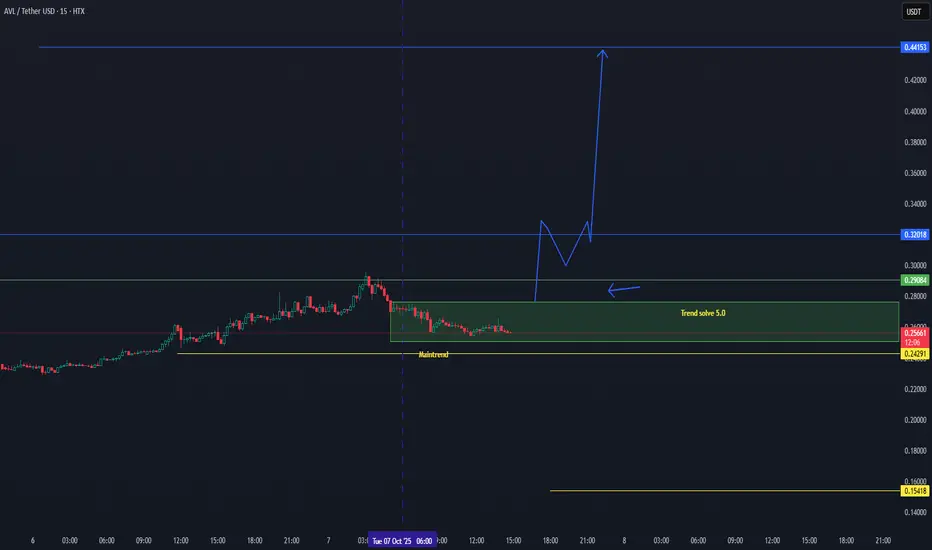
AVL/USDT — In the Solve Zone, Breakout Imminent BEST 2025AVL/USDT — In the Solve Zone, Breakout Imminent 🚀
There is a good chance for 1 time whale candle breakout.
AVL is currently trading inside the “Trend Solve 5.0” zone, showing strong signs of accumulation before a potential breakout. The market is coiling tightly within structure — an indication that momentum is building for a decisive move.
🟢 Main Trend Support: $0.24 — Holding firmly, maintaining bullish structure.
⚙️ Solve Zone Active: Price is consolidating between $0.25–$0.29, a key setup area before expansion.
📈 Breakout Confirmation: A clear move above $0.29 could trigger a strong bullish wave toward the next major resistance at $0.44.
🔄 Pattern Structure: Price forming a potential M-to-V recovery, often signaling a sharp upside continuation once confirmed.
Technical Outlook:
✅ Main Trend: Active and healthy
⚙️ Current Phase: Solve Zone accumulation
🎯 Breakout Target: $0.44
🧭 Invalidation: Below $0.24 (main trend break)
Summary:
AVL remains in a critical technical position — the Solve Zone is nearly complete, suggesting a breakout can occur at any moment. Momentum indicators and price structure both support a potential upside expansion once $0.29 is cleared.
📊 Bias: Bullish
📈 Focus Level: $0.29 Breakout
🎯 Next Major Target: $0.44
BITCOIN This is the last Resistance standing.Bitcoin (BTCUSD) got rejected (and is currently pulling back) on the Higher Highs trend-line that started on July 14. This is technically the last Resistance before a complete technical bullish break-out that will take the market to a new pattern out of this 3-month consolidation phase.
Until that happens, there are high probabilities to extend this pull-back all the way to the 0.382 Fibonacci extension ($119.5k), which is the minimum level that all similar corrections within these 3 months pulled back to.
As you can see such similar corrections have all been on 4H RSI Bearish Divergences, which have been Lower Highs against BTC's Higher Highs, typical indicator of a Top.
So what do you think will happen next, pull-back or break-out? Feel free to let us know in the comments section below!
-------------------------------------------------------------------------------
** Please LIKE 👍, FOLLOW ✅, SHARE 🙌 and COMMENT ✍ if you enjoy this idea! Also share your ideas and charts in the comments section below! This is best way to keep it relevant, support us, keep the content here free and allow the idea to reach as many people as possible. **
-------------------------------------------------------------------------------
💸💸💸💸💸💸
👇 👇 👇 👇 👇 👇

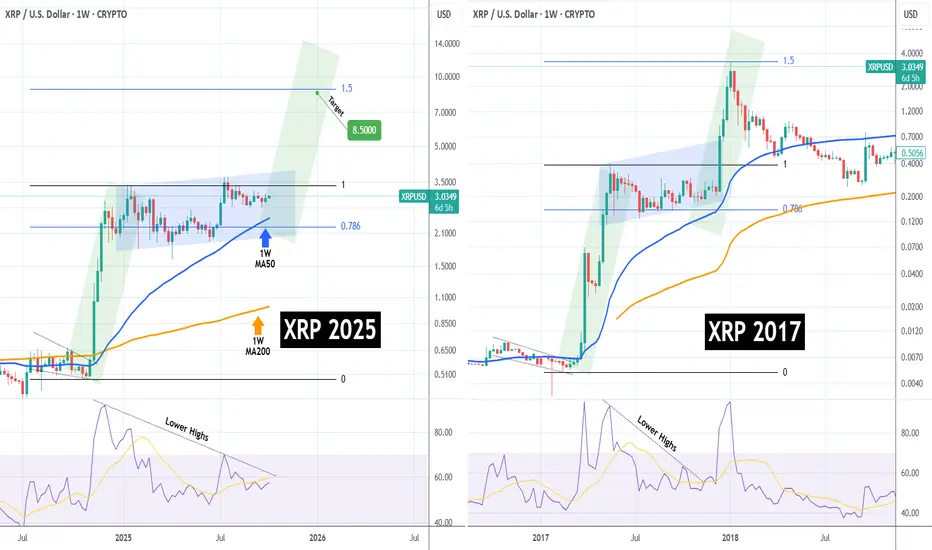
XRPUSD getting ready for its NOW-or-NEVER moment to $8.500XRP (XRPUSD) has been trading sideways since the July 14 2025 High in a growth pattern that resembles 2017. As it approaches the 1W MA50 (blue trend-line), the market gets closer to its now-or-never moment as the 1W MA50 is expected to hold and provide a bullish boost similar to December 11 2017, which made the price rally to its 1.5 Fibonacci extension.
With even the 1W RSI sequences among the two fractals also looking identical, we can see XRP peaking around $8.500 (Fib 1.5 ext), if this model repetition is completed.
-------------------------------------------------------------------------------
** Please LIKE 👍, FOLLOW ✅, SHARE 🙌 and COMMENT ✍ if you enjoy this idea! Also share your ideas and charts in the comments section below! This is best way to keep it relevant, support us, keep the content here free and allow the idea to reach as many people as possible. **
-------------------------------------------------------------------------------
💸💸💸💸💸💸
👇 👇 👇 👇 👇 👇
Bitcoin Consolidates Above Support — Main Trend IntactBitcoin (BTC/USDT) — Holding Strong Above Key Support Zones 💪
Bitcoin continues to trade above the low-timeframe support at $122,100, showing resilience and consolidation after its recent upward move.
✅ Low Time Frame Support ($122.1K): BTC remains stable above this short-term structure, suggesting buyers are still in control.
✅ Main Trend Support ($110.2K): The larger bullish structure remains intact as long as price holds above the $110.2K region.
📈 Momentum Outlook: A sustained hold above $122K could set up another push toward $126K–$130K, confirming bullish continuation.
Summary:
BTC remains bullish above both its low-timeframe and main-trend levels. Short-term consolidation is healthy, and the next breakout could target new local highs if momentum strengthens.
🎯 Support: $122.1K / $110.2K
🎯 Resistance: $126K / $130K
📊 Bias: Bullish continuation

BITCOIN 125k broke (new ATH) and it's not stopping there!Bitcoin (BTCUSD) hit $125700 yesterday, making a new All Time High (ATH), closing the 2nd strongest 1W candle of the year. This is a confirmed detachment from the Former Resistance-turned-Support trend-line, following a double bottom bounce on the Bull Cycle's (Higher Lows) Buy Zone.
As you can see, this structure is similar to the first green zone bounce in August 2023 that eventually rose to its 2.0 Fibonacci extension before turning sideways for a while. Even the December 16 2024 High was on the 2.0 Fibonacci extension, even though the formation that preceded it (March - October 2024), wasn't that much similar to the other two.
Based on that, we can see BTC approaching $160000 (Fib 2.0 ext).
Do you expect the market to hit that level? Feel free to let us know in the comments section below!
-------------------------------------------------------------------------------
** Please LIKE 👍, FOLLOW ✅, SHARE 🙌 and COMMENT ✍ if you enjoy this idea! Also share your ideas and charts in the comments section below! This is best way to keep it relevant, support us, keep the content here free and allow the idea to reach as many people as possible. **
-------------------------------------------------------------------------------
💸💸💸💸💸💸
👇 👇 👇 👇 👇 👇

BTC STILL IN TREND FOR MORE.. UPDATE 04-10-2025📊 Market Update
Bitcoin (BTC):
Bitcoin is maintaining its main upward trend, which continues to define the overall bullish structure. At the moment, BTC is trading in a new lower time-frame zone and needs to hold above $121.6K to confirm a green (bullish) structure on the lower time frame.
Bitcoin is positive until now

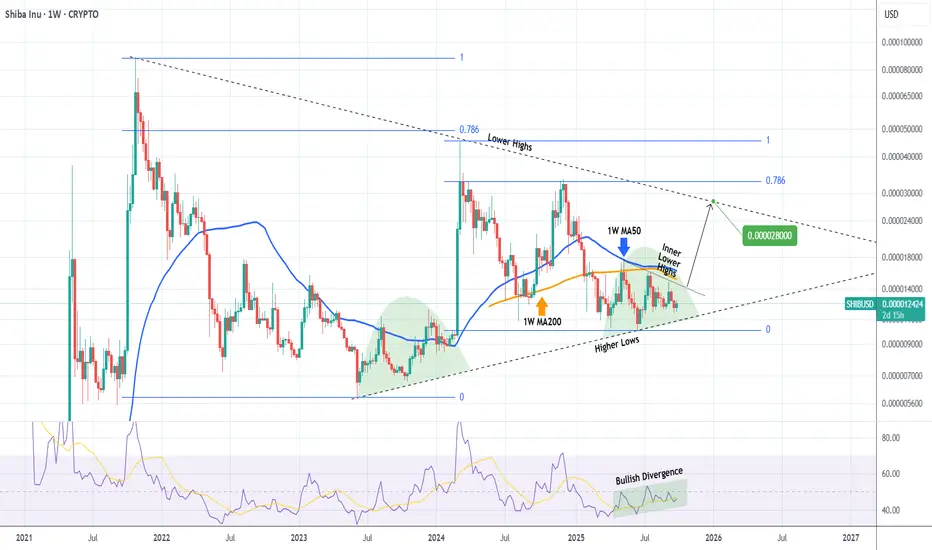
SHIBA Strong break-out expected, targeting 0.000028!Shiba Inu (SHIBUSD) has been trading within a Triangle pattern since the October 25 2021 Top of its previous Bull Cycle. The successive Lower Highs of the current Cycle have failed to make a new All Time High (ATH) and have 'trapped' the price action below its 1W MA50 (blue trend-line), is a similar Accumulation Phase on the Higher Lows like June 2023 - January 2024.
However, the 1W RSI has been rising within a Channel Up, showcasing a technical Bullish Divergence. If the price breaks above the Inner Lower Highs trend-line, it will be a first Buy Signal with confirmation coming above the 1W MA50. In that case, we expect at least a 0.000028 test of the Triangle's top (Lower Highs), still a conservative target given that the 2024 rally almost hit its 0.786 Fibonacci retracement level.
-------------------------------------------------------------------------------
** Please LIKE 👍, FOLLOW ✅, SHARE 🙌 and COMMENT ✍ if you enjoy this idea! Also share your ideas and charts in the comments section below! This is best way to keep it relevant, support us, keep the content here free and allow the idea to reach as many people as possible. **
-------------------------------------------------------------------------------
💸💸💸💸💸💸
👇 👇 👇 👇 👇 👇
BITCOIN Are we going to see 'UPTOBER' this time??Bitcoin (BTCUSD) has historically seen incredible rallies during the month of October and even more so those Octobers of the last years of Bull Cycles, like the one we are at now. Those rally phases have been very accurately called 'Uptober' rallies.
More specifically, the last three such Octobers (2021, 2017 and 2013) have been massively bullish, all starting after September corrections (Channel Down patterns). In 2013, October reached the 2.382 Fibonacci extension from September's correction, in 2017 and 2021 it reached the 1.786 Fibonacci ext.
As a result, if 'Uptober' is repeated again, this historic price actions gives us an optimistic Target at $132k (Fib 2.382) and a less optimistic one at $125.5k (Fib 1.786).
Do you think we will get such Uptober one more time? Feel free to let us know in the comments section below!
-------------------------------------------------------------------------------
** Please LIKE 👍, FOLLOW ✅, SHARE 🙌 and COMMENT ✍ if you enjoy this idea! Also share your ideas and charts in the comments section below! This is best way to keep it relevant, support us, keep the content here free and allow the idea to reach as many people as possible. **
-------------------------------------------------------------------------------
💸💸💸💸💸💸
👇 👇 👇 👇 👇 👇

CRONOS Giant Bull Flag can lead it to 0.85000 just like in 2021.Cronos (CROUSD) has been trading within a Bullish Megaphone through the entirety of its current Bull Cycle. Ahead of its first 1W Golden Cross, the pattern draws many similarities with the Bullish Megaphone of the previous Cycle.
More specifically, it appears we are inside a Bull Flag similar to April - May 2021, which after testing and holding the 1W MA100 (green trend-line), it rebounded and peaked just above the 1.618 Fibonacci extension.
As you can see the Fibonacci structure between the two Megaphones is quite similar, giving high probabilities of a continuation. As a result, as long as the 1W MA00 holds, we expect Cronos to dip some more and then rebound to 0.85000 (Fib 1.618 ext).
-------------------------------------------------------------------------------
** Please LIKE 👍, FOLLOW ✅, SHARE 🙌 and COMMENT ✍ if you enjoy this idea! Also share your ideas and charts in the comments section below! This is best way to keep it relevant, support us, keep the content here free and allow the idea to reach as many people as possible. **
-------------------------------------------------------------------------------
💸💸💸💸💸💸
👇 👇 👇 👇 👇 👇

BITCOIN making a bullish break-out similar to July'sBitcoin (BTCUSD) just broke above the Lower Highs trend-line of its August 14 All Time High (ATH). This was implemented after a bottom on the 5-month Higher Lows trend-line as well as the 1D RSI Support.
The last time all those conditions were fulfilled was on the July 02 Lower Highs break-out, after which BTC completed a +25.33% rally from the Low, almost touching its 1.786 Fibonacci extension.
Ahead of another 4H Golden Cross, just like then, we expect Bitcoin to make another +25.33% Bullish Leg and reach at least $136000 on the medium-term.
Do you think that's reasonable to expect within October? Feel free to let us know in the comments section below!
-------------------------------------------------------------------------------
** Please LIKE 👍, FOLLOW ✅, SHARE 🙌 and COMMENT ✍ if you enjoy this idea! Also share your ideas and charts in the comments section below! This is best way to keep it relevant, support us, keep the content here free and allow the idea to reach as many people as possible. **
-------------------------------------------------------------------------------
💸💸💸💸💸💸
👇 👇 👇 👇 👇 👇

XLMUSD getting ready for an explosive break-out.Stellar (XLMUSD) has been trading within a Descending Triangle since the July 18 High and currently is ranging within its Support level and the 1D MA50 (blue trend-line).
A similar Ascending Triangle back in May - June, rallied aggressively to its 2.0 Fibonacci extension (the July 18 High) after breaking above both its Lower Highs trend-line and the 1D MA50. Even the 1D RSI sequences among the two fractals are similar.
As a result, if the price breaks above the 1D MA50 - Lower Highs trend-line, we will turn bullish, targeting 0.78000 (Fib 2.0 ext).
-------------------------------------------------------------------------------
** Please LIKE 👍, FOLLOW ✅, SHARE 🙌 and COMMENT ✍ if you enjoy this idea! Also share your ideas and charts in the comments section below! This is best way to keep it relevant, support us, keep the content here free and allow the idea to reach as many people as possible. **
-------------------------------------------------------------------------------
💸💸💸💸💸💸
👇 👇 👇 👇 👇 👇

Bitcoin HOLDING THE MAIN TREND.. UPDATE 30-09-2025BTC/USDT Update
🔻 Bitcoin is currently trading below the low time frame zone, showing short-term weakness.
✅ However, BTC is still holding the main trend, which keeps the bigger picture positive.
📊 As long as the main trend support (around $110K) is defended, the market structure remains intact.
🚀 A rebound from this area could bring BTC back into the low time frame range and open the way toward $115K+.
📌 Summary:
BTC lost the low time frame, but the fact that it’s holding the main trend is a key positive signal. This level is crucial for maintaining the bullish outlook.

BITCOIN Did the 1W MA20 just save the day??On one of our recent analyses we talked about the importance of the 1W MA20 (red trend-line) for Bitcoin (BTCUSD) and the continuation of its non-stop bullish trend since the April 07 2025 Low.
As mentioned then, BTC was likely to extend the trend as long as the 1W candles keep closing above the 1W MA20. The three times a candle didn't, since June 2023, the price declined more to hit (or come very close to) the 1W MA50 (blue trend-line).
Last week was again a successful 1W candle close above the 1W MA50, third time in a month (since August 25) to do so. Technically that solidifies it as a Support and as long as it holds, Bitcoin has more probabilities to repeat at least a +96.38% rally ('weakest' rally it had on this Bull Cycle) and test $145000.
So do you think the 1W MA50 just saved the day and a new rally is ahead of us? Feel free to let us know in the comments section below!
-------------------------------------------------------------------------------
** Please LIKE 👍, FOLLOW ✅, SHARE 🙌 and COMMENT ✍ if you enjoy this idea! Also share your ideas and charts in the comments section below! This is best way to keep it relevant, support us, keep the content here free and allow the idea to reach as many people as possible. **
-------------------------------------------------------------------------------
💸💸💸💸💸💸
👇 👇 👇 👇 👇 👇

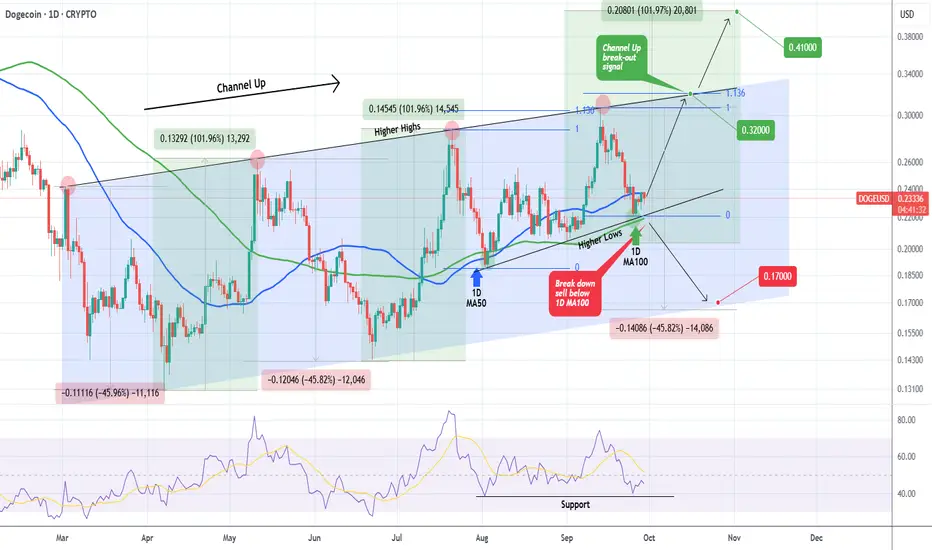
DOGE This is how to trade it in October.Dogecoin (DOGEUSD) has been trading within a Channel Up since March but recently has found a new Support on the Higher Lows trend-line that started on the August 03 Low. This price action has been additionally supported by the 1D MA100 (green trend-line).
As long as the 1D MA100 holds, October should see at least Doge testing the top (Higher Highs trend-line) of the pattern. Given that the previous Higher Lows rebound peaked on the 1.136 Fibonacci extension, our Target will be 0.3200.
If the Higher Highs trend-line breaks (1D candle close above it), extend buying to a total +101.96% rise from the bottom, targeting 0.41000.
If however the 1D MA100 breaks (candle close below it), we expect the Channel Up to go for a full pricing of a Higher Low bottom, on a similar -45.82% decline to both previous Bearish Legs, targeting 0.17000.
As a result, the current price action, which has Doge sitting just above the 1D MA100, offers a great reward on the lowest possible risk.
-------------------------------------------------------------------------------
** Please LIKE 👍, FOLLOW ✅, SHARE 🙌 and COMMENT ✍ if you enjoy this idea! Also share your ideas and charts in the comments section below! This is best way to keep it relevant, support us, keep the content here free and allow the idea to reach as many people as possible. **
-------------------------------------------------------------------------------
💸💸💸💸💸💸
👇 👇 👇 👇 👇 👇
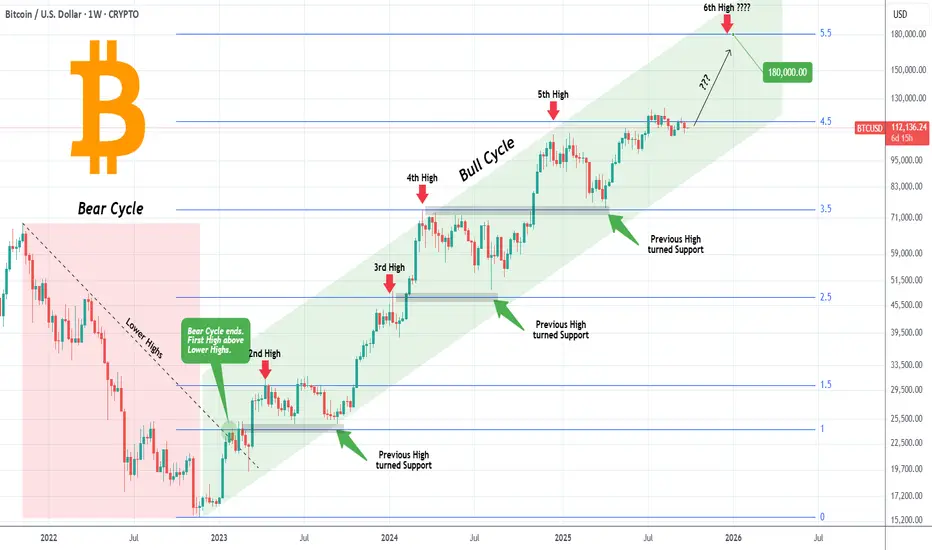
BITCOIN Is there time left for one final run??Bitcoin (BTCUSD) has been trading within a Channel Up pattern through the entirety of its Bull Cycle. The key characteristic of this pattern, which has also helped us at taking profits during each phase in timely manner, has been that every High since the Bear Cycle's Lower Highs trend-line broke, has been on a +0.5 Fibonacci extension interval.
As you can see, starting from Fib 1.5 ext, BTC has fulfilled the pattern by making Highs on the 2.5, 3.5 and 4.5 Fibs so far. What technically remains plausible until the end of the year is the 5.5 Fib ext, which sits at $180k.
With the 4-year Cycle theory suggesting a Cycle Top a little before the end of the year, is it realistic to expect this Target? Do you think there's time for BTC to make one final run like this? Feel free to let us know in the comments section below!
-------------------------------------------------------------------------------
** Please LIKE 👍, FOLLOW ✅, SHARE 🙌 and COMMENT ✍ if you enjoy this idea! Also share your ideas and charts in the comments section below! This is best way to keep it relevant, support us, keep the content here free and allow the idea to reach as many people as possible. **
-------------------------------------------------------------------------------
💸💸💸💸💸💸
👇 👇 👇 👇 👇 👇
BTC TREND CHANNEL - BITCOIN TRENDING UPTRENDBitcoin is in a new uptrend on the lower time frames. There is a high chance BTC will target between $112K and $113K in the short term. From there, we could see the daily trend of Bitcoin develop further.
Follow this channel for daily BTC updates
Thank you

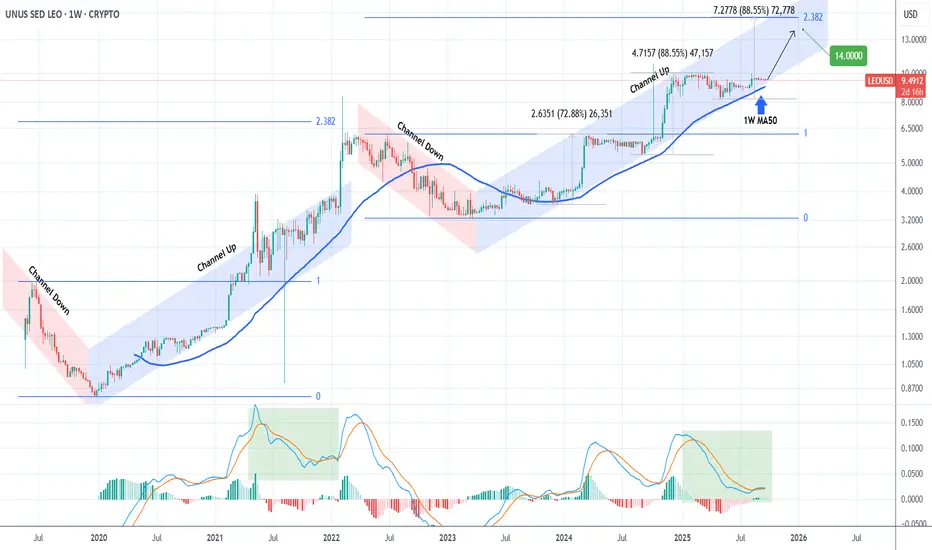
LEOUSD Ready for an explosive rally.Unus Sed Leo (LEOUSD) has been trading within a Channel Up for the entirety of its current Bull Cycle. Lately it has been trading sideways since the August 11 High, but still strongly supported by the 1W MA50 (blue trend-line).
This level has been the Cycle's major Support since September 2023 (2 years) after which it never closed a 1W candle below it. As long as it holds, we expect at least another +72.88% rise from the recent Low, similar to both previous Bullish Legs of the Channel Up, which gives a 14.000 long-term Target.
That is just below the 2.382 Fibonacci extension from the previous Cycle High, which is the level that Leo token reached during the previous Cycle. As you can see, it also consisted of a Channel Down (Bear Phase) and Channel Up (Bull Phase), but exploded in its final weeks more aggressively.
-------------------------------------------------------------------------------
** Please LIKE 👍, FOLLOW ✅, SHARE 🙌 and COMMENT ✍ if you enjoy this idea! Also share your ideas and charts in the comments section below! This is best way to keep it relevant, support us, keep the content here free and allow the idea to reach as many people as possible. **
-------------------------------------------------------------------------------
💸💸💸💸💸💸
👇 👇 👇 👇 👇 👇
HYPERLIQUID This is its last chance to rebound.Hyperliquid (HYPEUSD) has been trading within a 4-month Channel Up and today made contact with its 1W MA20 for the first time since May 06. With the 1D MA100 (green trend-line) broken also yesterday, this is the token's last chance to find Support as it sits at the bottom of the pattern.
If it holds and doesn't close a 1W candle below the 1W MA20, this would technically be the new Higher Low that initiated the next Bullish Leg. All previous sequences reached at least the 1.236 Fibonacci extension, which is at 64.500.
If the candle fails on the 1W MA20 however, we expect more aggressive selling towards Support 1 where contact can be possibly made with the 1D MA200 (orange trend-line). In that case, our Target will be 36.000.
It is also worth mentioning that the 1D RSI is just above its 6-month Support Zone, enhancing the probabilities for a rebound.
-------------------------------------------------------------------------------
** Please LIKE 👍, FOLLOW ✅, SHARE 🙌 and COMMENT ✍ if you enjoy this idea! Also share your ideas and charts in the comments section below! This is best way to keep it relevant, support us, keep the content here free and allow the idea to reach as many people as possible. **
-------------------------------------------------------------------------------
💸💸💸💸💸💸
👇 👇 👇 👇 👇 👇

BITCOIN Can this pattern hold one last time?Bitcoin (BTCUSD) is holding (so far) its 1W MA20 (red trend-line) as mentioned on our previous analysis, which is critical for the continuation of the bullish trend.
Today however, we bring you a pattern that may have gone unnoticed and as long as it holds, the market should be expecting a new High.
That is the transition of a former Resistance level (formed from a previous High) that turns into Support (new Low), which generates a rally that so far has measured a minimum +45.73% (from the High).
However every such Low was priced at or very close to the 1W MA50 (blue trend-line). This time the 1W MA50 is at 100k and a way for this pattern to be fulfilled, BTC should at least trade sideways until it comes close to the 1W MA50.
In any case, as long as the Support level holds, a +45.73% rise, would take us to $157000.
Do you think we have chances for that? Feel free to let us know in the comments section below!
-------------------------------------------------------------------------------
** Please LIKE 👍, FOLLOW ✅, SHARE 🙌 and COMMENT ✍ if you enjoy this idea! Also share your ideas and charts in the comments section below! This is best way to keep it relevant, support us, keep the content here free and allow the idea to reach as many people as possible. **
-------------------------------------------------------------------------------
💸💸💸💸💸💸
👇 👇 👇 👇 👇 👇

AVAXUSD Channel Up $28 pull-back or break-out to $47??Avalanche (AVAXUSD) has been trading within a 3-month Channel Up and last Friday hit its top (Higher Highs trend-line).
It is no surprise that the price got rejected and turned sideways there as it also completed a +75% rise from the last Higher Low, which is exactly what the previous Bullish Leg did. That structure eventually pulled back to its 1D MA50 (blue trend-line) and the 0.5 Fibonacci retracement level before pricing the Higher Low.
As a result, we expect a decline towards the 1D MA50, targeting $28.00, as long as the Channel Up doesn't break upwards.
If it does however, we expect an aggressive rally towards the 0.9 Fibonacci level from the previous Top, targeting $47.00.
-------------------------------------------------------------------------------
** Please LIKE 👍, FOLLOW ✅, SHARE 🙌 and COMMENT ✍ if you enjoy this idea! Also share your ideas and charts in the comments section below! This is best way to keep it relevant, support us, keep the content here free and allow the idea to reach as many people as possible. **
-------------------------------------------------------------------------------
💸💸💸💸💸💸
👇 👇 👇 👇 👇 👇

BITCOIN The hidden pivot of the Bollinger Bands (140k or 100k?).Bitcoin (BTCUSD) is testing again the basis (black trend-line) of the 1W Bollinger Bands (BB), just 3 weeks after it held and initiated a rebound.
On this chart you can see that since July 2023, every time BTC closed a 1W candle below the BB basis level, the price pulled-back to its 1W MA50 (blue trend-line) and then rebounded. That is its ultimate long-term Support so far.
As a result, all eyes should be on this week's closing. Below the BB basis, we should most likely seek the 1W MA50 a little above the $100000 mark. Ideally, it should coincide with a 1W RSI Support Zone test (holding since September 2023).
If the BB basis holds though, we should extend the BB top within the $130-140k Zone.
What do you think will come first? Feel free to let us know in the comments section below!
-------------------------------------------------------------------------------
** Please LIKE 👍, FOLLOW ✅, SHARE 🙌 and COMMENT ✍ if you enjoy this idea! Also share your ideas and charts in the comments section below! This is best way to keep it relevant, support us, keep the content here free and allow the idea to reach as many people as possible. **
-------------------------------------------------------------------------------
💸💸💸💸💸💸
👇 👇 👇 👇 👇 👇
